
Facets (counts & tabulations) of parts-of-speech
The student, researcher, or scholar can use OpenRefine to open one or more different types of delimited files. OpenRefine will then parse the file(s) into fields. It can makes many things easy such as finding/replacing, faceting (think “grouping”), filtering (think “searching”), sorting, clustering (think “normalizing/cleannig”), counting & tabulating, and finally, exporting data. OpenRefine is an excellent go-between when spreadsheets fail and full-blown databases are too hard to use. OpenRefine eats delimited files for lunch.
Many (actually, most) of the files in a study carrel are tab-delimited files, and they will import into OpenRefine with ease. For example, after all a carrel’s part-of-speech (pos) files are imported into OpenRefine, the student, researcher, or scholar can very easily count, tabulate, search (filter), and facet on nouns, verbs, adjectives, etc. If the named entities files (ent) are imported, then it is easy to see what types of entities exist and who might be the people mentioned in the carrel:
Facets (counts & tabulations) of parts-of-speech
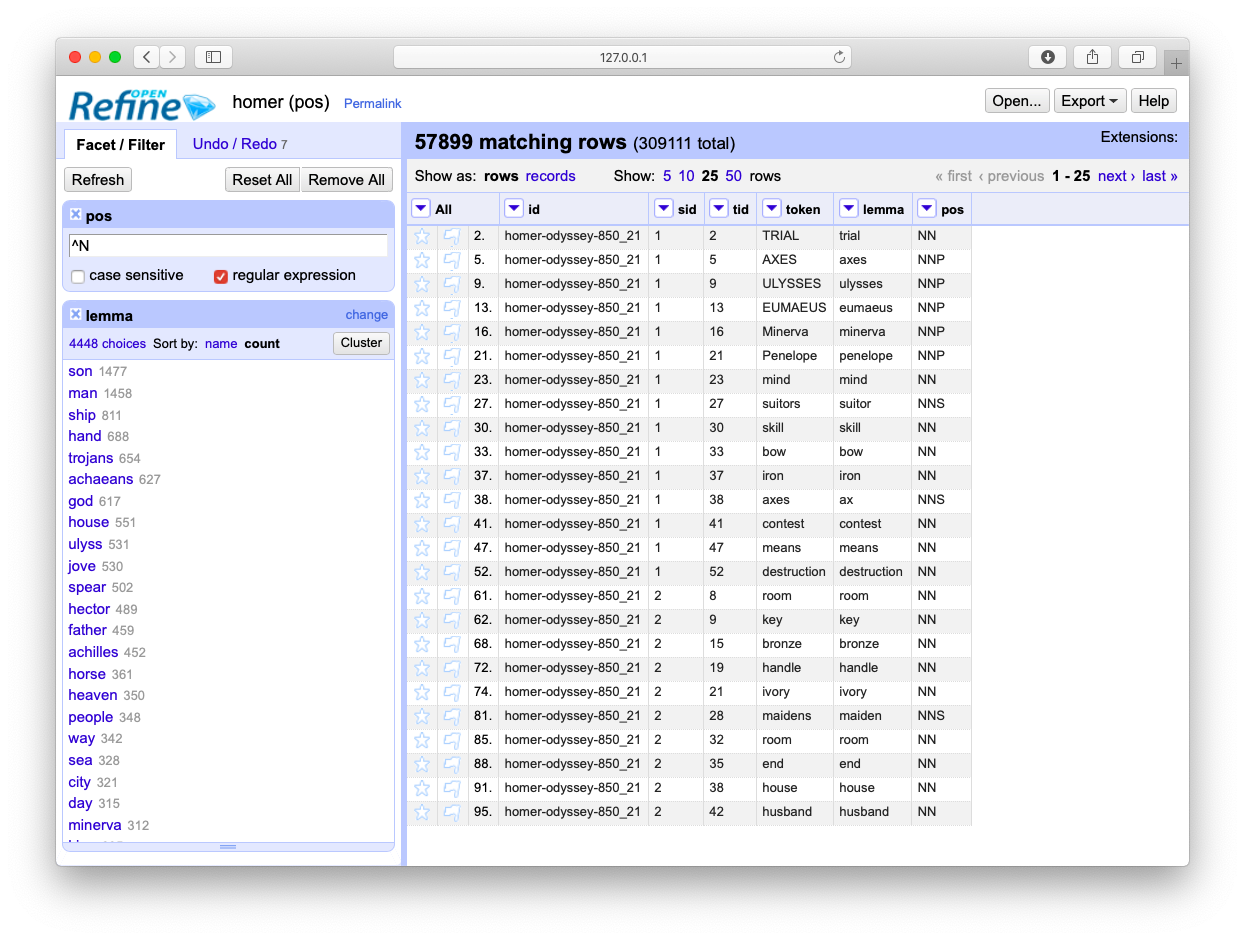
Most frequent nouns

Types of named-entities
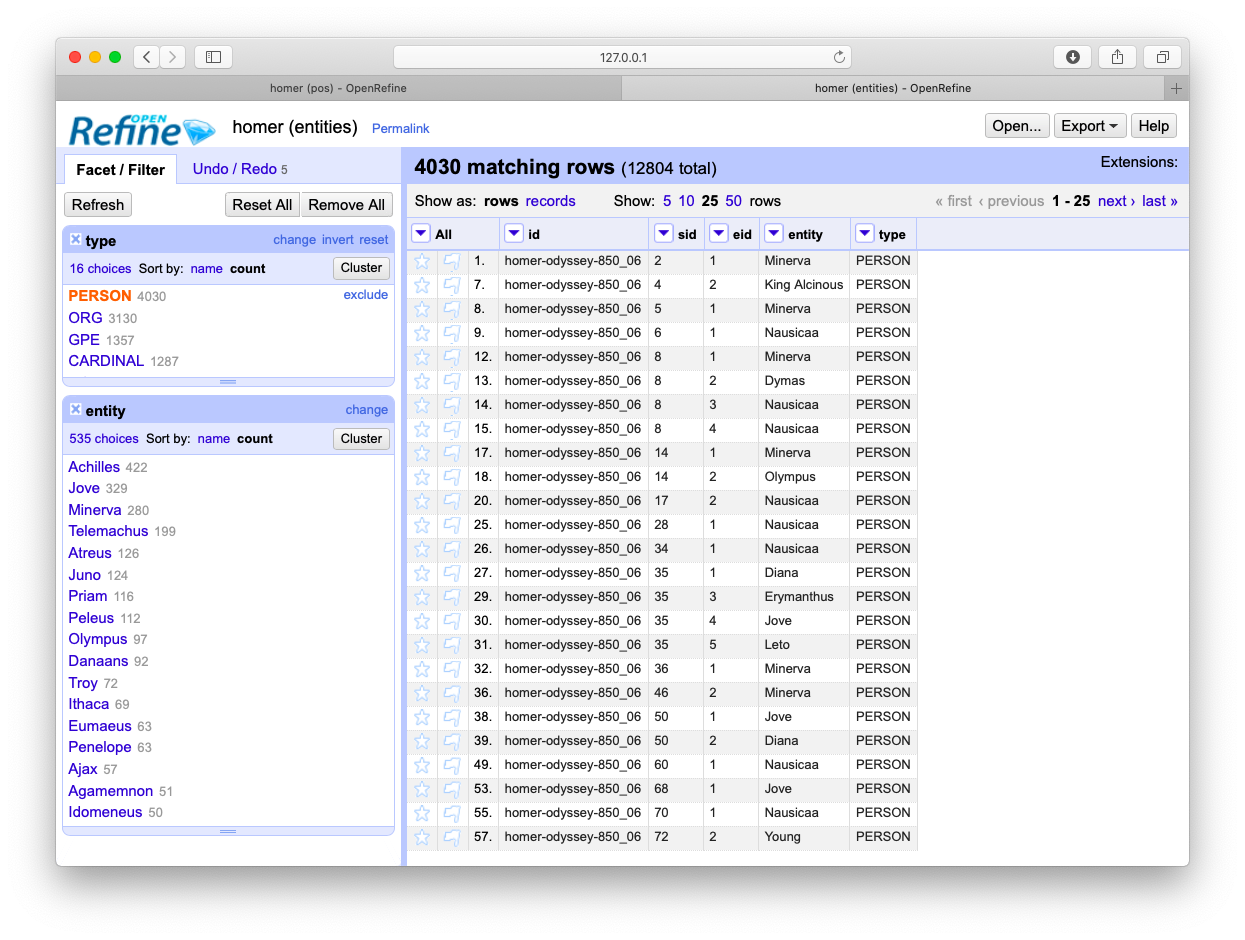
Who is mentioned in a file and how often
Like everything else, using OpenRefine requires practice. The problem to solve is not so much learning how to use OpenRefine. Instead, the problem to solve is to ask and answer interesting questions. That said, the student, researcher, or scholar will want to sort the data, search/filter the data, and compare pieces of the data to other pieces to articulate possible relationships. The following recipes endeavor to demonstrate some such tasks. The first is to simply facet (count & tabulate) on parts-of-speech files:
Faceting is a whole like like “grouping” in the world of relational databases. Faceting alphabetically sorts a list and then counts the number of times each item appears in the list. Different types of works have different parts-of-speech ratios. For example, it is not uncommon for there to be a preponderance of past-tense verbs stories. Counts & tabulations of personal pronouns as well as proper nouns give senses of genders. A more in-depth faceting against adjectives allude to sentiment.
This recipe outlines how to filter (“search”):
By combining the functionalities of faceting and filtering the student, researcher, or scholar can investigate the original content more deeply or at least in different ways. The use of OpenRefine in this way is akin to leafing through book or a back-of-the-book index. As patterns & anomalies present themselves, they can be followed up more thoroughly through the use of a concordance and literally see the patterns & anomalies in context.
This recipe answers the question, “Who is mentioned in a corpus, and how often?“:
This final recipe is a visualization:
A study carrel’s parts-of-speech (pos) and named-entities (ent) files enumerate each and every word or named-entity in each and every sentence of each and every item in the study carrel. Given a question relatively quantitative in nature and pertaining to parts-of-speech or named-entities, the pos and ent files are likely to be able to address the question. The pos and ent files are tab-delimited files, and OpenRefine is a very good tool for reading and analyzing such files. It does much more than was outlined here, but enumerating them here is beyond scope. Such is left up to the… reader.
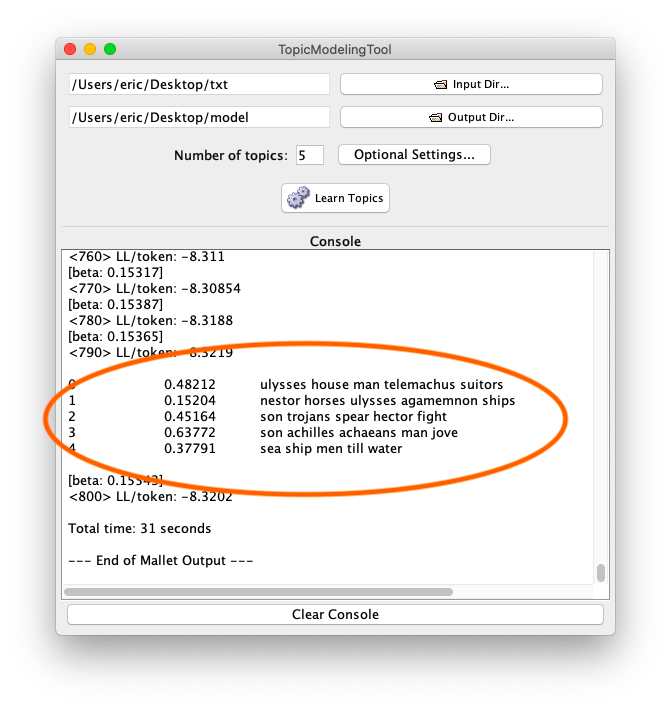
2020-02-09T21:19:33+00:00 Life of a Librarian: Topic Modeling Tool – Enumerating and visualizing latent themes http://sites.nd.edu/emorgan/2020/02/topic-modeling/Technically speaking, topic modeling is an unsupervised machine learning process used to extract latent themes from a text. Given a text and an integer, a topic modeler will count & tabulate the frequency of words and compare those frequencies with the distances between the words. The words form “clusters” when they are both frequent and near each other, and these clusters can sometimes represent themes, topics, or subjects. Topic modeling is often used to denote the “aboutness” of a text or compare themes between authors, dates, genres, demographics, other topics, or other metadata items.
Topic Modeling Tool is a GUI/desktop topic modeler based on the venerable MALLET suite of software. It can be used in a number of ways, and it is relatively easy to use it to: list five distinct themes from the Iliad and the Odyssey, compare those themes between books, and, assuming each chapter occurs chronologically, compare the themes over time.
Simple list of topics
Topics distributed across a corpus
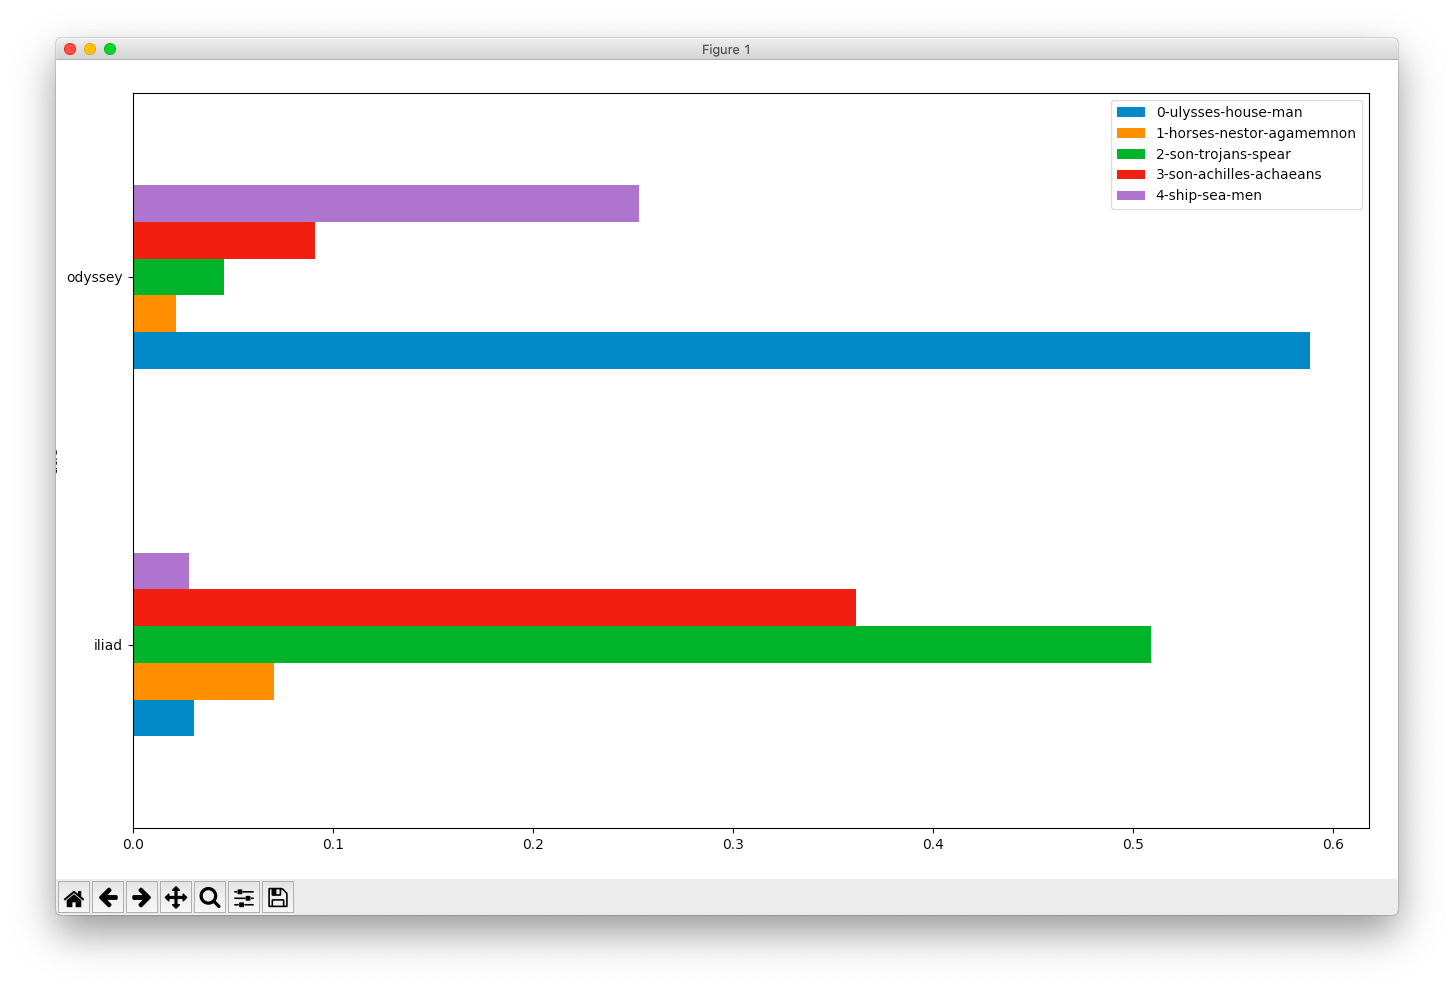
Comparing the two books of Homer
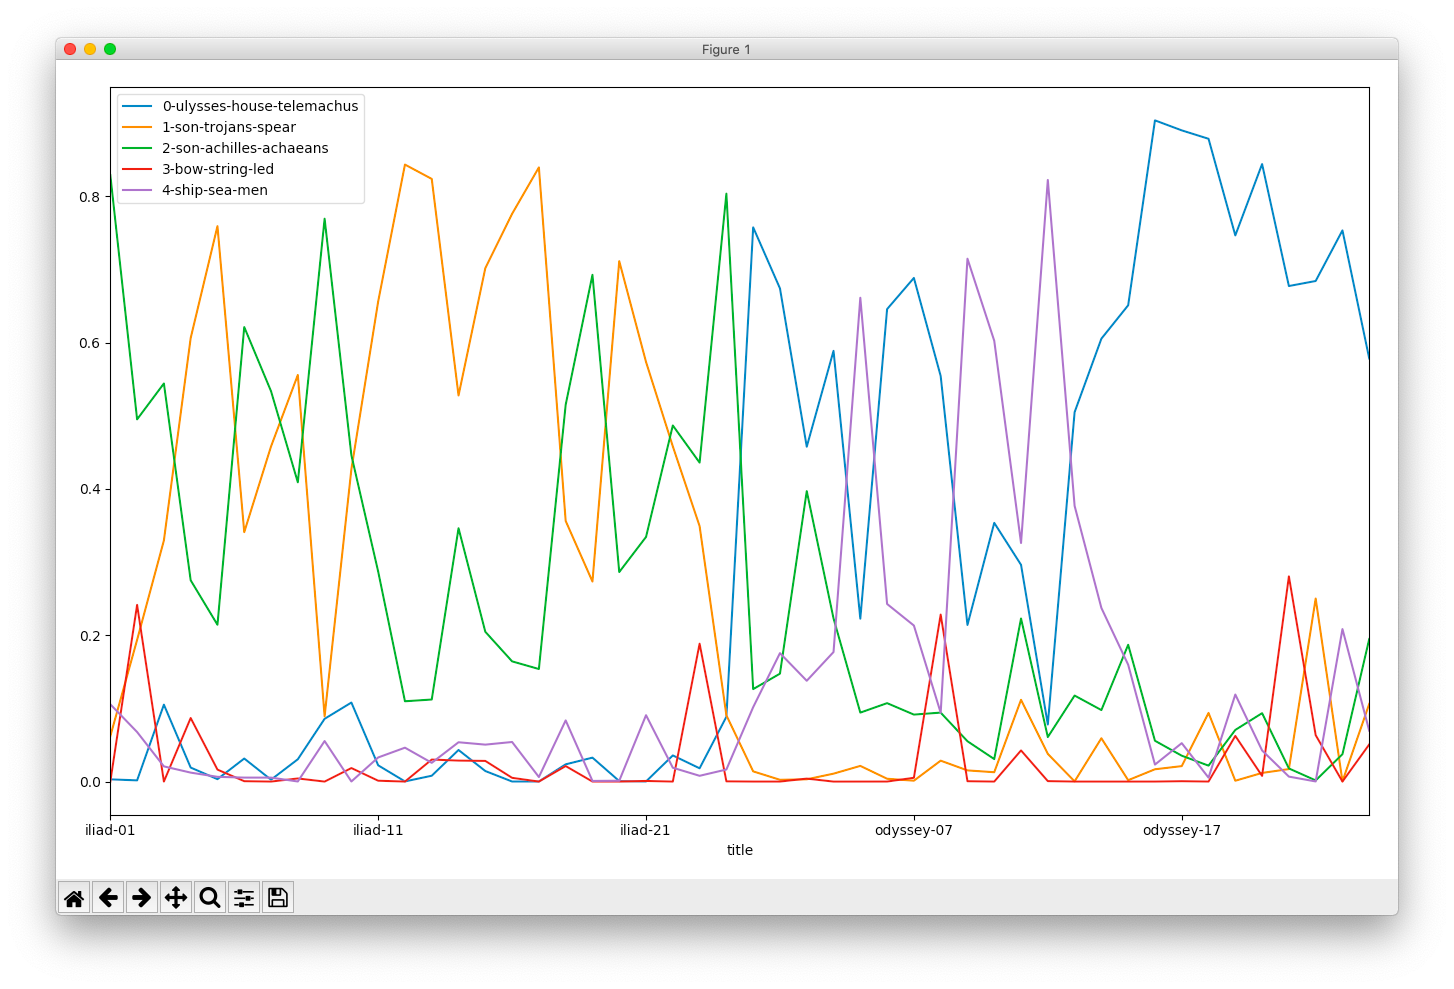
Topics compared over time
These few recipes are intended to get you up and running when it comes to Topic Modeling Tool. They are not intended to be a full-blown tutorial. This first recipe merely divides a corpus into the default number of topics and dimensions:
This recipe will make things less confusing:
There is no correct number of topics to extract with the process of topic modeling. “When considering the whole of Shakespeare’s writings, what is the number of topics it is about?” This being the case, repeat and re-repeat the previous recipe until you: 1) get tired, or 2) feel like the results are at least somewhat meaningful.
This recipe will help you make the results even cleaner by removing nonsense from the output:
Adding individual words to the stopword list can be tedious, and consequently, here is a power-user’s recipe to accomplish the same goal:
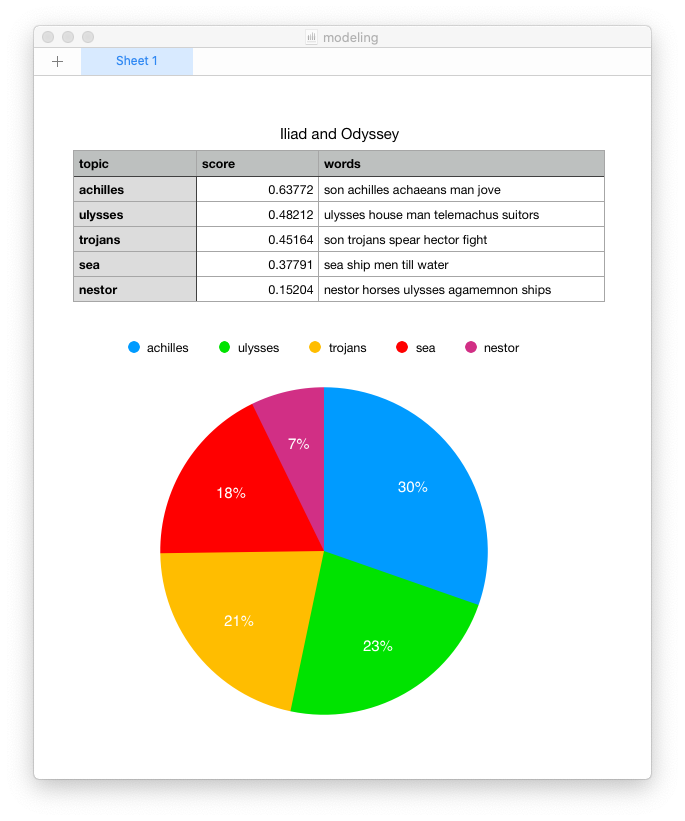
Now that you have somewhat meaningful topics, you will probably want to visualize the results, and one way to do that is to illustrate how the topics are dispersed over the whole of the corpus. Luckily, the list of topics displayed in the Tool’s console is tab-delimited, making it easy to visualize. Here’s how:
Because of a great feature in Topic Modeling Tool it is relatively easy to compare topics against metadata values such as authors, dates, formats, genres, etc. To accomplish this goal the raw numeric information output by the Tool (the actual model) needs to be supplemented with metadata, the data then needs to be pivoted, and subsequently visualized. This is a power-user’s recipe because it requires: 1) a specifically shaped comma-separated values (CSV) file, 2) Python and a few accompanying modules, and 3) the ability to work from the command line. That said, here’s a recipe to compare & contrast the two books of Homer:
python pivot.py); the result ought to an error message outlining the input pivot.py expectspivot.py again, but this time give it input; more specifically, specify “./model/output_csv/topics-metadata.csv” as the first argument (Windows users will specify .\model\output_csv\topics-metadata.csv), specify “barh” for the second argument, and “title” as the third argument; the result ought to be a horizontal bar chart illustrating the differences in topics across the Iliad and the Odyssey, and ask yourself, “To what degree are the books similar?”The following recipe is very similar to the previous recipe, but it illustrates the ebb & flow of topics throughout the whole of the two books:
pivot.py and specify “./model/output_csv/topics-metadata.csv” as the first argument (Windows users will specify .\model\output_csv\topics-metadata.csv), specify “line” for the second argument, and “title” as the third argument; the result ought to be a line chart illustrating the increase & decrease of topics from the beginning of the saga to the end, and ask yourself “What topics are discussed concurrently, and what topics are discussed when others are not?”
Topic modeling is an effective process for “reading” a corpus “from a distance”. Topic Modeling Tool makes the process easier, but the process requires practice. Next steps are for the student to play with the additional options behind the “Optional Settings…” dialog box, read the Tool’s documentation, take a look at the structure of the CSV/metadata file, and take a look under the hood at pivot.py.
Concordancing is really a process about find, and AntConc is a very useful program for this purpose. Given one or more plain text files, AntConc will enable the student, researcher, or scholar to: find all the occurrences of a word, illustrate where the word is located, navigate through document(s) where the word occurs, list word collocations, and calculate quite a number of useful statistics regarding a word. Concordancing, dating from the 13th Century, is the oldest form of text mining. Think of it as control-F (^f) on steroids. AntConc does all this and more. For example, one can load all of the Iliad and the Odyssey into AntConc. Find all the occurrences of the word ship, visualize where ship appears in each chapter, and list the most significant words associated with the word ship.

Occurrences of a word
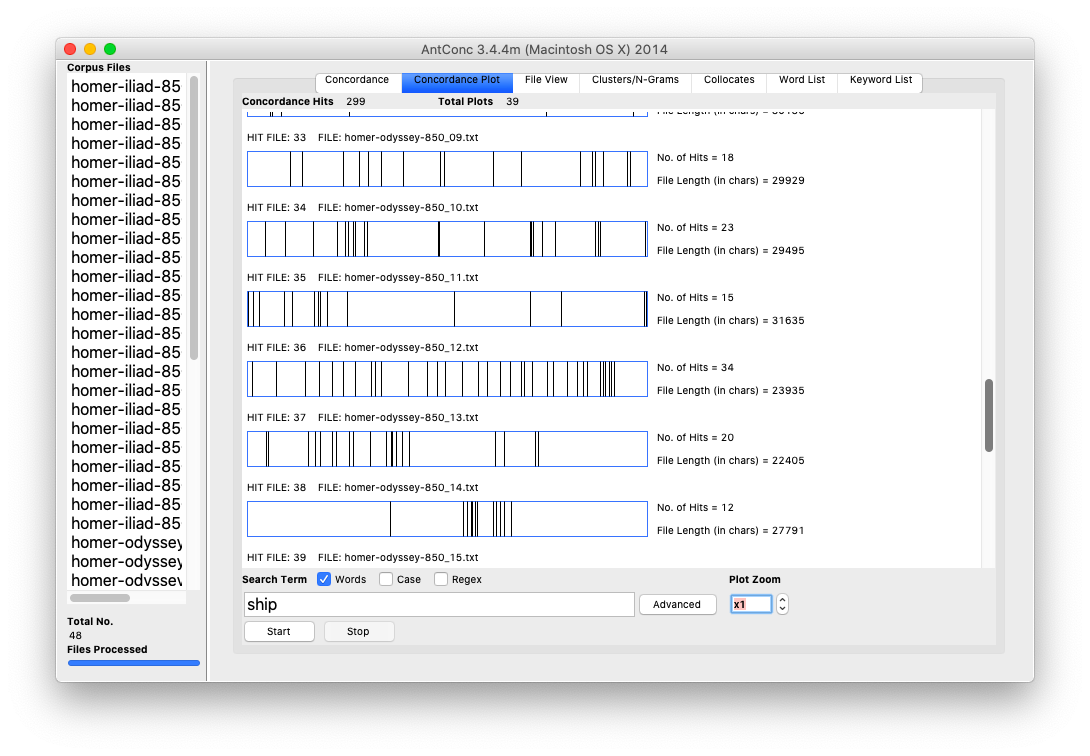
Dispersion charts
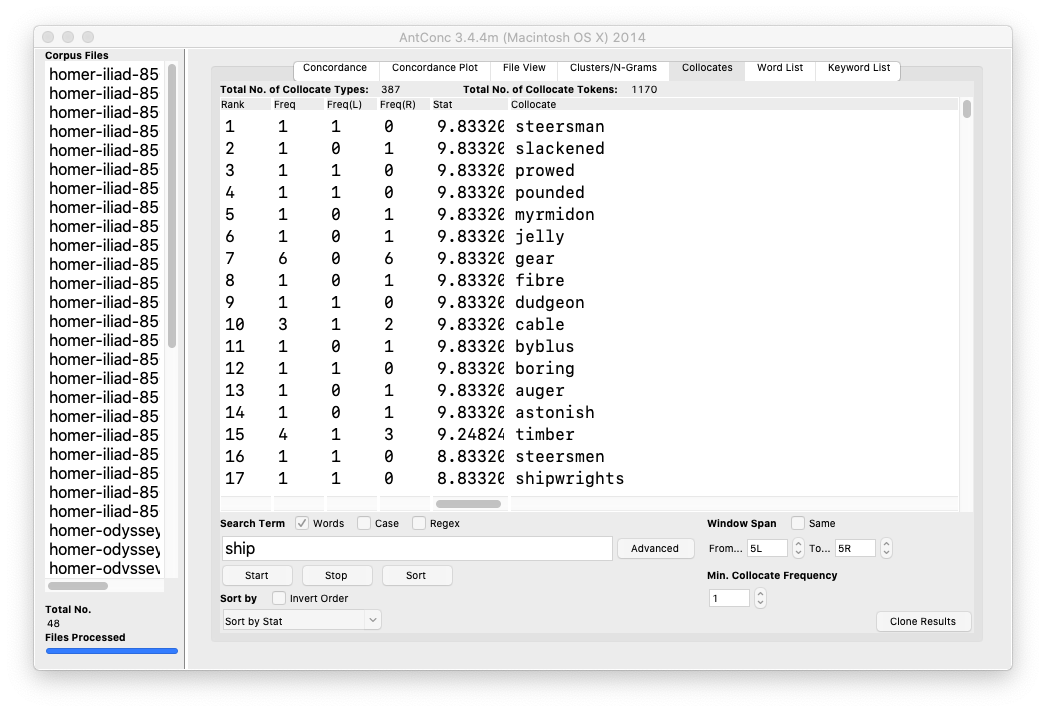
“interesting” words
This recipe simply implements search:
The result ought to be a list of phrases where the word of interest is displayed in the middle of the screen. In modern-day terms, such a list is called a “key word in context” (KWIC) index.
This recipe combines search with “control-F”:
This recipe produces a dispersion plot, an illustration of where a search term appears in a document:
The result will be a list of illustrations. Each illustration will include zero or more vertical lines denoting the location of your search term in a given file. The more lines in each illustrations, the more times the search terms appear in the document.
This recipe counts & tabulates the frequency of words:
It is quite probable the most frequent words will be “stop words” like the, a, an, etc. AntConc supports the elimination of stop words, and the Reader supplies a stop word list. Describing how to implement this functionality is too difficult to put into words. (No puns intended.) But here is an outline:
Ideas are rarely articulated through the use of individual words; ideas are usually articulated through the use of sets of words (ngrams, sentences, paragraphs, etc.). Thus, as John Rupert Firth once said, “You shall know a word by the company it keeps.” This recipe outlines how to list word co-occurrences and collocations:
Again, a word is known by the company it keeps. Use the co-occurrences and collocations features to learn how a given word (or phrase) is associated with other words.
There is much more to AntConc than outlined in the recipes outlined above. Learning more is left up to you, the student, research, and scholar.
2020-01-31T20:02:21+00:00 Life of a Librarian: The Distant Reader Workbook http://sites.nd.edu/emorgan/2020/01/workbook/I am in the process of writing a/the Distant Reader workbook, which will make its debut at a Code4Lib preconference workshop in March. Below is both the “finished” introduction and table-of-contents.
This workbook outlines sets of hands-on exercises surrounding a computer system called the Distant Reader — https://distantreader.org.
By going through the workbook, you will become familiar with the problems the Distant Reader is designed to address, how to submit content to the Reader, how to download the results (affectionately called “study carrels”), and how to interpret them. The bulk of the workbook is about the later. Interpretation can be as simple as reading a narrative report in your Web browser, as complex as doing machine learning, and everything else in-between.
You will need to bring very little to the workbook in order to get very much out. At the very least, you will need a computer with a Web browser and an Internet connection. A text editor such as Notepad++ for Windows or BBEdit for Macintosh will come in very handy, but a word processor of any type will do in a pinch. You will want some sort of spreadsheet application for reading tabular data, and Microsoft Excel or Macintosh Numbers will both work quite well. All the other applications used in the workbook are freely available for downloading and cross-platform in nature. You may need to install a Java virtual machine in order to use some of them, but Java is probably already installed on your computer.
I hope you enjoy using the Distant Reader. It helps me use and understand large volumes of text quickly and easily.
    I. What is the Distant Reader, and why should I care?
       A. The Distant Reader is a tool for reading
       B. How it works
       C. What it does
   II. Five different types of input
       A. Introduction
       B. A file
       C. A URL
       D. A list of URLs
       E. A zip file
       F. A zip file with a companion CSV file
       F. Summary
  III. Submitting "experiments" and downloading "study carrels"
   IV. An introduction to study carrels
    V. The structured data of study carrels; taking inventory through the manifest
   VI. Using combinations of desktop tools to analyze the data
       A. Introduction - The three essential types of desktop tools
       B. Text editors
       C. Spreadsheet/database applications
       D. Analysis applications
           i. Wordle and Wordle recipes
          ii. AntConc and AntConc recipes
         iii. Excel and Excel recipes
          iv. OpenRefine and OpenRefine recipes
           v. Topic Modeling Tool and Tool recipes
  VII. Using command-line tools to dig even deeper
 VIII. Summary/conclusion
   IX. About the author
As per usual these days, the “code” is available on GitHub.
2020-01-31T18:57:29+00:00 Life of a Librarian: Wordle and the Distant Reader http://sites.nd.edu/emorgan/2020/01/wordle/Visualized word frequencies, while often considered sophomoric, can be quite useful when it comes to understanding a text, especially when the frequencies are focused on things like parts-of-speech, named entities, or co-occurrences. Wordle visualizes such frequencies very well. For example, the 100 most frequent words in the Iliad and the Odyssey, the 100 most frequent nouns in the Iliad and the Odyssey, or the statistically significant words associated with the word ship from the Iliad and the Odyssey.
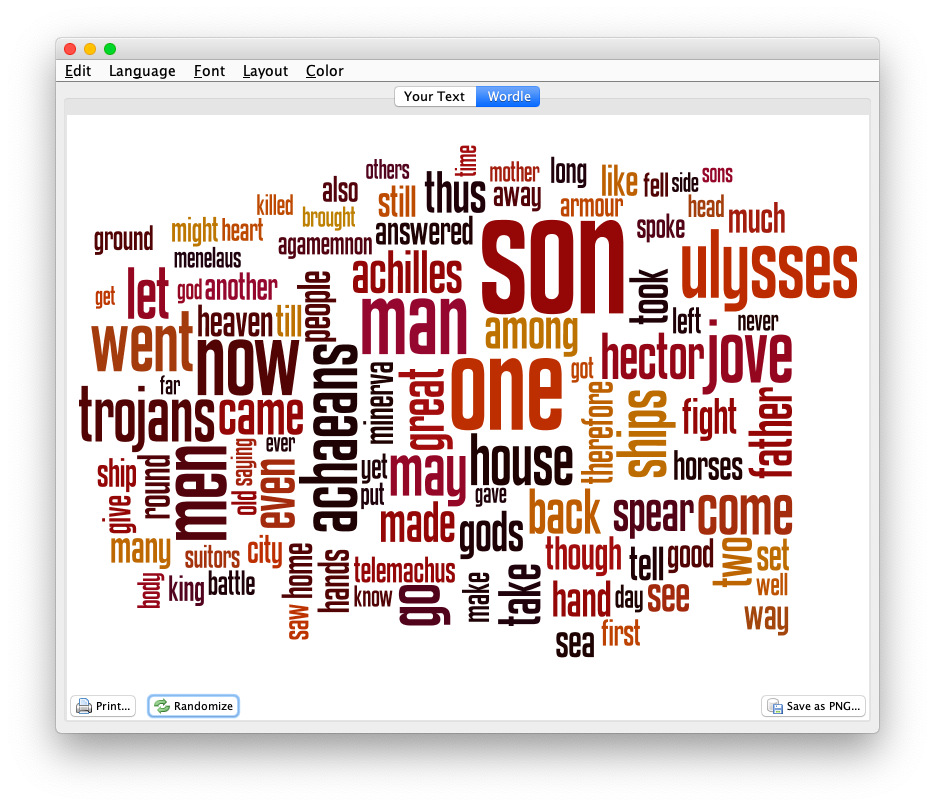
simple word frequencies
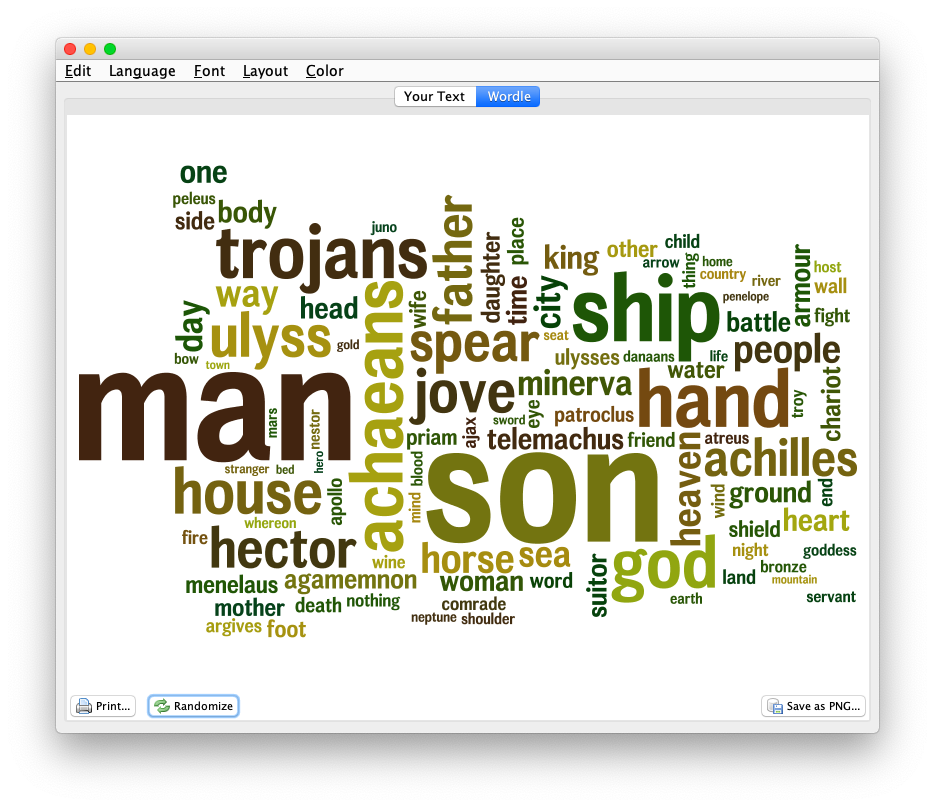
frequency of nouns
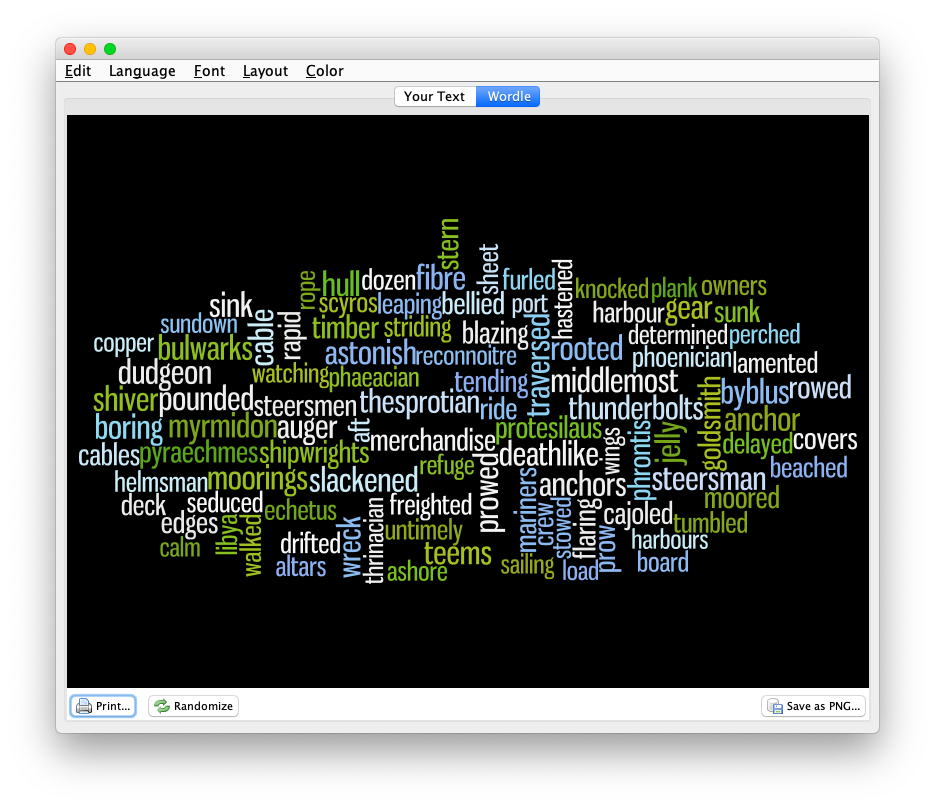
Significant words related to ship
Here is a generic Wordle recipe where Wordle will calculate the frequencies for you:
Congratulations, you have just visualized the whole of your study carrel.
Here is another recipe, a recipe where you supply the frequencies (or any other score):
Notice how you used a variety of generic applications to achieve the desired result. The word/value pairs given to Wordle do not have be frequencies. Instead they can be any number of different scores or weights. Keep your eyes open for word/value combinations. They are everywhere. Word clouds have been given a bad rap. Wordle is a very useful tool.
2020-01-29T18:13:33+00:00 Life of a Librarian: The Distant Reader and a Web-based demonstration http://sites.nd.edu/emorgan/2020/01/dr-ucla/The following is an announcement of a Web-based demonstration to the Distant Reader:
Please join us for a web-based demo and Q&A on The Distant Reader, a web-based text analysis toolset for reading and analyzing texts that removes the hurdle of acquiring computational expertise. The Distant Reader offers a ready way to onboard scholars to text analysis and its possibilities. Eric Lease Morgan (Notre Dame) will demo his tool and answer your questions. This session is suitable for digital textual scholars at any level, from beginning to expert.
- When: February 12, 2020 @ 1-2pm Pacific Standard Time
- Where: Online (https://ucla.zoom.us/j/3107947789) or at UCLA in 1041 Public Affairs Building
The Distant Reader: Reading at scale
The Distant Reader is a tool for reading. It takes an arbitrary amount of unstructured data (text) as input, and it outputs sets of structured data for analysis — reading. Given a corpus of just about any size (hundreds of books or thousands of journal articles), the Distant Reader analyzes the corpus, and outputs a myriad of reports enabling the researcher to use and understand the corpus. Designed with college students, graduate students, scientists, or humanists in mind, the Distant Reader is intended to supplement the traditional reading process.
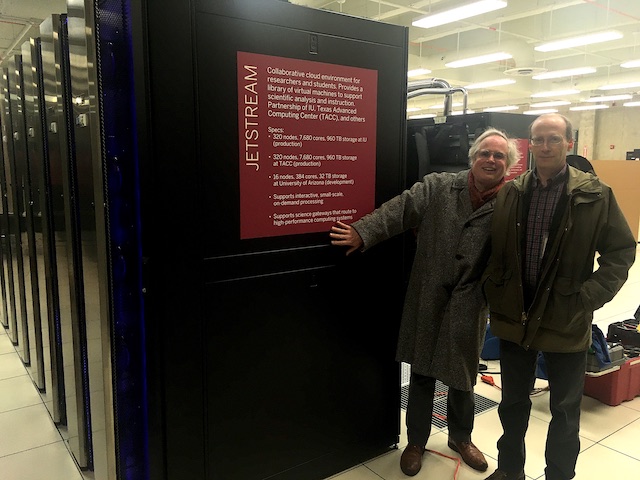
This presentation outlines the problems the Reader is intended to address as well as the way it is implemented on the Jetstream platform with the help of both software and personnel resources from XSEDE. The Distant Reader is freely available for anybody to use at https://distantreader.org.
Other Distant Reader links of possible interest include:
- “study carrels” – http://carrels.distantreader.org
- blog postings – http://sites.nd.edu/emorgan/category/distant-reader/
- Slack channel – http://bit.ly/distantreader-slack
- Twitter feed – http://twitter.com/readerdistant
- source code – https://github.com/ericleasemorgan/reader
‘Hope to see you there?
2020-01-18T00:07:40+00:00 Life of a Librarian: Distant Reader “study carrels”: A manifest http://sites.nd.edu/emorgan/2019/12/reader-manifest/The results of the Distant Reader process is the creation of a “study carrel” — a set of structured data files intended to help you to further “read” your corpus. Using a previously created study carrel as an example, this blog posting enumerates & outlines the contents of a typical carrel. A future blog posting will describe ways to use & understand the files outlined here. Therefore, the text below is merely a kind of manifest.
Wall Paper by Eric
The results of downloading and uncompressing the Distant Reader study carrel is a directory/folder containing a standard set of files and subdirectories. Each of these files and subdirectories are listed & described below:
[1] Airivata – https://airavata.apache.org
2019-12-28T00:10:07+00:00 Life of a Librarian: A Distant Reader Field Trip to Bloomington http://sites.nd.edu/emorgan/2019/12/bloomington/Yesterday I was in Bloomington (Indiana) for a Distant Reader field trip.
More specifically, I met with Marlon Pierce and Team XSEDE to talk about Distant Reader next steps. We discussed the possibility of additional grant opportunities, possible ways to exploit the Airivata/Django front-end, and Distant Reader embellishments such as:
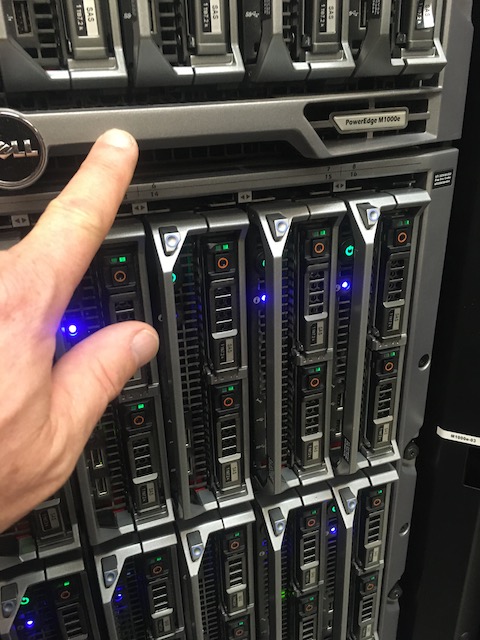
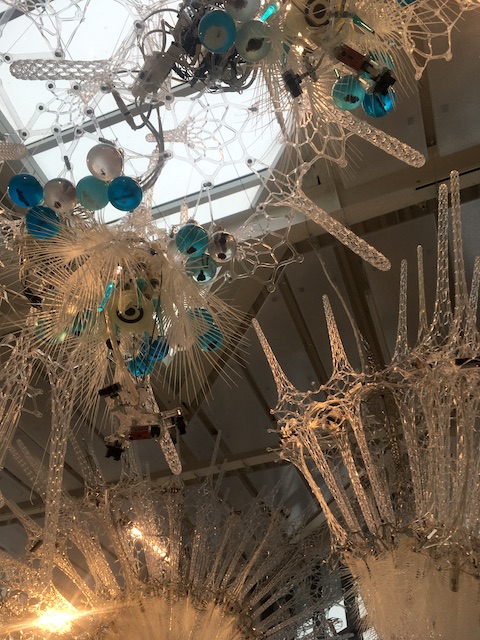
Along the way Marlon & I visited the data center where I actually laid hands on the Reader. We also visited John Walsh of the HathiTrust Research Center where I did a two-fold show & tell: 1) downloading HathiTrust plain text files as well as PDF documents using htid2books, and 2) the Distant Reader, of course. As a bonus, there was cool mobile hanging from the ceiling of Luddy Hall.
“A good time was had by all.”
The Distant Reader is a tool for reading. [1]
Wall Paper by Eric
The Distant Reader empowers one to use & understand large amounts of textual information both quickly & easily. For example, the Distant Reader can consume the entire issue of a scholarly journal, the complete works of a given author, or the content found at the other end of an arbitrarily long list of URLs. Thus, the Distant Reader is akin to a book’s table-of-contents or back-of-the-book index but at scale. It simplifies the process of identifying trends & anomalies in a corpus, and then it enables a person to further investigate those trends & anomalies.
The Distant Reader is designed to “read” everything from a single item to a corpus of thousand’s of items. It is intended for the undergraduate student who wants to read the whole of their course work in a given class, the graduate student who needs to read hundreds (thousands) of items for their thesis or dissertation, the scientist who wants to review the literature, or the humanist who wants to characterize a genre.
The Distant Reader takes five different forms of input:
Once the input is provided, the Distant Reader creates a cache — a collection of all the desired content. This is done via the input or by crawling the ‘Net. Once the cache is collected, each & every document is transformed into plain text, and along the way basic bibliographic information is extracted. The next step is analysis against the plain text. This includes rudimentary counts & tabulations of ngrams, the computation of readability scores & keywords, basic topic modeling, parts-of-speech & named entity extraction, summarization, and the creation of a semantic index. All of these analyses are manifested as tab-delimited files and distilled into a single relational database file. After the analysis is complete, two reports are generated: 1) a simple plain text file which is very tabular, and 2) a set of HTML files which are more narrative and graphical. Finally, everything that has been accumulated & generated is compressed into a single zip file for downloading. This zip file is affectionately called a “study carrel“. It is completely self-contained and includes all of the data necessary for more in-depth analysis.
The Distant Reader supplements the traditional reading process. It does this in the way of traditional reading apparatus (tables of content, back-of-book indexes, page numbers, etc), but it does it more specifically and at scale.
Put another way, the Distant Reader can answer a myriad of questions about individual items or the corpus as a whole. Such questions are not readily apparent through traditional reading. Examples include but are not limited to:
People who use the Distant Reader look at the reports it generates, and they often say, “That’s interesting!” This is because it highlights characteristics of the corpus which are not readily apparent. If you were asked what a particular corpus was about or what are the names of people mentioned in the corpus, then you might answer with a couple of sentences or a few names, but with the Distant Reader you would be able to be more thorough with your answer.
The questions outlined above are not necessarily apropos to every student, researcher, or scholar, but the answers to many of these questions will lead to other, more specific questions. Many of those questions can be answered directly or indirectly through further analysis of the structured data provided in the study carrel. For example, each & every feature of each & every sentence of each & every item in the corpus has been saved in a relational database file. By querying the database, the student can extract every sentence with a given word or matching a given grammer to answer a question such as “How was the king described before & after the civil war?” or “How did this paper’s influence change over time?”
A lot of natural language processing requires pre-processing, and the Distant Reader does this work automatically. For example, collections need to be created, and they need to be transformed into plain text. The text will then be evaluated in terms of parts-of-speech and named-entities. Analysis is then done on the results. This analysis may be as simple as the use of concordance or as complex as the application of machine learning. The Distant Reader “primes the pump” for this sort of work because all the raw data is already in the study carrel. The Distant Reader is not intended to be used alone. It is intended to be used in conjunction with other tools, everything from a plain text editor, to a spreadsheet, to database, to topic modelers, to classifiers, to visualization tools.
I don’t know about you, but now-a-days I can find plenty of scholarly & authoritative content. My problem is not one of discovery but instead one of comprehension. How do I make sense of all the content I find? The Distant Reader is intended to address this question by making observations against a corpus and providing tools for interpreting the results.
[1] Distant Reader – https://distantreader.org
2019-11-09T02:25:04+00:00 Life of a Librarian: Project Gutenberg and the Distant Reader http://sites.nd.edu/emorgan/2019/11/pg-dr/The venerable Project Gutenberg is perfect fodder for the Distant Reader, and this essay outlines how & why. (tl;dnr: Search my mirror of Project Gutenberg, save the result as a list of URLs, and feed them to the Distant Reader.)
Wall Paper by Eric
To date, Project Gutenberg is a corpus of more than 60,000 freely available transcribed ebooks. The texts are predominantly in English, but many languages are represented. Many academics look down on Project Gutenberg, probably because it is not as scholarly as they desire, or maybe because the provenance of the materials is in dispute. Despite these things, Project Gutenberg is a wonderful resource, especially for high school students, college students, or life-long learners. Moreover, its transcribed nature eliminates any problems of optical character recognition, such as one encounters with the HathiTrust. The content of Project Gutenberg is all but perfectly formatted for distant reading.
Unfortunately, the interface to Project Gutenberg is less than desirable; the index to Project Gutenberg is limited to author, title, and “category” values. The interface does not support free text searching, and there is limited support for fielded searching and Boolean logic. Similarly, the search results are not very interactive nor faceted. Nor is there any application programmer interface to the index. With so much “clean” data, so much more could be implemented. In order to demonstrate the power of distant reading, I endeavored to create a mirror of Project Gutenberg while enhancing the user interface.
To create a mirror of Project Gutenberg, I first downloaded a set of RDF files describing the collection. [2] I then wrote a suite of software which parses the RDF, updates a database of desired content, loops through the database, caches the content locally, indexes it, and provides a search interface to the index. [3, 4] The resulting interface is ill-documented but 100% functional. It supports free text searching, phrase searching, fielded searching (author, title, subject, classification code, language) and Boolean logic (using AND, OR, or NOT). Search results are faceted enabling the reader to refine their query sans a complicated query syntax. Because the cached content includes only English language materials, the index is only 33,000 items in size.
The Distant Reader is a tool for reading. It takes an arbitrary amount of unstructured data (text) as input, and it outputs sets of structured data for analysis — reading. Given a corpus of any size, the Distant Reader will analyze the corpus, and it will output a myriad of reports enabling you to use & understand the corpus. The Distant Reader is intended to supplement the traditional reading process. Project Gutenberg and the Distant Reader can be used hand-in-hand.
As described in a previous posting, the Distant Reader can take five different types of input. [5] One of those inputs is a file where each line in the file is a URL. My locally implemented mirror of Project Gutenberg enables the reader to search & browse in a manner similar to the canonical version of Project Gutenberg, but with two exceptions. First & foremost, once a search has been gone against my mirror, one of the resulting links is “only local URLs”. For example, below is an illustration of the query “love AND honor AND truth AND justice AND beauty”, and the “only local URLs” link is highlighted:
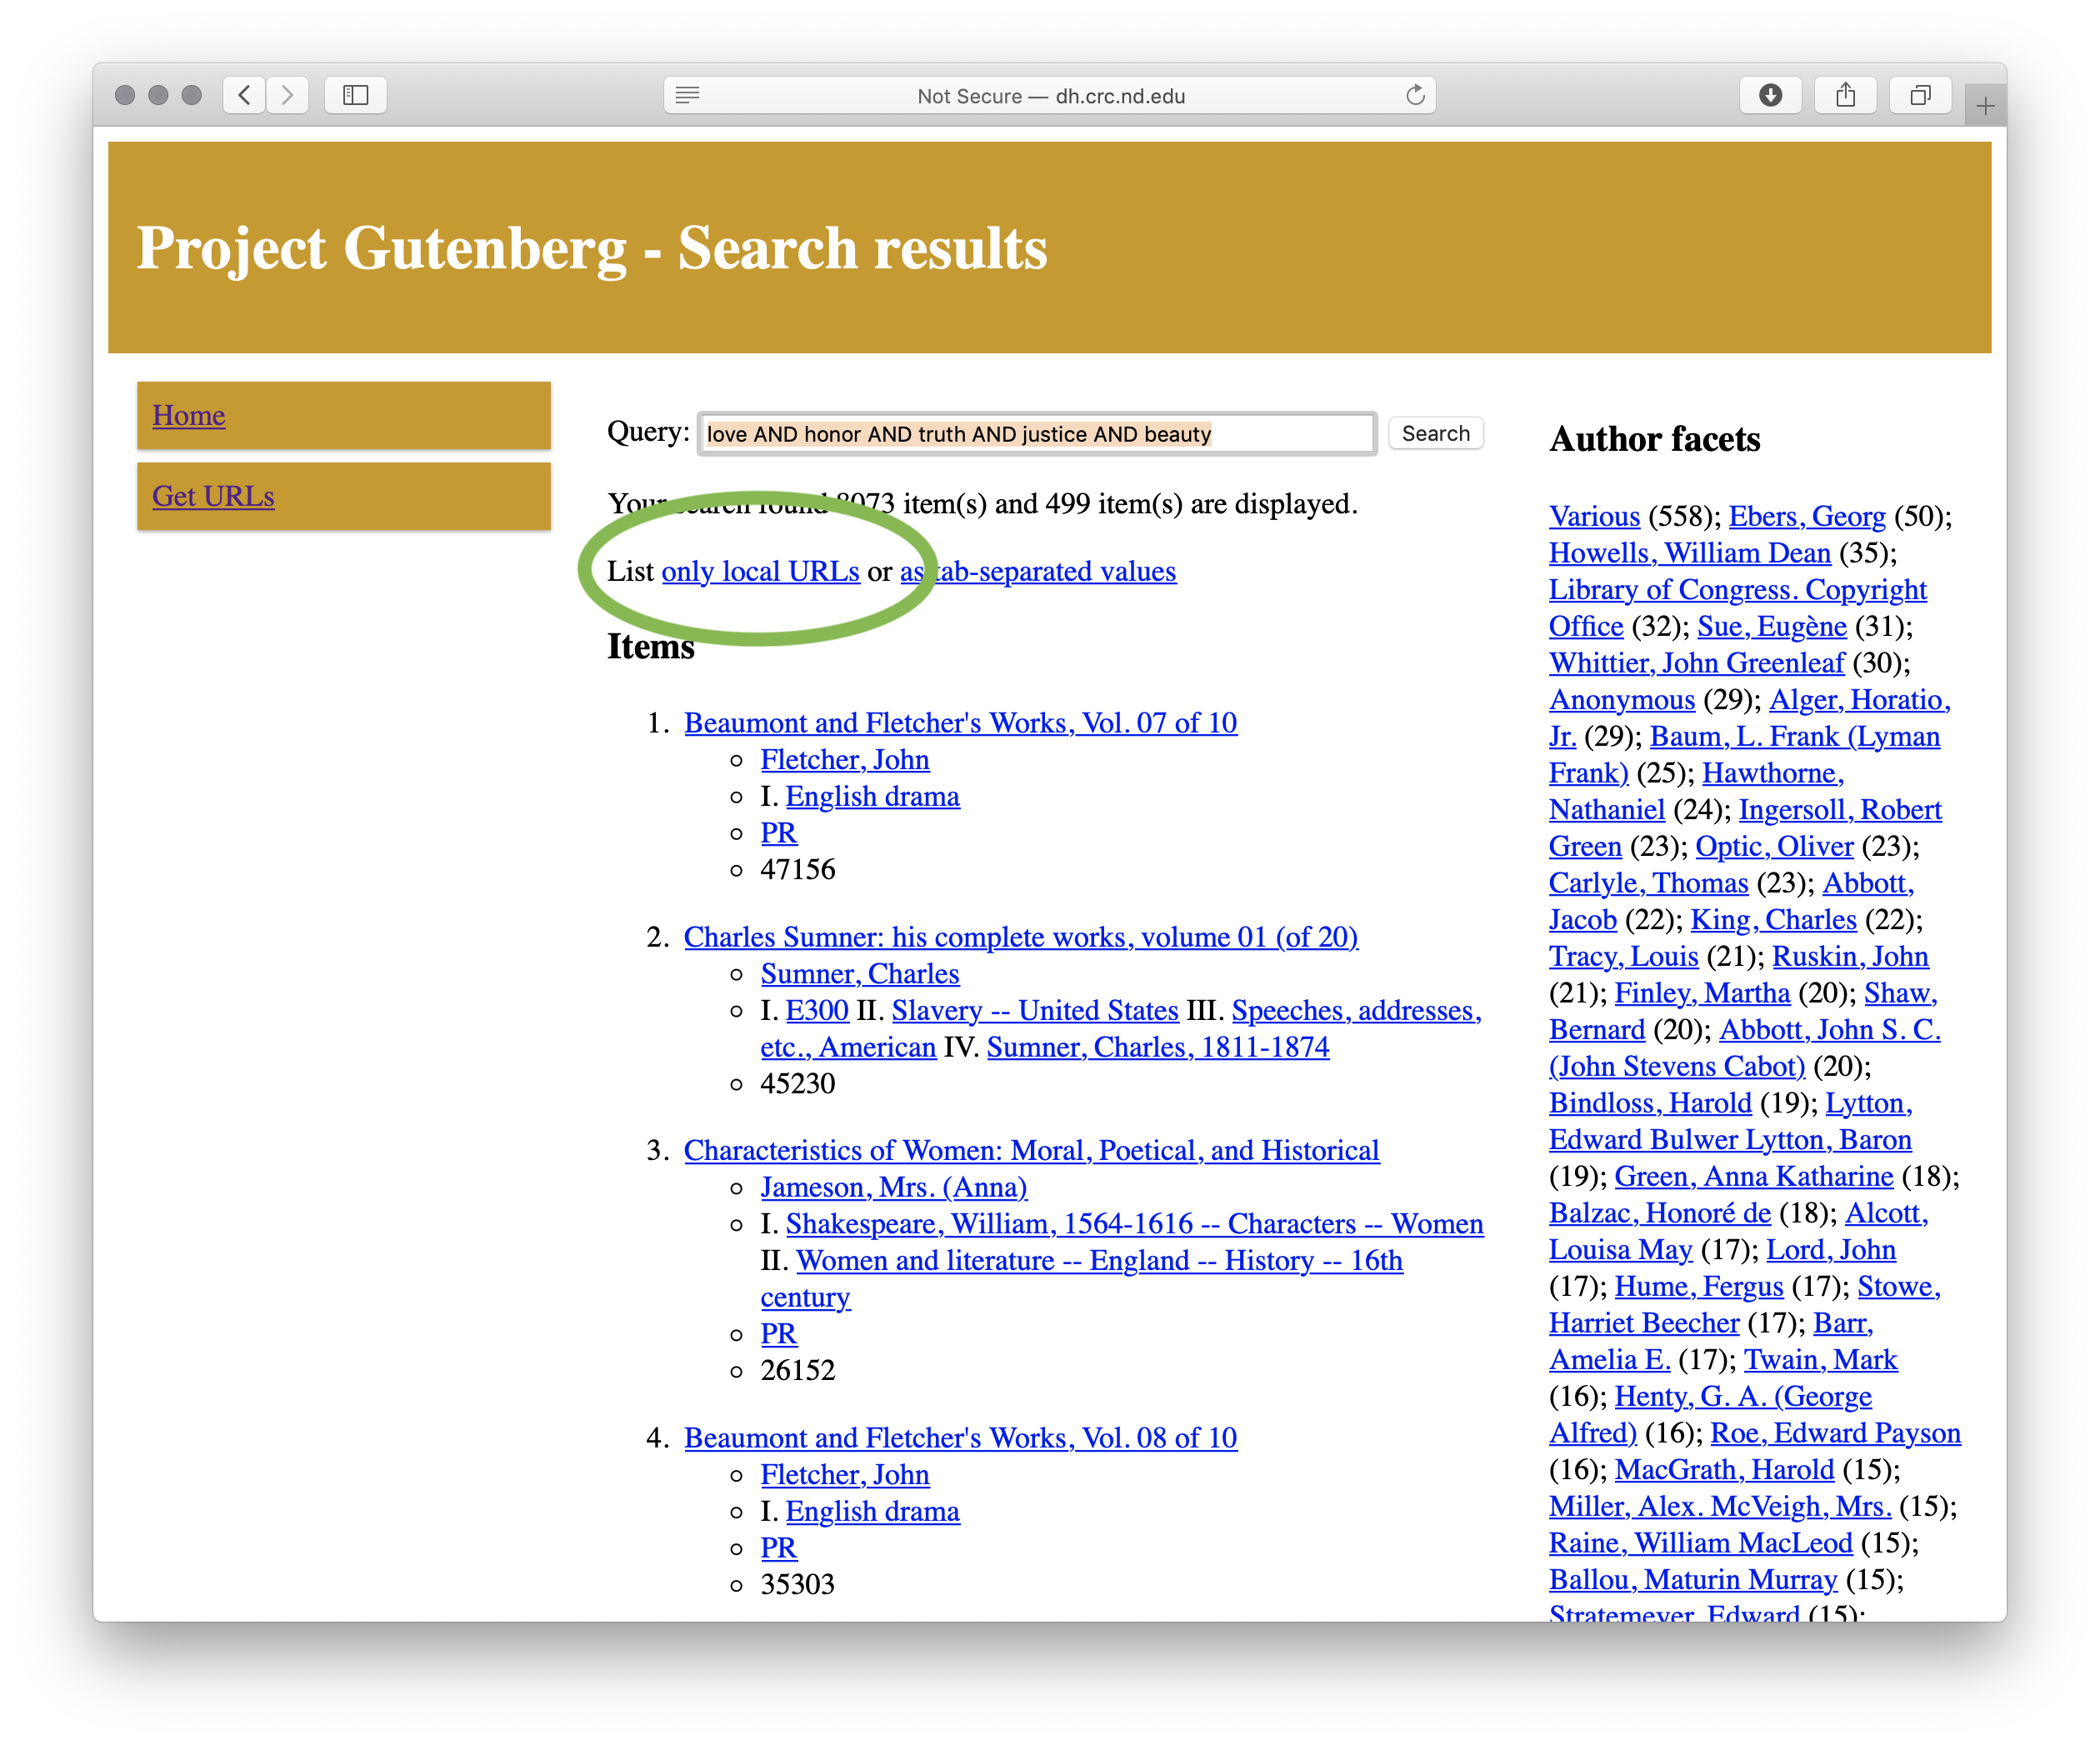
Search result
By selecting the “only local URLs”, a list of… URLs is returned, like this:
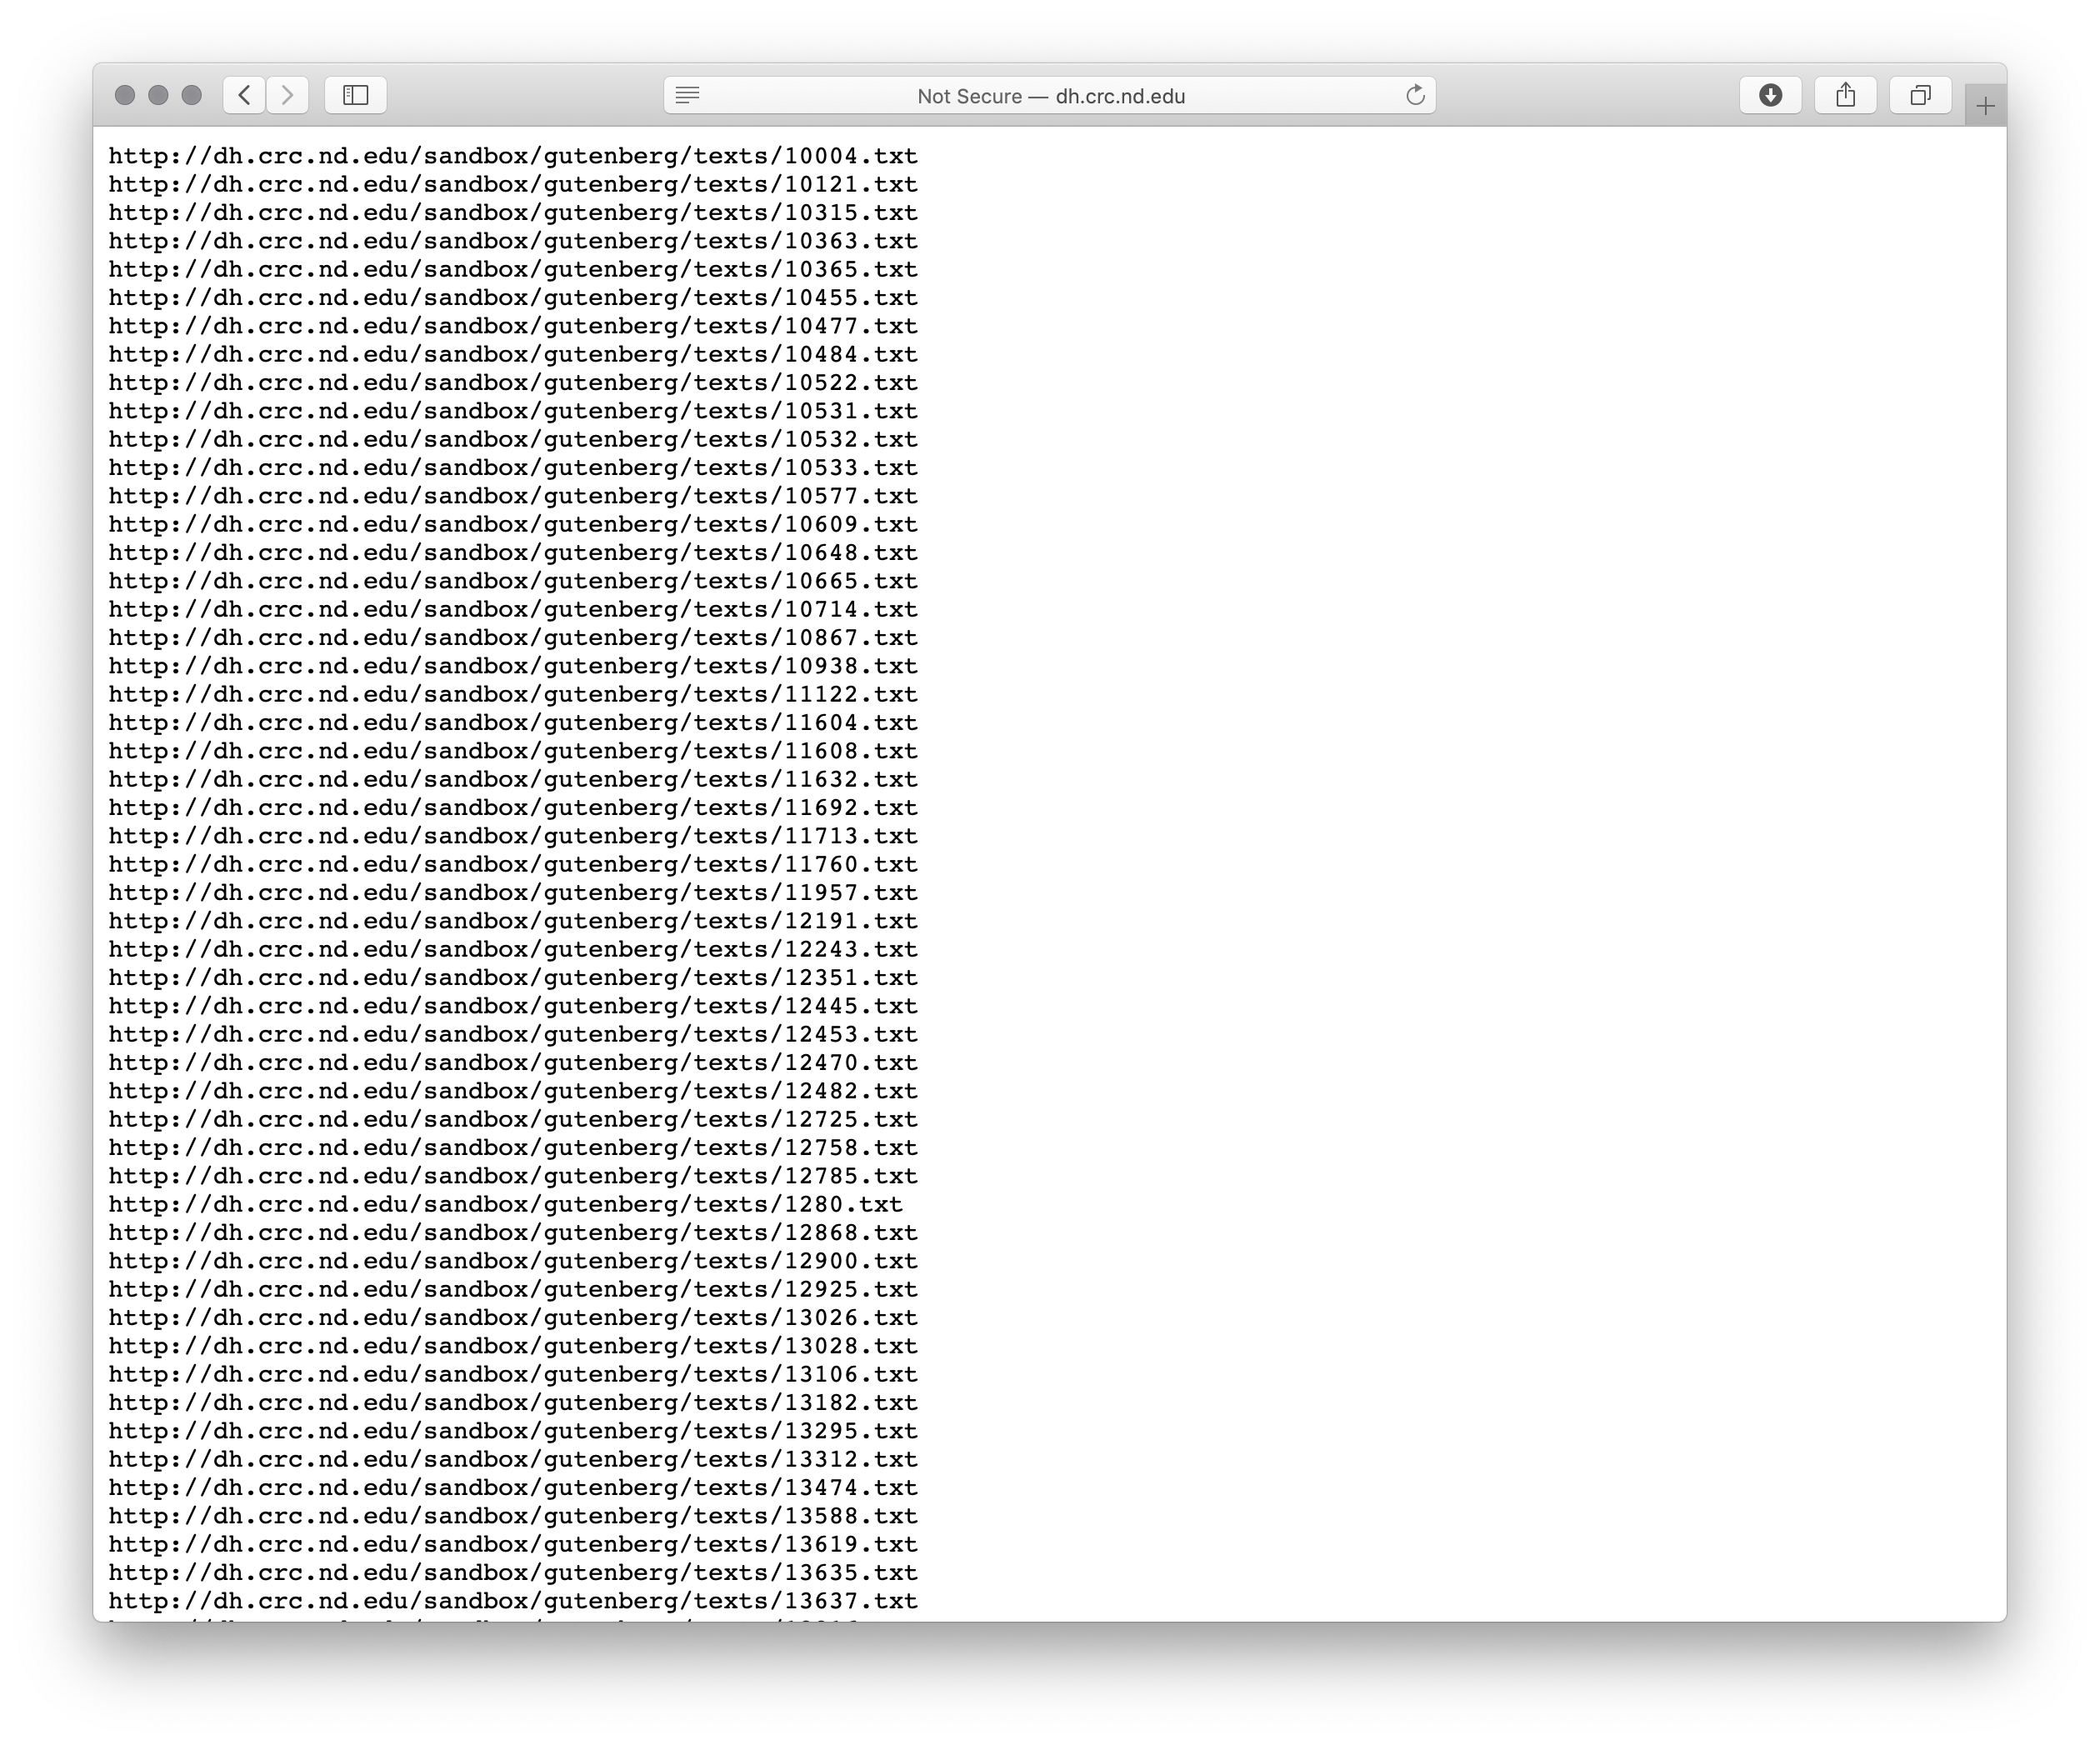
URLs
This list of URLs can then be saved as file, and any number of things can be done with the file. For example, there are Google Chrome extensions for the purposes of mass downloading. The file of URLs can be fed to command-line utilities (ie. curl or wget) also for the purposes of mass downloading. In fact, assuming the file of URLs is named love.txt, the following command will download the files in parallel and really fast:
cat love.txt | parallel wget
This same file of URLs can be used as input against the Distant Reader, and the result will be a “study carrel” where the whole corpus could be analyzed — read. For example, the Reader will extract all the nouns, verbs, and adjectives from the corpus. Thus you will be able to answer what and how questions. It will pull out named entities and enable you to answer who and where questions. The Reader will extract keywords and themes from the corpus, thus outlining the aboutness of your corpus. From the results of the Reader you will be set up for concordancing and machine learning (such as topic modeling or classification) thus enabling you to search for more narrow topics or “find more like this one”. The search for love, etc returned more than 8000 items. Just less than 500 of them were returned in the search result, and the Reader empowers you to read all 500 of them at one go.
Project Gutenberg is very useful resource because the content is: 1) free, and 2) transcribed. Mirroring Project Gutenberg is not difficult, and by doing so an interface to it can be enhanced. Project Gutenberg items are perfect items for reading & analysis by the Distant Reader. Search Project Gutenberg, save the results as a file, feed the file to the Reader and… read the results at scale.
† All puns are intended.
[1] Michael Hart in Roanoke (Indiana) – video: https://youtu.be/eeoBbSN9Esg; blog posting: http://infomotions.com/blog/2010/03/michael-hart-in-roanoke-indiana/
[2] The various Project Gutenberg feeds, including the RDF is located at https://www.gutenberg.org/wiki/Gutenberg:Feeds
[3] The suite of software to cache and index Project Gutenberg is available on GitHub at https://github.com/ericleasemorgan/gutenberg-index
[4] My full text index to the English language texts in Project Gutenberg is available at http://dh.crc.nd.edu/sandbox/gutenberg/cgi-bin/search.cgi
[5] The Distant Reader and its five different types of input – http://sites.nd.edu/emorgan/2019/10/dr-inputs/
2019-11-06T01:56:30+00:00 Life of a Librarian: OJS Toolbox http://sites.nd.edu/emorgan/2019/10/ojs-toolbox/Given a Open Journal System (OJS) root URL and an authorization token, cache all JSON files associated with the given OJS title, and optionally output rudimentary bibliographics in the form of a tab-separated value (TSV) stream. [0]

Wall Paper by Eric
The Toolbox is written in Bash. To cache the metadata, you will need to have additional software as part of your file system: curl and jq. [3, 4] Curl is used to interact with the API. Jq is used to read & parse the resulting JSON streams. When & if you want to transform the cached JSON files into rudimentary bibliographics, then you will also need to install GNU Parallel, a tool which makes parallel processing trivial. [5]
Besides the software, you will need three pieces of information. The first is the root URL of the OJS system/title you wish to use. This value will probably look something like this –> https://example.com/index.php/foo Ask the OJS systems administrator regarding the details. The second piece of information is an authorization token. If an “api secret” has been created by the local OJS systems administrator, then each person with an OJS account ought to have been granted a token. Again, ask the OJS systems administrator for details. The third piece of information is the name of a directory where your metadata will be cached. For the sake of an example, assume the necessary values are:
Once you have gotten this far, you can cache the totality of the issue metadata:
$ ./bin/harvest.sh https://example.com/index.php/foo xyzzy bar
More specifically, `harvest.sh` will create a directory called bar. It will then determine how many issues exist in the title foo. It will then harvest sets of issue data, parse each set into individual issue files, and save the result as JSON files in the bar directory. You now have a “database” containing all the bibliographic information of a given title
For my purposes, I need a TSV file with four columns: 1) author, 2) title, 3) date, and 4) url. Such is the purpose of `issues2tsv.sh` and `issue2tsv.sh`. The first script, `issues2tsv.sh`, takes a directory as input. It then outputs a simple header, finds all the JSON files in the given directory, and passes them along (in parallel) to `issue2tsv.sh` which does the actual work. Thus, to create my TSV file, I submit a command like this:
$ ./bin/issues2tsv.sh bar > ./bar.tsv
The resulting file (bar.tsv) looks something like this:
| author | title | date | url |
|---|---|---|---|
| Kilgour | The Catalog | 1972-09-01 | https://example.com/index.php/foo/article/download/5738/5119 |
| McGee | Two Designs | 1972-09-01 | https://example.com/index.php/foo/article/download/5739/5120 |
| Saracevic | Book Reviews | 1972-09-01 | https://example.com/index.php/foo/article/download/5740/5121 |
Give such a file, I can easily download the content of a given article, extract any of its plain text, perform various natural language processing tasks against it, text mine the whole, full text index the whole, apply various bits of machine learning against the whole, and in general, “read” the totality of the journal. See The Distant Reader for details. [6]
[0] OJS Toolbox – https://github.com/ericleasemorgan/ojs-toolbox
[1] OJS – https://pkp.sfu.ca/ojs/
[2] OJS API – https://docs.pkp.sfu.ca/dev/api/ojs/3.1
[3] curl – https://curl.haxx.se
[4] jq – https://stedolan.github.io/jq/
[5] GNU Parallel – https://www.gnu.org/software/parallel/
[6] Distant Reader – https://distantreader.org
The Distant Reader can take five different types of input, and this blog posting describes what they are.
Wall Paper by Eric
At the present time, the Reader can accept five different types of input, and they include:
Each of these different types of input are elaborated upon below.
The simplest form of input is a single file from your computer. This can be just about file available to you, but to make sense, the file needs to contain textual data. Thus, the file can be a Word document, a PDF file, an Excel spreadsheet, an HTML file, a plain text file, etc. A file in the form of an image will not work because it contains zero text. Also, not all PDF files are created equal. Some PDF files are only facsimiles of their originals. Such PDF files are merely sets of images concatenated together. In order for PDF files to be used as input, the PDF files need to have been “born digitally” or they need to have had optical character recognition previously applied against them. Most PDF files are born digitally nor do they suffer from being facsimiles.
A good set of use-cases for single file input is the whole of a book, a long report, or maybe a journal article. Submitting a single file to the Distant Reader is quick & easy, but the Reader is designed for analyzing larger rather than small corpora. Thus, supplying a single journal article to the Reader doesn’t make much sense; the use of the traditional reading process probably makes more sense for a single journal article.
The Distant Reader can take a single URL as input. Given a URL, the Reader will turn into a rudimentary Internet spider and build a corpus. More specifically, given a URL, the Reader will:
In short, given a URL, the Reader will cache the URL’s content, crawl the URL one level deep, cache the result, and stop caching.
Like the single file approach, submitting a URL to the Distant Reader is quick & easy, but there are a number of caveats. First of all, the Reader does not come with very many permissions, and just because you are authorized to read the content at the other end of a URL does not mean the Reader has the same authorization. A lot of content on the Web resides behind paywalls and firewalls. The Reader can only cache 100% freely accessible content.
“Landing pages” and “splash pages” represent additional caveats. Many of the URLs passed around the ‘Net do not point to the content itself, but instead they point to ill-structured pages describing the content — metadata pages. Such pages may include things like authors, titles, and dates, but these things are not presented in a consistent nor computer-readable fashion; they are laid out with aesthetics or graphic design in mind. These pages do contain pointers to the content you want to read, but the content may be two or three more clicks away. Be wary of URLs pointing to landing pages or splash pages.
Another caveat to this approach is the existence of extraneous input due to navigation. Many Web pages include links for navigating around the site. They also include links to things like “contact us” and “about this site”. Again, the Reader is sort of stupid. If found, the Reader will crawl such links and include their content in the resulting corpus.
Despite these drawbacks there are number of excellent use-cases for single URL input. One of the best is Wikipedia articles. Feed the Reader a URL pointing to a Wikipedia article. The Reader will cache the article itself, and then extract all the URLs the article uses as citations. The Reader will then cache the content of the citations, and then stop caching.
Similarly, a URL pointing to an open access journal article will function just like the Wikipedia article, and this will be even more fruitful if the citations are in the form of freely accessible URLs. Better yet, consider pointing the Reader to the root of an open access journal issue. If the site is not overly full of navigation links, and if the URLs to the content itself are not buried, then the whole of the issue will be harvested and analyzed.
Another good use-case is the home page of some sort of institution or organization. Want to know about Apple Computer, the White House, a conference, or a particular department of a university? Feed the root URL of any of these things to the Reader, and you will learn something. At the very least, you will learn how the organization prioritizes its public face. If things are more transparent than not, then you might be able to glean the names and addresses of the people in the organization, the public policies of the organization, or the breadth & depth of the organization.
Yet another excellent use-case includes blogs. Blogs often contain content at their root. Navigations links abound, but more often than not the navigation links point to more content. If the blog is well-designed, then the Reader may be able to create a corpus from the whole thing, and you can “read” it in one go.
The third type of input is a list of URLs. The list is expected to be manifested as a plain text file, and each line in the file is a URL. Use whatever application you desire to build the list, but save the result as a .txt file, and you will probably have a plain text file.‡
Caveats? Like the single URL approach, the list of URLs must point to freely available content, and pointing to landing pages or splash pages is probably to be avoided. Unlike the single URL approach, the URLs in the list will not be used as starting points for Web crawling. Thus, if the list contains ten items, then ten items will be cached for analysis.
Another caveat is the actual process of creating the list; I have learned that is actually quite difficult to create lists of URLs. Copying & pasting gets old quickly. Navigating a site and right-clicking on URLs is tedious. While search engines & indexes often provide some sort of output in list format, the lists are poorly structured and not readily amenable to URL extraction. On the other hand, there are more than a few URL extraction tools. I use a Google Chrome extension called Link Grabber. [1] Install Link Grabber. Use Chrome to visit a site. Click the Link Grabber button, and all the links in the document will be revealed. Copy the links and paste them into a document. Repeat until you get tired. Sort and peruse the list of links. Remove the ones you don’t want. Save the result as a plain text file.‡ Feed the result to the Reader.
Despite these caveats, the list of URLs approach is enormously scalable; the list of URLs approach is the most scalable input option. Given a list of five or six items, the Reader will do quite well, but the Reader will operate just as well if the list contains dozens, hundreds, or even thousands of URLs. Imagine reading the complete works of your favorite author or the complete run of an electronic journal. Such is more than possible with the Distant Reader.‡
The Distant Reader can take a zip file as input. Create a folder/directory on your computer. Copy just about any file into the folder/directory. Compress the file into a .zip file. Submit the result to the Reader.
Like the other approaches, there are a few caveats. First of all, the Reader is not able to accept .zip files whose size is greater than 64 megabytes. While we do it all the time, the World Wide Web was not really designed to push around files of any great size, and 64 megabytes is/was considered plenty. Besides, you will be surprised how many files can fit in a 64 megabyte file.
Second, the computer gods never intended file names to contain things other than simple Romanesque letters and a few rudimentary characters. Now-a-days our file names contain spaces, quote marks, apostrophes, question marks, back slashes, forward slashes, colons, commas, etc. Moreover, file names might be 64 characters long or longer! While every effort as been made to accomodate file names with such characters, your milage may vary. Instead, consider using file names which are shorter, simpler, and have some sort of structure. An example might be first word of author’s last name, first meaningful word of title, year (optional), and extension. Herman Melville’s Moby Dick might thus be named melville-moby.txt. In the end the Reader will be less confused, and you will be more able to find things on your computer.
There are a few advantages to the zip file approach. First, you can circumvent authorization restrictions; you can put licensed content into your zip files and it will be analyzed just like any other content. Second, the zip file approach affords you the opportunity to pre-process your data. For example, suppose you have downloaded a set of PDF files, and each page includes some sort of header or footer. You could transform each of these PDF files into plain text, use some sort of find/replace function to remove the headers & footers. Save the result, zip it up, and submit it to the Reader. The resulting analysis will be more accurate.
There are many use-cases for the zip file approach. Masters and Ph.D students are expected to read large amounts of material. Save all those things into a folder, zip them up, and feed them to the Reader. You have been given a set of slide decks from a conference. Zip them up and feed them to the Reader. A student is expected to read many different things for History 101. Download them all, put them in a folder, zip them up, and submit them to the Distant Reader. You have written many things but they are not on the Web. Copy them to a folder, zip them up, and “read” them with the… Reader.
The final form of input is a zip file with a companion comma-separated value (CSV) file — a metadata file.
As the size of your corpus increases, so does the need for context. This context can often be manifested as metadata (authors, titles, dates, subject, genre, formats, etc.). For example, you might want to compare & contrast who wrote what. You will probably want to observe themes over space & time. You might want to see how things differ between different types of documents. To do this sort of analysis you will need to know metadata regarding your corpus.
As outlined above, the Distant Reader first creates a cache of content — a corpus. This is the raw data. In order to do any analysis against the corpus, the corpus must be transformed into plain text. A program called Tika is used to do this work. [2] Not only does Tika transform just about any file into plain text, but it also does its best to extract metadata. Depending on many factors, this metadata may include names of authors, titles of documents, dates of creation, number of pages, MIME-type, language, etc. Unfortunately, more often than not, this metadata extraction process fails and the metadata is inaccurate, incomplete, or simply non-existent.
This is where the CSV file comes in; by including a CSV file named “metadata.csv” in the .zip file, the Distant Reader will be able to provide meaningful context. In turn, you will be able to make more informed observations, and thus your analysis will be more thorough. Here’s how:
The zip file with a companion CSV file has all the strengths & weakness of the plain o’ zip file, but it adds some more. On the weakness side, creating a CSV file can be both tedious and daunting. On the other hand, many search engines & index export lists with author, title, and data metadata. One can use these lists as the starting point for the CSV file.♱ On the strength side, the addition of the CSV metadata file makes the Distant Reader’s output immeasurably more useful, and it leads the way to additional compare & contrast opportunities.
To date, the Distant Reader takes five different types of input. Each type has its own set of strengths & weaknesses:
Happy reading!
‡ Distant Reader Bounty #1: To date, I have only tested plain text files using line-feed characters as delimiters, such are the format of plain text files in the Linux and Macintosh worlds. I will pay $10 to the first person who creates a plain text file of URLs delimited by carriage-return/line-feed characters (the format of Windows-based text files) and who demonstrates that such files break the Reader. “On you mark. Get set. Go!”
‡ Distant Reader Bounty #2: I will pay $20 to the first person who creates a list of 2,000 URLs and feeds it to the Reader.
♱ Distant Reader Bounty #3: I will pay $30 to the first person who writes a cross-platform application/script which successfully transforms a Zotero bibliography into a Distant Reader CSV metadata file.
[1] Link Grabber – http://bit.ly/2mgTKsp
[2] Tika – http://tika.apache.org
2019-10-19T00:29:14+00:00 Life of a Librarian: Invitation to hack the Distant Reader http://sites.nd.edu/emorgan/2019/06/hackathon/We invite you to write a cool hack enabling students & scholars to “read” an arbitrarily large corpus of textual materials.
A website called The Distant Reader takes an arbitrary number of files or links to files as input. [1] The Reader then amasses the files locally, transforms them into plain text files, and performs quite a bit of natural language processing against them. [2] The result — the the form of a file system — is a set of operating system independent indexes which point to individual files from the input. [3] Put another way, each input file is indexed in a number of ways, and therefore accessible by any one or combination of the following attributes:
All of things listed above are saved as plain text files, but they have also been reduced to an SQLite database (./etc/reader.db), which is also distributed with the file system.
Your mission, if you choose to accept it, is to write a cool hack against the Distant Reader’s output. By doing so, you will be enabling people to increase their comprehension of the given files. Here is a list of possible hacks:
In order for you to do your good work, you will need some Distant Reader output. Here are pointers to some such stuff:
With the exception of only a few files (./etc/reader.db, ./etc/reader.vec, and ./cache/*), all of the files in the Distant Reader’s output are plain text files. More specifically, they are either unstructured data files or delimited files. Despite any file’s extension, the vast majority of the files can be read with your favorite text editor, spreadsheet, or database application. To read the database file (./etc/reader.db), you will need an SQLite application. The files in the adr, bib, ent, pos, urls, or wrd directories are all tab delimited files. A program called OpenRefine is a WONDERFUL tool for reading and analyzing tab delimited files. [9] In fact, a whole lot can be learned through the skillful use of OpenRefine against the tab delimited files.
[1] The home page of the Distant Reader is https://distantreader.org
[2] All of the code doing this processing is available on GitHub. See https://github.com/ericleasemorgan/reader
[3] This file system is affectionately known as a “study carrel”.
[4] A easy-to-use library for creating such vectors is a part of the Scikit Learn suite of software. See http://bit.ly/2F5EoxA
[5] The algorithm is described at https://en.wikipedia.org/wiki/Cosine_similarity, and a SciKit Learn module is available at http://bit.ly/2IaYcS3
[6] The name of the library is called sql.js and it is available at https://github.com/kripken/sql.js/
[7] The Levenshtein distance is described here — https://en.wikipedia.org/wiki/Levenshtein_distance, and various libraries doing the good work are outlined at http://bit.ly/2F30roM
[8] Yet another SciKit Learn module may be of use here — http://bit.ly/2F5o2oS
[9] OpenRefine eats delimited files for lunch. See http://openrefine.org
2019-06-13T01:27:51+00:00 Life of a Librarian: Fantastic Futures: My take-aways http://sites.nd.edu/emorgan/2018/12/fantastic-futures/
 This is the briefest of take-aways from my attendance at Fantastic Futures, a conference on artificial intelligence (AI) in libraries. [1] From the conference announcement introduction:
The Fantastic futures-conferences, which takes place in Oslo december 5th 2018, is a collaboration between the National Library of Norway and Stanford University Libraries, and was initiated by the National Librarian at the National Library of Norway, Aslak Sira Myhre and University Librarian at Stanford University Libraries, Michael Keller.
First of all, I had the opportunity to attend and participate in a pre-conference workshop. Facilitated by Nicole Coleman (Stanford University) and Svein Brygfjeld (National Library of Norway), the workshop’s primary purpose was to ask questions about AI in libraries, and to build community. To those ends the two dozen or so of us were divided into groups where we discussed what a few AI systems might look like. I was in a group discussing the possibilities of reading massive amounts of text and/or refining information retrieval based on reader profiles. In the end our group thought such things were feasible, and we outlined how they might be accomplished. Other groups discussed things such as metadata creation and collection development. Towards the end of the day we brainstormed next steps, and at the very least try to use the ai4lib mailing list to a greater degree. [2]
 The next day, the first real day of the conference, was attended by more than a couple hundred of people. Most were from Europe, obviously, but from my perspective about as many were librarians as non-librarians. There was an appearance by Nancy Pearl, who, as you may or may not know, is a Seattle Public Library librarian embodied as an action figure. [3] She was brought to the conference because the National Library of Norway’s AI system is named Nancy. A few notable quotes from some of the speakers, as least from my perspective, included:
The presenters generated lively discussion, and I believe the conference was a success by the vast majority of attendees. It is quite likely the conference will be repeated next year and be held at Stanford.
What are some of my take-aways? Hmmm:
It was an honor and a privilege to attend the pre-conference workshop and conference. I sincerely believe AI can be used in libraries, and the use can be effective. Putting AI into practice will take time, energy, & prioritization. How do this and simultaneously “keep the trains running” will be a challenge. On the other hand, AI in libraries can be seen as an opportunity to demonstrate the inherent worth of cultural heritage institutions. ai4lib++
P.S. Along the way I got to see some pretty cool stuff: Viking ships, a fort, “The Scream”, and a “winterfest”. I also got to experience sunset at 3:30 in the afternoon.
[1] Fantastic Futures – https://www.nb.no/artikler/fantastic-futures/
[2] ai4lib – https://groups.google.com/forum/#!forum/ai4lib
[3] action figure – https://www.amazon.com/Nancy-Pearl-Librarian-Action-Figure/dp/B0006FU9EG
2018-12-11T02:43:06+00:00 Life of a Librarian: marc2catalog http://sites.nd.edu/emorgan/2018/07/marc2catalog/Given a set of MARC records, output a set of library catalogs
This set of scripts will take a set of MARC data, parse it into a simple (rudimentary and SQLite) database, and then generate a report against the database in the form of plain text files — a set of “library catalogs & indexes”. These catalogs & indexes are intended to be printed, but they can also be used to support rudimentary search via one’s text editor. For extra credit, the programer could read the underlying database, feed the result to an indexer, and create an OPAC (online public access catalog).
The system requires a bit of infrastructure: 1) Bash, 2) Perl, 3) a Perl module named MARC::Batch, 4) the DBI driver for SQLite.
The whole MARC-to-catalog process can be run with a single command:
./bin/make-all.sh <marc> <name>
Where <marc> is the name of the MARC file, and <name> is a one-word moniker for the collection. The distribution comes with sample data, and therefore an example execution includes:
./bin/make-all.sh ./etc/morse.mrc morse
The result ought to be the creation of a .db file in the ./etc directory, a collections directory, and sub-directory of collections, and a set of plain text files in the later. The plain text files are intended to be printed or given away like candy to interested learners or scholars.
The code for marc2catalog ought to be available on GitHub.
2018-07-02T23:07:51+00:00 Mini-musings: Charting & graphing with Tableau Public http://infomotions.com/blog/2018/05/tableau/They say, “A picture is worth a thousand words”, and through use of something like Tableau this can become a reality in text mining.
After extracting features from a text, you will have almost invariably created lists. Each of the items on the lists will be characterized with bits of context thus transforing the raw data into information. These lists will probably take the shape of matrices (sets of rows & columns), but other data structures exist as well, such as networked graphs. Once the data has been transformed into information, you will want to make sense of the information — turn the information into knowledge. Charting & graphing the data is one way to make that happen.
For example, the reader may have associated each word in a text with a part-of-speech, and then this association was applied across a corpus. The reader might then ask, “To what degree are words associated with each part-of-speech similar or different across items in the corpus? Do different items include similar or different personal pronouns, and therefore, are some documents more male, more female, or more gender neutral?” Alternatively, suppose the named entities have been extracted from items in a corpus, then the reader may want to know, “What countries, states, and/or cities are mentioned in the text/corpus, and to what degree? Are these texts ‘European’ in scope?”
A charting & graphing application like Tableau (or Tableau Public) can address these questions. [1] The first can be answered by enabling the reader to select one more more items from a corpus, select one or more parts-of-speech, counting & tabulating the intersected words, and displaying the result as a word cloud. The second question can be addressed similarly. Allow the reader to select items from a corpus, extract the names of places (countries, states, and cities), and plot the geographic coordinates on a global map. Once these visualizations are complete, they can be saved on the Web for others to use, for example:
 |
 |
Creating visualizations with Tableau (or Tableau Public) takes practice. Not only does the reader need to have structured data in hand, but one needs to be patient in the learning of the interface. To the author’s mind, the whole thing is reminiscent of the venerable HyperCard program from the 1980’s where one was presented with a number of “cards”, and programming interfaces were created by placing “objects” on them.

This workshop comes with two previously created Tableau workbooks located in the etc directory (word-clouds.twbx and maps.twbx). Describing the process to create them is beyond the scope of this workshop, but an outline follows:
Tableau is not really intended to be used against textual data/information; Tableau is more useful and more functional when applied to tabular numeric data. After all, the program is called… Tableau. This does not mean Tableau can not be exploited by the text miner. It just means it requires practice and an ability to articulate a question to be answered with the help of a visualization.
[1] Tableau Public – https://public.tableau.com/
2018-05-04T16:02:36+00:00 Mini-musings: Extracting parts-of-speech and named entities with Stanford tools http://infomotions.com/blog/2018/04/pos-ner/Extracting specific parts-of-speech as well as “named entities”, and then counting & tabulating them can be quite insightful.
Parts-of-speech include nouns, verbs, adjectives, adverbs, etc. Named entities are specific types of nouns, including but not limited to, the names of people, places, organizations, dates, times, money amounts, etc. By creating features out of parts-of-speech and/or named entities, the reader can answer questions such as:
There are a number of tools enabling the reader to extract parts-of-speech, including the venerable Brill part-of-speech tagger implemented in a number of programming languages, CLAWS, the Apache OpenNLP, and a specific part of the Stanford NLP suite of tools called the Stanford Log-linear Part-Of-Speech Tagger. [1] Named entities can be extracted with the Stanford Named Entity Recognizer (NER). [2] This workshop exploits the Standford tools.
The Stanford Log-linear Part-Of-Speech Tagger is written in Java, making it a bit difficult for most readers to use in the manner it was truly designed, the author included. Luckily, the distribution comes with a command-line interface allowing the reader to use the tagger sans any Java programing. Because any part-of-speech or named entity extraction application is the result of a machine learning process, it is necessary to use a previously created computer model. The Stanford tools comes quite a few models from which to choose. The command-line interface also enables the reader to specify different types of output: tagged, XML, tab-delimited, etc. Because of all these options, and because the whole thing uses Java “archives” (read programming libraries or modules), the command-line interface is daunting, to say the least.
After downloading the distribution, the reader ought to be able to change to the bin directory, and execute either one of the following commands:
$ stanford-postagger-gui.sh> stanford-postagger-gui.batThe result will be a little window prompting for a sentence. Upon entering a sentence, tagged output will result. This is a toy interface, but demonstrates things quite nicely.

The full-blown command-line interface is bit more complicated. From the command-line one can do either of the following, depending on the operating system:
$ stanford-postagger.sh models/english-left3words-distsim.tagger walden.txt> stanford-postagger.bat models\english-left3words-distsim.tagger walden.txtThe result will be a long stream of tagged sentences, which I find difficult to parse. Instead, I prefer the inline XML output, which is much more difficult to execute but much more readable. Try either:
$ java -cp stanford-postagger.jar: edu.stanford.nlp.tagger.maxent.MaxentTagger -model models/english-left3words-distsim.tagger -outputFormat inlineXML -outputFormatOptions lemmatize -textFile walden.txt> java -cp stanford-postagger.jar: edu.stanford.nlp.tagger.maxent.MaxentTagger -model models\english-left3words-distsim.tagger -outputFormat inlineXML -outputFormatOptions lemmatize -textFile walden.txtIn these cases, the result will be a long string of ill-formed XML. With a bit of massaging, this XML is much easier to parse with just about any compute programming language, believe it or not. The tagger can also be run in server mode, which makes batch processing a whole lot easier. The workshop’s distribution comes a server and client application for exploiting these capabilities, but, unfortunately, they won’t run on Windows computers unless some sort of Linux shell has been installed. Some people can issue the following command to launch the server from the workshop’s distribution:
$ ./bin/pos-server.sh
The reader can run the client like this:
$ ./bin/pos-client.pl walden.txt
The result will be a well-formed XML file, which can be redirected to a file, processed by another script converting it into a tab-delimited file, and finally saved to a second file for reading by a spreadsheet, database, or data analysis tool:
$ ./bin/pos-client.pl walden.txt > walden.pos; ./bin/pos2tab.pl walden.pos > walden.tsv
For the purposes of this workshop, the whole of the harvested data has been pre-processed with the Stanford Log-linear Part-Of-Speech Tagger. The result is been mirrored in the parts-of-speech folder/directory. The reader can open the files in the parts-of-speech folder/directory for analysis. For example, you might open them in OpenRefine and try to see what verbs appear most frequently in a given document. My guess the answer will be the lemmas “be” or “have”. The next set of most frequently used verb lemmas will probably be more indicative of the text.
The process of extrating features of name entities is very similar with the Stanford NER. The original Stanford NER distribution comes with a number of jar files, models, and configuration/parameter files. After downloading the distribution, the reader can run a little GUI application, import some text, and run NER. The result will look something like this:

The simple command-line interface takes a single file as input, and it outputs a stream of tagged sentences. For example:
$ ner.sh walden.txt> ner.bat walden.txtEach tag denotes an entity (i.e. the name of a person, the name of a place, the name of an organization, etc.). Like the result of all machine learning algorithms, the tags are not necessarily correct, but upon closer examination, most of them are pretty close. Like the POS Tagger, this workshop’s distribution comes with a set of scripts/programs that can make the Stanford NER tool locally available as a server. It also comes with a simple client to query the server. Like the workshop’s POS tool, the reader (with a Macintosh or Linux computer) can extract named entities all in two goes:
$ ./bin/pos-server.sh
$ ./bin/pos-client.pl walden.txt > walden.ner; ./bin/pos2tab.pl walden.ner > walden.tsv
Like the workshop’s pre-processed part-of-speech files, the workshop’s corpus has been pre-processed with the NER tool. The preprocessed files ought to be in a folder/directory named… named-entities. And like the parts-of-speech files, the “ner” files are tab-delimited text files readable by spreadsheets, databases, OpenRefine, etc. For example, you might open one of them in OpenRefine and see what names of people trend in a given text. Try to create a list of places (which is not always easy), export them to a file, and open them with Tabeau Public for the purposes of making a geographic map.
Extracting parts-of-speech and named entities straddles simple text mining and natural language processing. Simple text mining is often about counting & tabulating features (words) in a text. These features have little context sans proximity to other features. On the other hand, parts-of-speech and named entities denote specific types of things, namely specific types of nouns, verbs, adjectives, etc. While these thing do not necessarily denote meaning, they do provide more context than simple features. Extracting parts-of-speech and named entities is (more or less) a easy text mining task with more benefit than cost. Extracting parts-of-speech and named entities goes beyond the basics.
It is imperative to create plain text versions of corpus items.
Text mining can not be done without plain text data. This means HTML files need to be rid of markup. It means PDF files need to have been “born digitally” or they need to have been processed with optical character recognition (OCR), and then the underlying text needs to be extracted. Word processor files need to converted to plain text, and the result saved accordingly. The days of plain o’ ASCII text files need to be forgotten. Instead, the reader needs to embrace Unicode, and whenever possible, make sure characters in the text files are encoded as UTF-8. With UTF-8 encoding, one gets all of the nice accent marks so foreign to United States English, but one also gets all of the pretty emoticons increasingly sprinkling our day-to-day digital communications. Moreover, the data needs to be as “clean” as possible. When it comes to OCR, do not fret too much. Given the large amounts of data the reader will process, “bad” OCR (OCR with less than 85% accuracy) can still be quite effective.
Converting harvested data into plain text used to be laborious as well as painful, but then a Java application called Apache Tika came on the scene. [1] Tika comes in two flavors: application and server. The application version can take a single file as input, and it can output metadata as well as any underlying text. The application can also work in batch mode taking a directory as input and saving the results to a second directory. Tika’s server version is much more expressive, more powerful, and very HTTP-like, but it requires more “under the hood” knowledge to exploit to its fullest potential.
For the sake of this workshop, versions of the Tika application and Tika server are included in the distribution, and they have been saved in the lib directory with the names tika-desktop.jar and tika-server.jar. The reader can run the desktop/GUI version of the Tika application by merely double-clicking on it. The result will be a dialog box.
 |
 |
Drag a PDF (or just about any) file on to the window, and Tika will extract the underlying text. To use the command-line interface, something like this could be run to output the help text:
$ java -jar ./lib/tika-desktop.jar --help> java -jar .\lib\tika-desktop.jar --helpAnd then something like these commands to process a single file or a whole directory of files:
$ java -jar ./lib/tika-desktop.jar -t <filename>$ java -jar ./lib/tika-desktop.jar -t -i <input directory> -o <output directory>> java -jar .\lib\tika-desktop.jar -t <filename>> java -jar .\lib\tika-desktop.jar -t -i <input directory> -o <output directory>Try transforming a few files individually as well as in batch. What does the output look like? To what degree is it readable? To what degree has the formatting been lost? Text mining does not take formatting into account, so there is no huge loss in this regard.
Without some sort of scripting, the use of Tika to convert harvested data into plain text can still be tedious. Consequently, the whole of the workshop’s harvested data has been pre-processed with a set of Perl and bash scripts (which probably won’t work on Windows computers unless some sort of Linux shell has been installed):
$ ./bin/tika-server.sh – runs Tika in server mode on TCP port 8080, and waits patiently for incoming connections$ ./bin/tika-client.pl – takes a file as input, sends it to the server, and returns the plain text while handling the HTTP magic in the middle$ ./bin/file2txt.sh – a front-end to the second script taking a file and directory name as input, transforming the file into plain text, and saving the result with the same name but in the given directory and with a .txt extensionThe entirety of the harvested data has been transformed into plain text for the purposes of this workshop. (“Well, almost all.”) The result has been saved in the folder/directory named “corpus”. Peruse the corpus directory. Compare & contrast its contents with the contents of the harvest directory. Can you find any ommisions, and if so, then can you guess why/how they occurred?
Topic modeling is an unsupervised machine learning process. It is used to create clusters (read “subsets”) of documents, and each cluster is characterized by sets of one or more words. Topic modeling is good at answering questions like, “If I were to describe this collection of documents in a single word, then what might that word be? How about two?” or make statements like, “Once I identify clusters of documents of interest, allow me to read/analyze those documents in greater detail.” Topic modeling can also be used for keyword (“subject”) assignment; topics can be identified and then documents can be indexed using those terms. In order for a topic modeling process to work, a set of documents first needs to be assembled. The topic modeler then, at the very least, takes an integer as input, which denotes the number of topics desired. All other possible inputs can be assumed, such as use of a stop word list or denoting the number of time the topic modeler ought to internally run before it “thinks” it has come the best conclusion.
MALLET is the grand daddy of topic modeling tools, and it supports other functions such as text classification and parsing. [1] It is essentially a set of Java-based libraries/modules designed to be incorporated into Java programs or executed from the command line.
A subset of MALLET’s functionality has been implemented in a program called topic-modeling-tool, and the tool bills itself as “A GUI for MALLET’s implementation of LDA.” [2] Topic-modeling-tool provides an easy way to read what possible themes exist in a set of documents or how the documents might be classified. It does this by creating topics, displaying the results, and saving the data used to create the results for future use. Here’s one way:
The result will be a set of HTML, CSS, and CSV files saved in the output location. The “answer” can also be read in the tool’s console.
A more specific example is in order. Here’s how to answer the question, “If I were describe this corpus in a single word, then what might that one word be?”:
 |
 |
What one word can be used to describe your collection?
Iterate the modeling process by slowly increasing the number of desired topics and number of topic words. Personally, I find it interesting to implement a matrix of topics to words. For example, start with one topic and one word. Next, denote two topics with two words. Third, specify three topics with three words. Continue the process until the sets of words (“topics”) seem to make intuitive sense. After a while you may observe clear semantic distinctions between each topic as well as commonalities between each of the topic words. Distinctions and commonalities may include genders, places, names, themes, numbers, OCR “mistakes”, etc.
The venerable Python Natural Language Toolkit (NLTK) is well worth the time of anybody who wants to do text mining more programmatically. [0]
For much of my career, Perl has been the language of choice when it came to processing text, but in the recent past it seems to have fallen out of favor. I really don’t know why. Maybe it is because so many other computer languages have some into existence in the past couple of decades: Java, PHP, Python, R, Ruby, Javascript, etc. Perl is more than capable of doing the necessary work. Perl is well-supported, and there are a myriad of supporting tools/libraries for interfacing with databases, indexers, TCP networks, data structures, etc. On the other hand, few people are being introduced to Perl; people are being introduced to Python and R instead. Consequently, the Perl community is shrinking, and the communities for other languages is growing. Writing something in a “dead” language is not very intelligent, but that may be over-stating the case. On the other hand, I’m not going to be able to communicate with very many people if I speak Latin and everybody else is speaking French, Spanish, or German. It behooves the reader to write software in a language apropos to the task as well as a langage used by many others.
Python is a good choice for text mining and natural language processing. The Python NLTK provides functionality akin to much of what has been outlined in this workshop, but it goes much further. More specifically, it interaces with WordNet, a sort of thesaurus on steroids. It interfaces with MALLET, the Java-based classification & topic modeling tool. It is very well-supported and continues to be maintained. Moreover, Python is mature in & of itself. There are a host of Python “distributions/frameworks”. There are any number of supporting libraries/modules for interfacing with the Web, databases & indexes, the local file system, etc. Even more importantly for text mining (and natural language processing) techniques, Python is supported by a set of robust machine learning libraries/modules called scikit-learn. If the reader wants to write text mining or natural language processing applications, then Python is really the way to go.
In the etc directory of this workshop’s distribution is a “Jupyter Notebook” named “An introduction to the NLTK.ipynb”. [1] Notebooks are sort of interactive Python interfaces. After installing Jupyter, the reader ought to be able to run the Notebook. This specific Notebook introduces the use of the NLTK. It walks you through the processes of reading a plain text file, parsing the file into words (“features”). Normalizing the words. Counting & tabulating the results. Graphically illustrating the results. Finding co-occurring words, words with similar meanings, and words in context. It also dabbles a bit into parts-of-speech and named entity extraction.

The heart of the Notebook’s code follows. Given a sane Python intallation, one can run this proram by saving it with a name like introduction.py, saving a file named walden.txt in the same directory, changing to the given directory, and then running the following command:
python introduction.py
The result ought to be a number of textual outputs in the terminal window as well as a few graphics.
Errors may occur, probably because other Python libraries/modules have not been installed. Follow the error messages’ instructions, and try again. Remember, “Your milage may vary.”
# configure; using an absolute path, define the location of a plain text file for analysis
FILE = 'walden.txt'

# import / require the use of the Toolkit
from nltk import *

# slurp up the given file; display the result
handle = open( FILE, 'r')
data   = handle.read()
print( data )

# tokenize the data into features (words); display them
features = word_tokenize( data )
print( features )

# normalize the features to lower case and exclude punctuation
features = [ feature for feature in features if feature.isalpha() ]
features = [ feature.lower() for feature in features ]
print( features )

# create a list of (English) stopwords, and then remove them from the features
from nltk.corpus import stopwords
stopwords = stopwords.words( 'english' )
features  = [ feature for feature in features if feature not in stopwords ]

# count & tabulate the features, and then plot the results -- season to taste
frequencies = FreqDist( features )
plot = frequencies.plot( 10 )

# create a list of unique words (hapaxes); display them
hapaxes = frequencies.hapaxes()
print( hapaxes )

# count & tabulate ngrams from the features -- season to taste; display some
ngrams      = ngrams( features, 2 )
frequencies = FreqDist( ngrams )
frequencies.most_common( 10 )

# create a list each token's length, and plot the result; How many "long" words are there?
lengths = [ len( feature ) for feature in features ]
plot    = FreqDist( lengths ).plot( 10 )

# initialize a stemmer, stem the features, count & tabulate, and output
from nltk.stem import PorterStemmer
stemmer     = PorterStemmer()
stems       = [ stemmer.stem( feature ) for feature in features ]
frequencies = FreqDist( stems )
frequencies.most_common( 10 )

# re-create the features and create a NLTK Text object, so other cool things can be done
features = word_tokenize( data )
text     = Text( features )

# count & tabulate, again; list a given word -- season to taste
frequencies = FreqDist( text )
print( frequencies[ 'love' ] )

# do keyword-in-context searching against the text (concordancing)
print( text.concordance( 'love' ) )

# create a dispersion plot of given words
plot = text.dispersion_plot( [ 'love', 'war', 'man', 'god' ] )

# output the "most significant" bigrams, considering surrounding words (size of window) -- season to taste
text.collocations( num=10, window_size=4 )

# given a set of words, what words are nearby
text.common_contexts( [ 'love', 'war', 'man', 'god' ] )

# list the words (features) most associated with the given word
text.similar( 'love' )

# create a list of sentences, and display one -- season to taste
sentences = sent_tokenize( data )
sentence  = sentences[ 14 ]
print( sentence )

# tokenize the sentence and parse it into parts-of-speech, all in one go
sentence = pos_tag( word_tokenize( sentence ) )
print( sentence )

# extract named enities from a sentence, and print the results
entities = ne_chunk( sentence )
print( entities )

# done
quit()
Voyant Tools is often the first go-to tool used by either: 1) new students of text mining and the digital humanities, or 2) people who know what kind of visualization they need/want. [1] Voyant Tools is also one of the longest supported tools described in this bootcamp.
As stated the Tool’s documentation: “Voyant Tools is a web-based text reading and analysis environment. It is a scholarly project that is designed to facilitate reading and interpretive practices for digital humanities students and scholars as well as for the general public.” To that end it offers a myriad of visualizations and tabular reports characterizing a given text or texts. Voyant Tools works quite well, but like most things, the best use comes with practice, a knowledge of the interface, and an understanding of what the reader wants to express. To all these ends, Voyant Tools counts & tabulates the frequencies of words, plots the results in a number of useful ways, supports topic modeling, and the comparison documents across a corpus. Examples include but are not limited to: word clouds, dispersion plots, networked analysis, “stream graphs”, etc.
 dispersion chart |
 network diagram |
 “stream” chart |
 word cloud |
 concordance |
 topic modeling |
Voyant Tools’ initial interface consists of six panes. Each pain encloses a feature/function of Voyant. In the author’s experience, Voyant Tools’ is better experienced by first expanding one of the panes to a new window (“Export a URL”), and then deliberately selecting one of the tools from the “window” icon in the upper left-hand corner. There will then be displayed a set of about two dozen tools for use against a document or corpus.
 initial layout |
 focused layout |
Using Voyant Tools the reader can easily ask and answer the following sorts of questions:
After a more thorough examination of the reader’s corpus, and after making the implicit more explicit, Voyant Tools can be more informative. Randomly clicking through its interface is usually daunting to the novice. While Voyant Tools is easy to use, it requires a combination of text mining knoweldge and practice in order to be used effectively. Only then will useful “distant” reading be done.
[1] Voyant Tools – https://voyant-tools.org/
2018-04-25T02:44:53+00:00 Life of a Librarian: Project English: An Index to English/American literature spanning six centuries http://sites.nd.edu/emorgan/2018/04/project-english/I have commenced upon a project to build an index and set of accompanying services rooted in English/American literature spanning the 15th to 20th centuries. For the lack of a something better, I call it Project English. This blog posting describes Project English in greater detail.
The goals of the Project include but are not limited to:
To accomplish these goals I have acquired a subset of three distinct and authoritative collections of English/American literature:
More specifically, the retired and emeritus English Studies Librarian, Laura Fuderer purchased hard drives containing the full text of the aforementioned collections. Each item in the collection is manifested as an XML file and a set of JPEG images (digital scans of the original materials). The author identified the hard drives, copied some of the XML files, and began the Project. To date, the collection includes:
At the present time, the whole thing consumes 184 GB of disk space where approximately 1/3 of it is XML files, 1/3 of it is HTML files transformed from the XML, and 1/3 is plain text files transformed from the XML. At the present time, there are no image nor PDF files in the collection.
On average, each item in the collection is approximately 135 pages (or 46,000 words) long. As of right now, each sub-collection is equally represented. The vast majority of the collection is in English, but other languages are included. Most of the content was published in London. The distribution of centuries is beginning to appear balanced, but determining the century of publication is complicated by the fact the metadata’s date values are not expressed as integers. The following charts & graphs illustrate all of these facts.
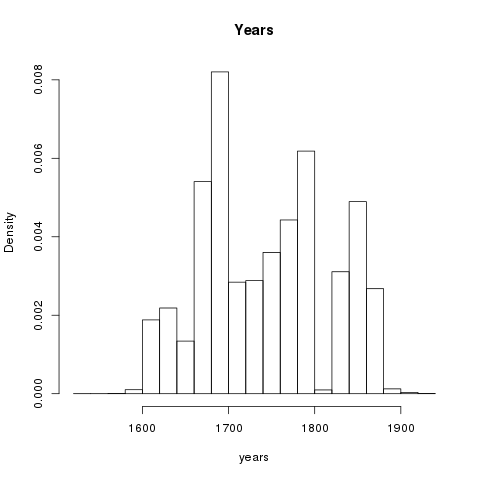 |
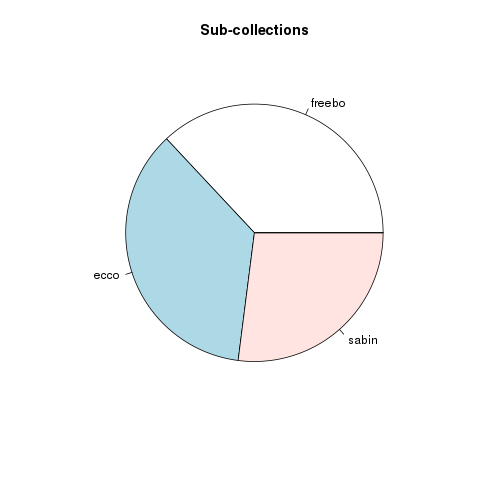 |
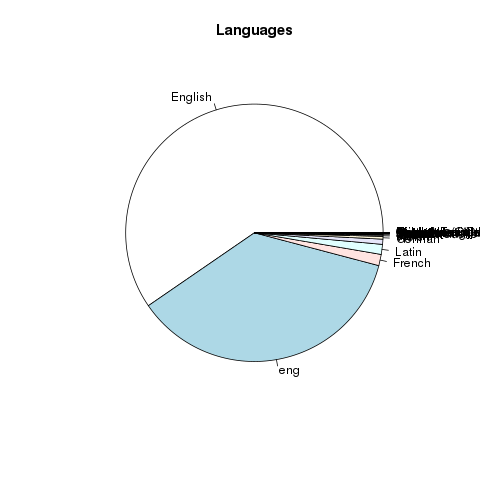 |
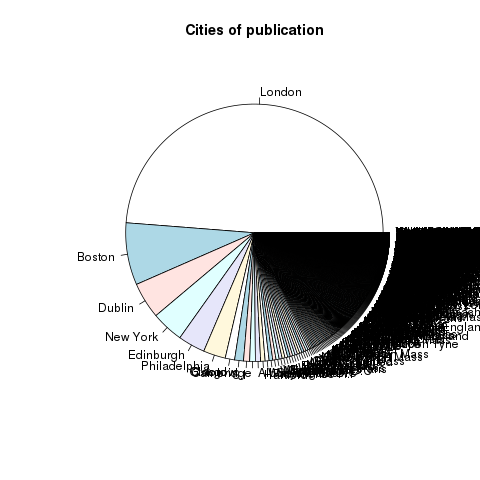 |
By default, the collection is accessible via freetext/fielded/faceted searching. Given an EBBO, ECCO, or Sabin identifier, the collection is also accessible via known-item browse. (Think “call number”.) Search results can optionally be viewed and sorted using a tabled interface. (Think “spreadsheet”.) The reader has full access to:
Search results and its associated metadata can also be downloaded en masse. This enables the reader to do offline analysis such as text mining, concordancing, parts-of-speech extraction, or topic modeling. Some of these things are currently implemented inline, including:
For example, the reader can first create a set of one or more items of interest. They can then do some “distant” or “scalable” reading against the result. In its current state, Project English enables the reader to answer questions like:
As Project English matures, it will enable the reader to answer additional questions, such as:
Remember, one of the goals of the Project is to push the boundaries of librarianship. With the advent of ubiquitous networked computers, the traditional roles of librarianship are not as important as they previously were. (I did not say the roles were unimportant, just not as important as they used to be.) Put another way, there is less of a need for the collection, organization, preservation, and dissemination of data, information, and knowledge. Much of this work is being facilitated through the Internet. This then begs the question, “Given the current environment, what are or can be the roles of (academic) libraries?” In the author’s opinion, the roles are rooted in two activities:
In the case of Project English, the rare & infrequently held materials are full text items dating from 15th to 20th centuries. When it is all said & done, the collection may come close to 2.5 million titles in size, a modest library by most people’s standards. These collections are being curated with scope, with metadata, with preservation, and with quick & easy access. The value-added services are fledgling, but they will include a sets of text mining & natural langage processing interfaces enabling the learner, teacher, and scholar to do “distant” and “scalable” reading. In other words, instead of providing access to materials and calling the work of librarianship done, Project English will enable & empower the reader to use & understand the materials they have acquired.
Librarianship needs to go beyond the automation of traditional tasks; it behooves librarianship to exploit computers to a greater degree and use them to augment & supplement the profession’s reason and experience. Project English is one librarian’s attempt to manifest this idea into a reality.
2018-04-24T20:48:13+00:00 Mini-musings: Using a concordance (AntConc) to facilitate searching keywords in context http://infomotions.com/blog/2018/04/concordance/A concordance is one of the oldest of text mining tools dating back to at least the 13th century when they were used to analyze and “read” religious texts. Stated in modern-day terms, concordances are key-word-in-context (KWIC) search engines. Given a text and a query, concordances search for the query in the text, and return both the query as well as the words surrounding the query. For example, a query for the word “pond” in a book called Walden may return something like the following:
  1.    the shore of Walden Pond, in Concord, Massachuset
  2.   e in going to Walden Pond was not to live cheaply
  3.    thought that Walden Pond would be a good place fo
  4.    retires to solitary ponds to spend it. Thus also
  5.    the woods by Walden Pond, nearest to where I inte
  6.    I looked out on the pond, and a small open field
  7.   g up. The ice in the pond was not yet dissolved, t
  8.   e whole to soak in a pond-hole in order to swell t
  9.   oping about over the pond and cackling as if lost,
  10.  nd removed it to the pond-side by small cartloads,
  11.  up the hill from the pond in my arms. I built the
The use of a concordance enables the reader to learn the frequency of the given query as well as how it is used within a text (or corpus).
Digital concordances offer a wide range of additional features. For example, queries can be phrases or regular expressions. Search results and be sorted by the words on the left or on the right of the query. Queries can be clustered by the proximity of their surrounding words, and the results can be sorted accordingly. Queries and their nearby terms can be scored not only by their frequencies but also by the probability of their existence. Concordances can calculate the postion of a query i a text and illustrate the result in the form of a dispersion plot or histogram.
 AntConc is a free, cross-platform concordance program that does all of the things listed above, as well as a few others. [1] The interface is not as polished as some other desktop applications, and sometimes the usability can be frustrating. On the other hand, given practice, the use of AntConc can be quite illuminating. After downloading and running AntConc, give these tasks a whirl:
The use of a concordance is often done just after the creation of a corpus. (Remember, a corpus can include one or more text files.) But the use of a concordance is much more fruitful and illuminating if the features of a corpus are previously made explicit. Concordances know nothing about parts-of-speech nor grammer. Thus they have little information about the words they are analyzing. To a concordance, every word is merely a token — the tiniest bit of data. Whereas features are more akin to information because they have value. It is better to be aware of the information at your disposal as opposed to simple data. Do not rush to the use of a concordance before you have some information at hand.
[1] AntConc – http://www.laurenceanthony.net/software/antconc/
2018-04-23T11:53:24+00:00 Mini-musings: Word clouds with Wordle http://infomotions.com/blog/2018/04/word-clouds/
 A word cloud, or sometimes called a “tag cloud” is a fun, easy, and popular way to visualize the characteristics of a text. Usually used to illustrate the frequency of words in a text, a word clouds make some features (“words”) bigger than others, sometimes colorize the features, and amass the result in a sort of “bag of words” fashion.
Many people disparage the use of word clouds. This is probably because word clouds may have been over used. The characteristics they illustrate are sometimes sophomoric. Or too much value has been given to their meaning. Despite these facts, a word cloud is an excellent way to initialize the analysis of texts.
There are many word cloud applications and programming libraries, but Wordle is probably the easiest to use as well as the most popular. † [1] To get started, use your Web browser and go to the Wordle site. Click the Create tab and type some text into the resulting text box. Submit the form. Your browser may ask for permissions to run a Java application, and if granted, the result ought to be simple word cloud. The next step is to play with Wordle’s customizations: fonts, colors, layout, etc. To begin doing useful analysis, open a file from the workshop’s corpus, and copy/paste it into Wordle. What does the result tell you? Copy/paste a different file into Wordle and then compare/contrast the two word clouds.
 By default, Wordle make effort to normalize the input. It removes stop words, lower-cases letters, removes numbers, etc. Wordle then counts & tabulates the frequencies of each word to create the visualization. But the frequency of words only tells one part of a text’s story. There are other measures of interest. For example, the reader might want to create a word cloud of ngram frequencies, the frequencies of parts-of-speech, or even the log-likelihood scores of significant words. To create the sorts of visualization as word clouds, the reader must first create a colon-delimited list of features/scores, and then submit them under Wordle’s Advanced tab. The challenging part of this process is created the list of features/scores, and the process can be done using a combination of the tools described in the balance of the workshop.
† Since Wordle is a Web-based Java application, it is also a good test case to see whether or not Java is installed and configured on your desktop computer.
[1] Wordle – http://www.wordle.net
2018-04-22T14:36:02+00:00 Mini-musings: An introduction to the NLTK: A Jupyter Notebook http://infomotions.com/blog/2018/04/intro-to-nltk/The attached file introduces the reader to the Python Natural Langauge Toolkit (NLTK).
The Python NLTK is a set of modules and corpora enabling the reader to do natural langauge processing against corpora of one or more texts. It goes beyond text minnig and provides tools to do machine learning, but this Notebook barely scratches that surface.
This is my first Python Jupyter Notebook. As such I’m sure there will be errors in implementation, style, and functionality. For example, the Notebook may fail because the value of FILE is too operating system dependent, or the given file does not exist. Other failures may/will include the lack of additional modules. In these cases, simply read the error messages and follow the instructions. “Your mileage may vary.”
That said, through the use of this Notebook, the reader ought to be able to get a flavor for what the Toolkit can do without the need to completly understand the Python language.
2018-04-13T03:31:59+00:00 Mini-musings: What is text mining, and why should I care? http://infomotions.com/blog/2018/03/what-is-text-mining-and-why-should-i-care/[This is the first of a number of postings on the topic of text mining. More specifically, this is the first draft of an introductory section of a hands-on bootcamp scheduled for ELAG 2018. As I write the bootcamp’s workbook, I hope to post things here. Your comments are most welcome. –ELM]
 Text mining is a process used to identify, enumerate, and analyze syntactic and semantic characteristics of a corpus, where a corpus is a collection of documents usually in the form of plain text files. The purpose of this process it to bring to light previously unknown facts, look for patterns & anomalies in the facts, and ultimately have a better understanding of the corpora as a whole.
The simplest of text mining processes merely count & tabulate a document’s “tokens” (usually words but sometimes syllables). The counts & tabulations are akin to the measurements and observations made in the physical and social sciences. Statistical methods can then be applied to the observations for the purposes of answering questions such as:
The answers to these questions bring to light a corpus’s previously unknown features enabling the reader to use & understand a corpus more fully. Given the answers to these sorts of questions, a person can learn when Don Quixote actually tilts at windmills, to what degree does Thoreau’s Walden use the word “ice” in the same breath as “pond”, or how has the defintion of “scientific practice” has evolved over time?
Given models created from the results of natural language processing, other characteristics (sentences, parts-of-speech, named entities, etc.) can be parsed. These values can also be counted & tabulated enabling the reader to answer new sets of questions:
The documents in a corpus are often associated with metadata such as authors, titles, dates, subjects/keywords, numeric rankings, etc. This metadata can be combined with measurements & observations to answer questions like:
Again, text mining is a process, and the process usually includes the following steps:
Articulating a research question can be as informally stated as, “I’d like to know more about this corpus” or “I’d like to garner an overview of the corpus before I begin reading it in earnest.” On the other hand, articulating a research question can be as formal as a dissertation’s thesis statement. The purpose of articulating a research question — no matter how formal — is to give you a context for your investigations. Knowing a set of questions to answer helps you determine what tools you will employ in your inquires.
 Creating a corpus is not always as easy as you might think. The corpus can be as small as a single document, or as large as millions. The “documents” in the corpus can be anything from tweets from a Twitter feed, Facebook postings, survey comments, magazine or journal articles, reference manuals, books, screen plays, musical lyrics, etc. The original documents may have been born digital or not. If not, then they will need to be digitized in one way or another. It is better if each item in the corpus is associated with metadata, such as authors, titles, dates, keywords, etc. Actually obtaining the documents may be impeded by copyrights, licensing restrictions, or hardware limitations. Once the corpus is obtained, it is useful to organize it into a coherent whole. There is a lot of possible for when it comes to corpus creation.
Coercing a corpus into a form amenable to computer processing is a chore in an of itself. In all cases, the document’s text needs to be in “plain” text. These means the document includes only characters, numbers, punctuation marks, and a limited number of symbols. Plain text files include no graphical formatting. No bold. No italics, no “codes” denoting larger or smaller fonts, etc. Documents are usually manifested as files on a computer’s file system. The files are usually brought together as lists, and each item in the list have many attributes — the metadata describing each item. Furthermore, each document may need to be normalized, and normalization may include changing the case of all letters to lower case, parsing the document into words (usually called “features”), identifying the lemmas or stems of a word, eliminating stop/function words, etc. Coercing your corpus into coherent whole is not to be underestimated. Remember the old adage, “Garbage in, garbage out.”
Ironically, taking measurements and making observations is the easy part. There are a myriad of tools for this purpose, and the bulk of this workshop describes how to use them. One important note: it is imperative to format the measurements and observations in a way amenable to analysis. This usually means a tabular format where each column denotes a different observable characteristic. Without formating measurements and observation in tabular formats, it will be difficult to chart and graph any results.
Analyzing the results and drawing conclusions is the subprocess of looping back to Step #1. It is where you attempt to actually answer the questions previously asked. Keep in mind that human interpretation is a necessary part of this subprocess. Text mining does not present you with truth, only facts. It is up to you to interpret the facts. For example, suppose the month is January and the thermometer outside reads 32º Fahrenheit (0º Centigrade), then you might think nothing is amiss. On the other hand, suppose the month is August, and the thermometer still reads 32º, then what might you think? “It is really cold,” or maybe, “The thermometer is broken.” Either way, you bring context to the observations and interpret things accordingly. Text mining analysis works in exactly the same way.
 Finally, text mining is not a replacement for the process of traditional reading. Instead, it ought to be considered as complementary, supplemental, and a natural progression of traditional reading. With the advent of ubiquitous globally networked computers, the amount of available data and information continues to grow exponentially. Text mining provides a means to “read” massive amounts of text quickly and easily. The process is akin the inclusion of now-standard parts of a scholarly book: title page, verso complete with bibliographic and provenance metadata, table of contents, preface, introduction, divisions into section and chapters, footnotes, bibliography, and a back-of-the-book index. All of these features make a book’s content more accessible. Text mining processes applied to books is the next step in accessibility. Text mining is often described as “distant” or “scalable” reading, and it is often contrasted with the “close” reading. This is a false dichotomy, but only after text mining becomes more the norm will the dichotomy fade.
All that said, the totality of this hands-on workshop is based on the following outline:
By the end of the workshop you will have increased your ability to:
The workshop is operating system agnostic, and all the software is freely available on the ‘Net, or already installed on your computer. Active participation requires zero programming, but readers must bring their own computer, and they must be willing to learn how to use a text editor such as NotePad++ or BBEdit. NotePad, WordPad and TextEdit are totally insufficient.
2018-03-28T12:17:05+00:00 Life of a Librarian: LexisNexis hacks http://sites.nd.edu/emorgan/2017/12/lexisnexis-hacks/This blog posting briefly describes and makes available two Python scripts I call my LexisNexis hacks.
 The purpose of the scripts is to enable the researcher to reformulate LexisNexis full text downloads into tabular form. To accomplish this goal, the researchers is expected to first search LexisNexis for items of interest. They are then expected to do a full text download of the results as a plain text file. Attached ought to be an example that includes about five records. The first of my scripts — results2files.py — parses the search results into individual records. The second script — files2table.py — reads the output of the first script and parses each file into individual but selected fields. The output of the second script is a tab-delimited file suitable for further analysis in any number of applications.
These two scripts can work for a number of people, but there are a few caveats. First, results2files.py saves its results as a set of files with randomly generated file names. It is possbile, albeit unlikely, files will get overwritten because the same randomly generated file names was… generated. Second, the output of files2table.py only includes fields required for a specific research question. It is left up to the reader to edit files2table.py for additional fields.
In short, your milage may vary.
2017-12-18T22:37:47+00:00 Life of a Librarian: Freebo@ND and library catalogues http://sites.nd.edu/emorgan/2017/08/freebo-and-library-catalogues/Freebo@ND is a collection of early English book-like materials as well as a set of services provided against them. In order to use & understand items in the collection, some sort of finding tool — such as a catalogue — is all but required. Freebo@ND supports the more modern full text index which has become the current best practice finding tool, but Freebo@ND also offers a set of much more traditional library tools. This blog posting describes how & why the use of these more traditional tools can be beneficial to the reader/researcher. In the end, we will learn that “What is old is new again.”
 A long time ago, in a galaxy far far away, library catalogues were simply accession lists. As new items were brought into the collection, new entries were appended to the list. Each item would then be given an identifier, and the item would be put into storage. It could then be very easily located. Search/browse the list, identify item(s) of interest, note identifier(s), retrieve item(s), and done.
As collections grew, the simple accession list proved to be not scalable because it was increasingly difficult to browse the growing list. Thus indexes were periodically created. These indexes were essentially lists of authors, titles, or topics/subjects, and each item on the list was associated with a title and/or a location code. The use of the index was then very similar to the use of the accession list. Search/browse the index, identify item(s) of interest, note location code(s), retrieve item(s), and done. While these indexes were extremely functional, they were difficult to maintain. As new items became a part of the collection it was impossible to insert them into the middle of the printed index(es). Consequently, the printed indexes were rarely up-to-date.
To overcome the limitations of the printed index(es), someone decided not to manifest them as books, but rather as cabinets (drawers) of cards — the venerable card catalogue. Using this technology, it was trivial to add new items to the index. Type up cards describing items, and insert cards into the appropriate drawer(s). Readers could then search/browse the drawers, identify item(s) of interest, note location code(s), retrieve item(s), and done.
It should be noted that these cards were formally… formatted. Specifically, they included “cross-references” enabling the reader to literally “hyperlink” around the card catalogue to find & identify additional items of interest. On the downside, these cross-references (and therefore the hyperlinks) where limited by design to three to five in number. If more than three to five cross-references were included, then the massive numbers of cards generated would quickly out pace the space allotted to the cabinets. After all, these cabinets came dominate (and stereotype) libraries and librarianship. They occupied hundreds, if not thousands, of square feet, and whole departments of people (cataloguers) were employed to keep them maintained.
With the advent of computers, the catalogue cards became digitally manifested. Initially the digital manifestations were used to transmit bibliographic data from the Library of Congress to libraries who would print cards from the data. Eventually, the digital manifestations where used to create digital indexes, which eventually became the online catalogues of today. Thus, the discovery process continues. Search/browse the online catalogue. Identify items of interest. Note location code(s). Retrieve item(s). Done. But, for the most part, these catalogues do not meet reader expectations because the content of the indexes is merely bibliographic metadata (authors, titles, subjects, etc.) when advances in full text indexing have proven to be more effective. Alas, libraries simply do not have the full text of the books in their collections, and consequently libraries are not able to provide full text indexing services. †
 The catalogues representing the content of Freebo@ND are perfect examples of the history of catalogues as outlined above.
For all intents & purposes, Freebo@ND is YAVotSTC (“Yet Another Version of the Short-Title Catalogue”). In 1926 Pollard & Redgrave compiled an index of early English books entitled A Short-title Catalogue of books printed in England, Scotland, & Ireland and of English books printed abroad, 1475-1640. This catalogue became know as the “English short-title catalogue” or ESTC. [1] The catalog’s purpose is succinctly stated on page xi:
The aim of this catalogue is to give abridged entries of all ‘English’ books, printed before the close of the year 1640, copies of which exist at the British Museum, the Bodleian, the Cambridge University Library, and the Henry E. Huntington Library, California, supplemented by additions from nearly one hundres and fifty other collections.
The 600-page book is essentially an author index beginning with likes of George Abbot and ending with Ulrich Zwingli. Shakespeare begins on page 517, goes on for four pages, and includes STC (accession) numbers 22273 through 22366. And the catalogue functions very much like the catalogues of old. Articulate an author of interest. Look up the author in the index. Browse the listings found there. Note the abbreviation of libraries holding an item of interest. Visit library, and ultimately, look at the book.
The STC has a history and relatives, some of which is documented in a book entitled The English Short-Title Catalogue: Past, present, future and dating from 1998. [2] I was interested in two of the newer relatives of the Catalogue:
As outlined above, Freebo@ND is a collection of early English book-like materials as well as a set of services provided against them. The source data originates from the Text Creation Partnership, and it is manifested as a set of TEI/XML files with full/rich metadata as well as the mark up of every single word in every single document. To date, there are only 15,000 items in Freebo@ND, but when the project is complete, Freebo@ND ought to contain close to 60,000 items dating from 1460 to 1699. Given this data, Freebo@ND sports an online, full text index of the works collected to date. This online interface is both field searchable, free text searchable, and provides a facet browse interace. [6]
 But wait! There’s more!! (And this is the point.) Because the complete bibliographic data is available from the original data, it has been possible to create printed catalogs/indexes akin to the catalogs/indexes of old. These catalogs/indexes are available for downloading, and they include:
These catalogs/indexes are very useful. It is really easy to load these them into your favorite text editor and to peruse them for items of interest. They are even more useful if they are printed! Using these catalogues/indexes it is very quick & easy to see how prolific any author was, how many items were published a given year, and what the published items were about. The library profession’s current tools do not really support such functions. Moreover, and unlike the cool (“kewl”) online interfaces alluded to above, these printed catalogs are easily updated, duplicated, shareable, and if bound can stand the test of time. Let’s see any online catalog last more than a decade and be so inexpensively produced.
“What is old is new again.”
† Actually, even if libraries where to have the full text of their collection readily available, the venerable library catalogues would probably not be able to use the extra content. This is because the digital manifestations of the bibliographic data can not be more than 100,000 characters long, and the existing online systems are not designed for full text indexing. To say the least, the inclusion of full text indexing in library catalogues would be revolutionary in scope, and it would also be the beginning of the end of traditional library cataloguing as we know it.
[1] Short-title catalogue or ESTC – http://www.worldcat.org/oclc/846560579
[2] Past, present, future – http://www.worldcat.org/oclc/988727012
[3] STC on CD-ROM – http://www.worldcat.org/oclc/605215275
[4] ESTC as website – http://estc.bl.uk/
[5] ESTC about page – http://www.bl.uk/reshelp/findhelprestype/catblhold/estchistory/estchistory.html
[6] Freebo@ND search interface – http://cds.crc.nd.edu/cgi-bin/search.cgi
[7] main catalog – http://cds.crc.nd.edu/downloads/catalog-main.txt
[8] author index – http://cds.crc.nd.edu/downloads/catalog-author.txt
[9] title index – http://cds.crc.nd.edu/downloads/catalog-title.txt
[10] date index – http://cds.crc.nd.edu/downloads/catalog-date.txt
[11] subject index – http://cds.crc.nd.edu/downloads/catalog-subject.txt
Doing just about any type of text mining is a matter of: 0) articulating a research question, 1) acquiring a corpus, 2) cleaning the corpus, 3) coercing the corpus into a data structure one’s software can understand, 4) counting & tabulating characteristics of the corpus, and 5) evaluating the results of Step #4. Everybody wants to do Step #4 & #5, but the initial steps usually take more time than desired.

This is short list of “stories” outlining some of the more interesting projects I worked on this past year:

This is the initial blog posting introducing a fledgling website called Freebo@ND — a collection of early English print materials and services provided against them. [1]
 For the past year a number of us here in the Hesburgh Libraries at the University of Notre Dame have been working on a grant-sponsored project with others from Northwestern University and Washington University in St. Louis. Collectively, we have been calling our efforts the Early English Print Project, and our goal is to improve on the good work done by the Text Creation Partnership (TCP). [2]
“What is the TCP?” Briefly stated, the TCP is/was an organization set out to make freely available the content of Early English Books Online (EBBO). The desire is/was to create & distribute thoroughly & accurately marked up (TEI) transcriptions of early English books printed between 1460 and 1699. Over time the scope of the TCP project seemed to wax & wane, and I’m still not really sure how many texts are in scope nor where they can all be found. But I do know the texts are being distributed in two phases. Phase I texts are freely available to anybody. [3] Phase II texts are only available to institutions who sponsored the Partnership, but they too will be freely available to everybody in a few years.
Our goals — the goals of the Early English Print Project — are to:
While I have had my hand in the first two tasks, much of my time has been spent on the third. To this end I have been engineering ways to collect, organize, archive, disseminate, and evaluate our Project’s output. To date, the local collection includes approximately 15,000 transcriptions and 60,000,000 words. When the whole thing is said & done, they tell me I will have close to 60,000 transcriptions and 2,000,000,000 words. Consequently, this is by far the biggest collection I’ve ever curated.
My desire is to make sure Freebo@ND goes beyond “find & get” and towards “use & understanding”. [4] My goal is to provide services against the texts, not just the texts themselves. Locally collecting & archiving the original transcriptions has been relatively trivial. [5] After extracting the bibliographic data from each transcription, and after transforming the transcriptions into plain text, implementing full text searching has been easy. [6] Search even comes with faceted browse. To support “use & understanding” I’m beginning to provide services against the texts. For example, it is possible to download — in a computer-readable format — all the words from a given text, where each word from each text is characterized by its part-of-speech, lemma, given form, normalized form, and position in the text. Using this output, it is more than possible for students or researchers to compare & contrast the use of words & types of words across texts. Because the texts are described in both bibliographic as well as numeric terms, it is possible to sort search results by date, page length, or word count. [7] Additional numeric characteristics are being implemented. The use of “log-likelihood ratios” is a simple and effective way to compare the use of words in a given text with an entire corpus. Such has been implemented in Freebo@ND using a set of words called the “great ideas”. [8] There is also a way to create one’s own sub-collection for analysis, but the functionality is meager. [9]
I have had to learn a lot to get this far, and I have had to use a myriad of technologies. Some of these things include: getting along sans a fully normalized database, parallel processing & cluster computing, “map & reduce”, responsive Web page design, etc. This being the initial blog posting documenting the why’s & wherefore’s of Freebo@ND, more postings ought to be coming; I hope to document here more thoroughly my part in our Project. Thank you for listening.
[1] Freebo@ND – http://cds.crc.nd.edu/
[2] Text Creation Partnership (TCP) – http://www.textcreationpartnership.org
[3] The Phase I TCP texts are “best” gotten from GitHub – https://github.com/textcreationpartnership
[4] use & understanding – http://infomotions.com/blog/2011/09/dpla/
[5] local collection & archive – http://cds.crc.nd.edu/freebo/
[6] search – http://cds.crc.nd.edu/cgi-bin/search.cgi
[7] tabled search results – http://cds.crc.nd.edu/cgi-bin/did2catalog.cgi
[8] log-likelihood ratios – http://cds.crc.nd.edu/cgi-bin/likelihood.cgi
[9] sub-collections – http://cds.crc.nd.edu/cgi-bin/request-collection.cgi
2017-07-24T18:58:13+00:00 Life of a Librarian: tei2json: Summarizing the structure of Early English poetry and prose http://sites.nd.edu/emorgan/2017/01/tei2json/This posting describes a hack of mine, tei2json.pl – a Perl program to summarize the structure of Early English poetry and prose. [0]
In collaboration with Northwestern University and Washington University, the University of Notre Dame is working on a project whose primary purpose is to correct (“annotate”) the Early English corpus created by the Text Creation Partnership (TCP). My role in the project is to do interesting things with the corpus once it has been corrected. One of those things is the creation of metdata files denoting the structure of each item in the corpus.
Some of my work is really an effort to reverse engineer good work done by the late Sebastian Rahtz. For example, Mr. Rahtz cached a version of the TCP corpus, transformed each item into a number of different formats, and put the whole thing on GitHub. [1] As a part of this project, he created metadata files enumerating what TEI elements were in each file and what attributes were associated with each element. The result was an HTML display allowing the reader to quickly see how many bibliographies an item may have, what languages may be present, how long the document was measured in page breaks, etc. One of my goals is/was to do something very similar.
The workings of the script are really very simple: 1) configure and denote what elements to count & tabulate, 2) loop through each configuration, 3) keep a running total of the result, 4) convert the result to JSON (a specific data format), and 5) save the result to a file. Here are (temporary) links to a few examples:
JSON files are not really very useful in & of themselves; JSON files are designed to be transport mechanisms allowing other applications to read and process them. This is exactly what I did. In fact, I created two different applications: 1) json2table.pl and 2) json2tsv.pl. [2, 3] The former script takes a JSON file and creates a HTML file whose appearance is very similar to Rahtz’s. Using the JSON files (above) the following HTML files have been created through the use of json2table.pl:
The second script (json2tsv.pl) allows the reader to compare & contrast structural elements between items. Json2tsv.pl reads many JSON files and outputs a matrix of values. This matrix is a delimited file suitable for analysis in spreadsheets, database applications, statistical analysis tools (such as R or SPSS), or programming languages libraries (such as Python’s numpy or Perl’s PDL). In its present configuration, the json2tsv.pl outputs a matrix looking like this:
id      bibl  figure  l     lg   note  p    q
A00002  3     4       4118  490  8     18   3
A00011  3     0       2     0    47    68   6
A00089  0     0       0     0    0     65   0
A00214  0     0       0     0    151   131  0
A00289  0     0       0     0    41    286  0
A00293  0     1       189   38   0     2    0
A00395  2     0       0     0    0     160  2
A00749  0     4       120   18   0     0    2
A00926  0     0       124   12   0     31   7
A00959  0     0       2633  9    0     4    0
A00966  0     0       2656  0    0     17   0
A00967  0     0       2450  0    0     3    0
Given such a file, the reader could then ask & answer questions such as:
Additional examples of input & output files are temporarily available online. [4]
My next steps include at least a couple of things. One, I need/want to evaluate whether or not save my counts & tabulations in a database before (or after) creating the JSON files. The data may be prove to be useful there. Two, as a librarian, I want to go beyond qualitative description of narrative texts, and the counting & tabulating of structural elements moves in that direction, but it does not really address the “aboutness”, “meaning”, nor “allusions” found in a corpus. Sure, librarians have applied controlled vocabularies and bits of genre to metadata descriptions, but such things are not quantitive and consequently allude statistical analysis. For example, using sentiment analysis one could measure and calculate the “lovingness”, “war mongering”, “artisticness”, or “philosophic nature” of the texts. One could count & tabulate the number of times family-related terms are used, assign the result a score, and record the score. One could then amass all documents and sort them by how much they discussed family, love, philosophy, etc. Such is on my mind, and more than half-way baked. Wish me luck.
This posting describes a little hack of mine, Synonymizer — a Python-based CGI script to create a synonym files suitable for use with Solr and other applications. [0]
Human language is ambiguous, and computers are rather stupid. Consequently computers often need to be explicitly told what to do (and how to do it). Solr is a good example. I might tell Solr to find all documents about dogs, and it will dutifully go off and look for things containing d-o-g-s. Solr might think it is smart by looking for d-o-g as well, but such is a heuristic, not necessarily a real understanding of the problem at hand. I might say, “Find all documents about dogs”, but I might really mean, “What is a dog, and can you give me some examples?” In which case, it might be better for Solr to search for documents containing d-o-g, h-o-u-n-d, w-o-l-f, c-a-n-i-n-e, etc.
This is where Solr synonym files come in handy. There are one or two flavors of Solr synonym files, and the one created by my Synonymizer is a simple line-delimited list of concepts, and each line is a comma-separated list of words or phrases. For example, the following is a simple Solr synonym file denoting four concepts (beauty, honor, love, and truth):
  beauty, appearance, attractiveness, beaut
  honor, abide by, accept, celebrate, celebrity
  love, adoration, adore, agape, agape love, amorousness
  truth, accuracy, actuality, exactitude
Creating a Solr synonym file is not really difficult, but it can be tedious, and the human brain is not always very good at multiplying ideas. This is where computers come in. Computers do tedium very well. And with the help of a thesaurus (like WordNet), multiplying ideas is easier.
Here is how Synonymizer works. First it reads a configured database of previously generated synonyms.† In the beginning, this file is empty but must be readable and writable by the HTTP server. Second, Synonymizer reads the database and offers the reader to: 1) create a new set of synonyms, 2) edit an existing synonym, or 3) generate a synonym file. If Option #1 is chosen, then input is garnered, and looked up in WordNet. The script will then enable the reader to disambiguate the input through the selection of apropos definitions. Upon selection, both WordNet hyponyms and hypernyms will be returned. The reader then has the opportunity to select desired words/phrase as well as enter any of their own design. The result is saved to the database. The process is similar if the reader chooses Option #2. If Option #3 is chosen, then the database is read, reformatted, and output to the screen as a stream of text to be used on Solr or something else that may require similar functionality. Because Option #3 is generated with a single URL, it is possible to programmatically incorporate the synonyms into your Solr indexing process pipeline.
The Synonymizer is not perfect.‡ For example, it only creates one of the two different types of Solr synonym files. Second, while Solr can use the generated synonym file, search results implement phrase searches poorly, and this is well-know issue. [1] Third, editing existing synonyms does not really take advantage of previously selected items; data-entry is tedious but not as tedious as writing the synonym file by hand. Forth, the script is not fast, and I blame this on Python and WordNet.
Below are a couple of screenshots from the application. Use and enjoy.
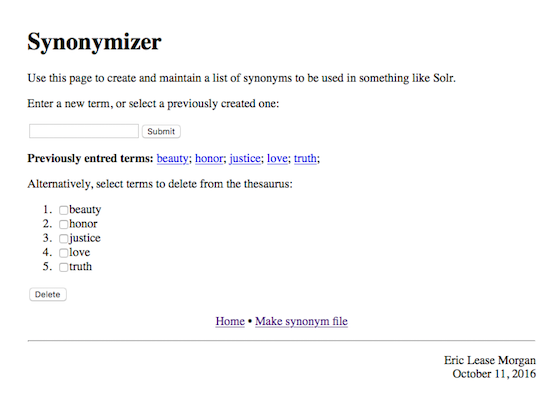
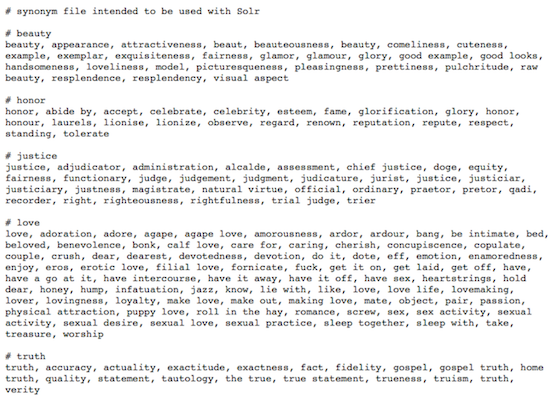
[0] synonymizer.py – http://dh.crc.nd.edu/sandbox/synonymizer/synonymizer.py
[1] “Why is Multi-term synonym mapping so hard in Solr?” – http://bit.ly/2iyYZw6
† The “database” is really simple delimited text file. No database management system required.
‡ Software is never done. If it were, then it would be called “hardware”.
2017-01-16T23:03:59+00:00 Life of a Librarian: Tiny road trip: An Americana travelogue http://sites.nd.edu/emorgan/2016/10/americana/This travelogue documents my experiences and what I learned on a tiny road trip including visits to Indiana University, Purdue University, University of Illinois / Urbana-Champagne, and Washington University In St. Louis between Monday, October 26 and Friday, October 30, 2017. In short, I learned four things: 1) of the places I visited, digital scholarship centers support a predictable set of services, 2) the University Of Notre Dame’s digital scholarship center is perfectly situated in the middle of the road when it comes to the services provided, 3) the Early Print Project is teamed with a set of enthusiastic & animated scholars, and 4) Illinois is very flat.


Four months ago I returned from a pseudo-sabbatical of two academic semesters, and exactly one year ago I was in Tuscany (Italy) painting cornfields & rolling hills. Upon my return I felt a bit out of touch with some of my colleagues in other libraries. At the same time I had been given an opportunity to participate in a grant-sponsored activity (the Early English Print Project) between Northwestern University, Washington University In St. Louis, and the University Of Notre Dame. Since I was encouraged to visit the good folks at Washington University, I decided to stretch a two-day visit into a week-long road trip taking in stops at digital scholarship centers. Consequently, I spent bits of time in Bloomington (Indiana), West Lafayette (Indiana), Urbana (Illinois), as well as St. Louis (Missouri). The whole process afforded me the opportunity to learn more and get re-acquainted.
My first stop was in Bloomington where I visited Indiana University, and the first thing that struck me was how much Bloomington exemplified the typical college town. Coffee shops. Boutique clothing stores. Ethnic restaurants. And teaming with students ranging from fraternity & sorority types, hippie wanna be’s, nerds, wide-eyed freshman, young lovers, and yes, fledgling scholars. The energy was positively invigorating.
My first professional visit was with Angela Courtney (Head of Arts & Humanities, Head of Reference Services, Librarian for English & American Literature, and Director of the Scholars’ Commons). Ms. Courtney gave me a tour of the library’s newly renovated digital scholarship center. [1] It was about the same size at the Hesburgh Libraries’s Center, and it was equipped with much of the same apparatus. There was a scanning lab, plenty of larger & smaller meeting spaces, a video wall, and lots of open seating. One major difference between Indiana and Notre Dame was the “reference desk”. For all intents & purposes, the Indiana University reference desk is situated in the digital scholarship center. Ms. Courtney & I chatted for a long hour, and I learned how Indiana University & the University Of Notre Dame were similar & different. Numbers of students. Types of library collections & services. Digital initiatives. For the most part, both universities have more things in common than differences, but their digital initiatives were by far more mature than the ones here at Notre Dame.
Later in the afternoon I visited with Yu (Marie) Ma who works for the HathiTrust Research Center. [2] She was relatively new to the HathiTrust, and if I understand her position correctly, then she spends a lot of her time setting up technical workflows and the designing the infrastructure for large-scale text analysis. The hour with Marie was informative on both of our parts. For example, I outlined some of the usability issues with the Center’s interface(s), and she outlined how the “data capsules” work. More specifically, “data capsules” are virtual machines operating in two different modes. In one mode a researcher is enabled to fill up a file system with HathiTrust content. In the other mode, one is enabled to compute against the content and return results. In one or the other of the modes (I’m not sure which), Internet connectivity is turned off to disable the leaking of HathiTrust content. In this way, a HathiTrust data capsule operates much like a traditional special collections room. A person can go into the space, see the book, take notes with a paper & pencil, and then leave sans any of the original materials. “What is old is new again.” Along the way Marie showed me a website — Lapps Grid — which looks as if it functions similar to Voyant Tools and my fledgling EEBO-TCP Workset Browser. [3, 4, 5] Amass a collection. Use the collection as input against many natural language processing tools/applications. Use the output as a means for understanding. I will take a closer look at Lapps Grid.
The next morning I left the rolling hills of southern Indiana for the flatlands of central Indiana and Purdue University. There I facilitated a brown-bag lunch discussion on the topic of scalable reading, but the audience seemed more interested in the concept of digital scholarship centers. I described the Center here at Notre Dame, and did my best to compare & contrast it with others as well as draw into the discussion the definition of digital humanities. Afterwards I went to lunch with Micheal Witt and Amanda Visconti. Mr. Witt spends much of his time on institutional repostory efforts, specifically in regards to scientific data. Ms. Visconti works in the realm of the digital humanities and has recently made available her very interesting interactive dissertation — Infinite Ulysses. [6] After lunch Mr. Witt showed me a new library space scheduled to open before the Fall Semester of 2017. The space will be library-esque during the day, and study-esque during the evening. Through the process of construction, some of their collection needed to be weeded, and I found the weeding process to be very interesting.
Up again in the morning and a drive to Urbana-Champagne. During this jaunt I became both a ninny and a slave to my computer’s (telephone’s) navigation and functionality. First it directed me to my location, but no parking places. After identifying a parking place on my map (computer), I was not able to get directions on how to get there. Once I finally found parking, I required my telephone to pay. Connect to remote site while located in concrete building. Create account. Supply credit card number. Etc. We are increasingly reliant (dependent) on these gizmos.
My first meeting was with Karen Hogenboom (Associate Professor of Library Administration, Scholarly Commons Librarian and Head, Scholarly Commons). We too discussed digital scholarship centers, and again, there were more things in common with our centers than differences. Her space was a bit smaller than Notre Dame’s, and their space was less about specific services and more about referrals to other services across the library and across the campus. For example, geographic information systems services and digitization services were offered elsewhere.
I then had a date with an old book, but first some back story. Here at Notre Dame Julia Schneider brought to my attention a work written by Erasmus and commenting on Cato which may be a part of a project called The Digital Schoolbook. She told me how there were only three copies of this particular book, and one of them was located in Urbana. Consequently, a long month ago, I found a reference to the book in the library catalog, and I made an appointment to see it in person. The book’s title is Erasmi Roterodami libellus de co[n]structio[n]e octo partiu[m]oratio[n]is ex Britannia nup[er] huc plat[us] : et ex eo pureri bonis in l[ite]ris optio and it was written/published in 1514. [7, 8] The book represented at least a few things: 1) the continued and on-going commentary on Cato, 2) an example of early book printing, and 3) forms of scholarship. Regarding Cato I was only able to read a single word in the entire volume — the word “Cato” — because the whole thing was written in Latin. As an early printed book, I had to page through the entire volume to find the book I wanted. It was the last one. Third, the book was riddled with annotations, made from a number of hands, and with very fine-pointed pens. Again, I could not read a single word, but a number of the annotations were literally drawings of hands pointing to sections of interest. Whoever said writing in books was a bad thing? In this case, the annotations were a definite part of the scholarship.

Yet again, I woke up the next morning and continued on my way. Along the road there were billboards touting “foot-high pies” and attractions to Indian burial grounds. There were corn fields being harvested, and many advertisements pointing to Abraham Lincoln stomping locations.
Late that afternoon I was invited to participate in a discussion with Doug Knox, Steve Pentecost, Steven Miles, and Dr. Miles’s graduate students. (Mr. Knox & Mr. Pentecost work in a university space called Arts & Sciences Computing.) They outlined and reported upon a digital project designed to aid researchers & scholars learn about stelae found along the West River Basin in China. I listened. (“Stelae” are markers, usually made of stone, commemorating the construction or re-construction of religious temples.) To implement the project, TEI/XML files were being written and “en masse” used akin to a database application. Reports were to be written agains the XML to create digital maps as well as browsable lists of names of people, names of temples, dates, etc. I got to thinking how timelines might also be apropos.
The bulk of the following day (Friday) was spent getting to know a balance of colleagues and discussing the Early English Print Project. There were many people in the room: Doug Knox & Steve Pentecost from the previous day, Joesph Loewenstein (Professor, Department of English, Director Of the Humanities Digital Workshop and the Interdisciplinary Project in the Humanities) Kate Needham, Andrew Rouner (Digital Library Director), Anupam Basu (Assistant Professor, Department of English), Shannon Davis (Digital Library Services Manager), Keegan Hughes, and myself.
More specifically, we talked about how sets of EEBO/TCP ([9]) TEI/XML files can be: 1) corrected, enhanced, & annotated through both automation as well as crowd-sourcing, 2) supplemented & combined with newly minted & copy-right free facsimiles from the original printed documents, 3) analyzed & reported upon through text mining & general natural language processing techniques, and 4) packaged up & redistributed back to the scholarly community. While the discussion did not follow logically, it did surround a number of unspoken questions, such as but not limited to:
To my mind, none of these questions were answered definitively, but then again, it was an academic discussion. On the other hand, we did walk away with a tangible deliverable — a whiteboard drawing illustrating a possible workflow going something like this:
After driving through the country side, and after two weeks of reflection, I advocate a slightly different workflow:
The primary point I’d like to make in regard to this workflow is, “The re-distribution of our efforts ought to take place over simple HTTP and in the form of standardized XML, and I do not advocate the use of any sort of middle-ware application for these purposes.” Yes, of course, middle-ware will be used to correct the TEI, create “digital combos” of TEI and images, and do textual analysis, but the output of these processes ought to be files accessible via plain o’ ordinary HTTP. Applications (database systems, operating systems, content-management systems, etc.) require maintenance, and maintenance is done by a few & specialized number of people. Applications are often times “black boxes” understood and operated by a minority. Such things are very fragile, especially compared to stand-alone files. Standardized (XML) files served over HTTP are easily harvestable by anybody. They are easily duplicated. They can be saved on platform-independent media such as CD’s/DVD’s, magnetic tape, or even (gasp) paper. Once the results of our efforts are output as files, then supplementary distribution mechanisms can be put into place, such as IIIF or middleware database applications. XML files (TEI and/or METS) served over simple HTTP ought be the primary distribution mechanism. Such is transparent, sustainable, and system-independent.
Over lunch we discussed Spenser’s Faerie Queene, the Washington University’s Humanities Digital Workshop, and the salient characteristics of digital humanities work. [13] In the afternoon I visited the St. Louis Art Museum, whose collection was rich. [14] The next day, on my way home through Illinois, I stopped at the tomb of Abraham Lincoln in order to pay my respects.

In conclusion, I learned a lot, and I believe my Americana road trip was a success. My conception and defintion of digital scholarship centers was re-enforced. My professional network was strengthened. I worked collaboratively with colleagues striving towards a shared goal. And my personal self was enriched. I advocate such road trips for anybody and everybody.
[1] digital scholarship at Indiana University – https://libraries.indiana.edu/services/digital-scholarship
[2] HathiTrust Research Center – https://analytics.hathitrust.org
[3] Lapps Grid – http://www.lappsgrid.org
[4] Voyant Tools – http://voyant-tools.org
[5] EEBO-TCP Workset Browser – http://blogs.nd.edu/emorgan/2015/06/eebo-browser/
[6] Infinite Ulysses – http://www.infiniteulysses.com
[7] old book from the UIUC catalog – https://vufind.carli.illinois.edu/vf-uiu/Record/uiu_5502849
[8] old book from the Universal Short Title Catalogue – http://ustc.ac.uk/index.php/record/403362
[9] EEBO/TCP – http://www.textcreationpartnership.org/tcp-eebo/
[10] METS – http://www.loc.gov/standards/mets/
[11] IIIF – http://iiif.io
[12] GitHub repository of texts – https://github.com/textcreationpartnership/Texts
[13] Humanities Digital Workshop – https://hdw.artsci.wustl.edu
[14] St. Louis Art Museum – http://www.slam.org
This posting elaborates upon one possible blueprint for comparing & contrasting various positions in the realm of Catholic social thought and human rights.
We here in the Center For Digital Scholarship have been presented with a corpus of documents which can be broadly described as position papers on Catholic social thought and human rights. Some of these documents come from the Vatican, and some of these documents come from various governmental agencies. There is a desire by researchers & scholars to compare & contrast these documents on the paragraph level. The blueprint presented below illustrates one way — a system/flowchart — this desire may be addressed:
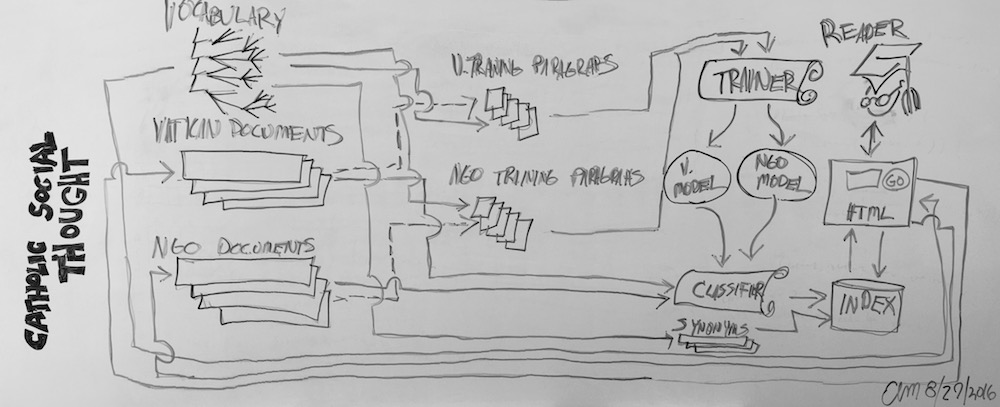
The following list enumerates the flow of the system:
The text above only outlines one possible “blueprint” for comparing & contrasting a corpus of Catholic social thought and human rights. Moreover, there are at least two other ways of addressing the issue. For example, it it entirely possible to “simply” read each & every document. After all, that is they way things have been done for millennium. Another possible solution is to apply natural language processing techniques to the corpus as a whole. For example, one could automatically count & tabulate the most frequently used words & phrases to identify themes. One could compare the rise & fall of these themes over time, geographic location, author, or publisher. The same thing can be done in a more refined way using parts-of-speech analysis. Along these same lines there are well-understood relevancy ranking algorithms (such as term frequency / inverse frequency) allowing a computer to output the more statistically significant themes. Finally, documents could be compared & contrasted automatically through a sort of geometric analysis in an abstract and multi-dimensional “space”. These additional techniques are considerations for a phase two of the project, if it ever comes to pass.
2016-08-30T01:32:19+00:00 Life of a Librarian: How not to work during a sabbatical http://sites.nd.edu/emorgan/2016/07/adjunct-status/This presentation — given at Code4Lib Midwest (Chicago, July 14, 2016) — outlines the various software systems I wrote during my recent tenure as an adjunct faculty member at the University of Notre Dame. (This presentation is also available as a one-page PDF handout designed to be duplex printed and folded in half as if it were a booklet.)
 How rare is rare? – In an effort to determine the “rarity” of items in the Catholic Portal, I programmatically searched WorldCat for specific items, counted the number of times it was held by libraries in the United States, and recorded the list of the holding libraries. Through the process I learned that most of the items in the Catholic Portal are “rare”, but I also learned that “rarity” can be defined as the triangulation of scarcity, demand, and value. Thus the “rare” things may not be rare at all.
My tenure as an adjunct faculty member was very much akin to a one year education except for a fifty-five year old. I did many of the things college students do: go to class, attend sporting events, go on road trips, make friends, go to parties, go home for the holidays, write papers, give oral presentations, eat too much, drink too much, etc. Besides the software systems outlined above, I gave four or five professional presentations, attend & helped coordinate five or six professional meetings, taught an online, semester-long, graduate-level class of on the topic of XML, took many different classes (painting, sketching, dance, & language) many times, lived many months in Chicago, Philadelphia, and Rome, visited more than two dozen European cities, painted about fifty paintings, bound & filled about two dozen hand-made books, and took about three thousand photographs. The only thing I didn’t do is take tests.
2016-07-19T19:43:16+00:00 Mini-musings: Achieving perfection http://infomotions.com/blog/2016/06/levenshtein/Through the use of the Levenshtein algorithm, I am achieving perfection when it comes to searching VIAF. Well, almost.
 I am making significant progress with VIAF Finder [0], but now I have exploited the use of the Levenshtein algorithm. In fact, I believe I am now able to programmatically choose VIAF identifiers for more than 50 or 60 percent of the authority records.
The Levenshtein algorithm measures the “distance” between two strings. [1] This distance is really the number of keystrokes necessary to change one string into another. For example, the distance between “eric” and “erik” is 1. Similarly the distance between “Stefano B” and “Stefano B.” is still 1. Along with a colleague (Stefano Bargioni), I took a long, hard look at the source code of an OpenRefine reconciliation service which uses VIAF as the backend database. [2] The code included the calculation of a ratio to denote the relative distance of two strings. This ratio is the quotient of the longest string minus the Levenshtein distance divided by the length of the longest string. From the first example, the distance is 1 and the length of the string “eric” is 4, thus the ratio is (4 – 1) / 4, which equals 0.75. In other words, 75% of the characters are correct. In the second example, “Stefano B.” is 10 characters long, and thus the ratio is (10 – 1) / 10, which equals 0.9. In other words, the second example is more correct than the first example.
Using the value of MARC 1xx$a of an authority file, I can then query VIAF. The SRU interface returns 0 or more hits. I can then compare my search string with the search results to create a ranked list of choices. Based on this ranking, I am able to more intelligently choose VIAF identifiers. For example, from my debugging output, if I get 0 hits, then I do nothing:
       query: Lucariello, Donato
        hits: 0
If I get too many hits, then I still do nothing:
       query: Lucas Lucas, Ramón
        hits: 18
     warning: search results out of bounds; consider increasing MAX
If I get 1 hit, then I automatically save the result, which seems to be correct/accurate most of the time, even though the Levenshtein distance may be large:
       query: Lucaites, John Louis
        hits: 1
       score: 0.250     John Lucaites (57801579)
      action: perfection achieved (updated name and id)
If I get many hits, and one of them exactly matches my query, then I “achieved perfection” and I save the identifier:
       query: Lucas, John Randolph
        hits: 3
       score: 1.000     Lucas, John Randolph (248129560)
       score: 0.650     Lucas, John R. 1929- (98019197)
       score: 0.500     Lucas, J. R. 1929- (2610145857009722920913)
      action: perfection achieved (updated name and id)
If I get many hits, and many of them are exact matches, then I simply use the first one (even though it might not be the “best” one):
       query: Lucifer Calaritanus
        hits: 5
       score: 1.000     Lucifer Calaritanus (189238587)
       score: 1.000     Lucifer Calaritanus (187743694)
       score: 0.633     Luciferus Calaritanus -ca. 370 (1570145857019022921123)
       score: 0.514     Lucifer Calaritanus gest. 370 n. Chr. (798145857991023021603)
       score: 0.417     Lucifer, Bp. of Cagliari, d. ca. 370 (64799542)
      action: perfection achieved (updated name and id)
If I get many hits, and none of them are perfect, but the ratio is above a configured threshold (0.949), then that is good enough for me (even if the selected record is not the “best” one):
       query: Palanque, Jean-Remy
        hits: 5
       score: 0.950     Palanque, Jean-Rémy (106963448)
       score: 0.692     Palanque, Jean-Rémy, 1898- (46765569)
       score: 0.667     Palanque, Jean Rémy, 1898- (165029580)
       score: 0.514     Palanque, J. R. (Jean-Rémy), n. 1898 (316408095)
       score: 0.190     Marrou-Davenson, Henri-Irénée, 1904-1977 (2473942)
      action: perfection achieved (updated name and id)
By exploiting the Levenshtein algorithm, and by learning from the good work of others, I have been able to programmatically select VIAF identifiers for more than half of my authority records. When one has as many as 120,000 records to process, this is a good thing. Moreover, this use of the Levenshtein algorithm seems to produce more complete results when compared to the VIAF AutoSuggest API. AutoSuggest identified approximately 20 percent of my VIAF identifiers, while my Levenshtein algorithm/logic identifies more than 40 or 50 percent. AutoSuggest is much faster though. Much.
Fun with the intelligent use of computers, and think of the possibilities.
[0] VIAF Finder – http://infomotions.com/blog/2016/05/viaf-finder/
[1] Levenshtein – http://bit.ly/1Wz3qZC
[2] reconciliation service – https://github.com/codeforkjeff/refine_viaf
2016-06-03T09:48:09+00:00 Mini-musings: VIAF Finder http://infomotions.com/blog/2016/05/viaf-finder/This posting describes VIAF Finder. In short, given the values from MARC fields 1xx$a, VIAF Finder will try to find and record a VIAF identifier. [0] This identifier, in turn, can be used to facilitate linked data services against authority and bibliographic data.
Here is the way to quickly get started:
VIAF Finder will then commence to:
Once done the reader is expected to programmatically loop through ./etc/authority.db to update the 024 fields of their MARC authority data.
Here is a listing of the VIAF Finder distribution:
If the reader hasn’t figured it out already, in order to use VIAF Finder, the Unix-ish computer needs to have Perl and various Perl modules — most notably, MARC::Batch — installed.
If the reader puts a file named authority.mrc in the ./etc directory, and then runs ./bin/build.sh, then the system ought to run as expected. A set of 100,000 records over a wireless network connection will finish processing in a matter of many hours, if not the better part of a day. Speed will be increased over a wired network, obviously.
But in reality, most people will not want to run the system out of the box. Instead, each of the individual tools will need to be run individually. Here’s how:
A word of caution is now in order. VIAF Finder reads & writes to its local database. To do so it slurps up the whole thing into RAM, updates things as processing continues, and periodically dumps the whole thing just in case things go awry. Consequently, if you want to terminate the program prematurely, try to do so a few steps after the value of “count” has reached the maximum (500 by default). A few times I have prematurely quit the application at the wrong time and blew my whole database away. This is the cost of having a “simple” database implementation.
Alas, search-simple.pl contains a memory leak. Search-simple.pl makes use of the SRU interface to VIAF, and my SRU queries return XML results. Search-simple.pl then uses the venerable XML::XPath Perl module to read the results. Well, after a few hundred queries the totality of my computer’s RAM is taken up, and the script fails. One work-around would be to request the SRU interface to return a different data structure. Another solution is to figure out how to destroy the XML::XPath object. Incidentally, because of this memory leak, the integer fed to simple-search.pl was implemented allowing the reader to restart the process at a different point dataset. Hacky.
The use of the database is key to the implementation of this system, and the database is really a simple tab-delimited table with the following columns:
Most of the fields will be empty, especially fields b through x. The intention is/was to use these fields to enhance or limit SRU queries. Field #13 (suggestions) is for future, possible use. Field #14 is key, literally. Field #15 is a possible replacement for MARC 1xx$a. Field #15 can also be used as a sort of sanity check against the search results. “Did VIAF Finder really identify the correct record?”
Consider pouring the database into your favorite text editor, spreadsheet, database, or statistical analysis application for further investigation. For example, write a report against the database allowing the reader to see the details of the local authority record as well as the authority data in VIAF. Alternatively, open the database in OpenRefine in order to count & tabulate variations of data it contains. [4] Your eyes will widened, I assure you.
 First, this system was written during my “artist’s education adventure” which included a three-month stint in Rome. More specifically, this system was written for the good folks at Pontificia Università della Santa Croce. “Thank you, Stefano Bargioni, for the opportunity, and we did some very good collaborative work.”
Second, I first wrote search-simple.pl (SRU interface) and I was able to find VIAF identifiers for about 20% of my given authority records. I then enhanced search-simple.pl to include limitations to specific authority sets. I then wrote search-suggest.pl (AutoSuggest interface), and not only was the result many times faster, but the result was just as good, if not better, than the previous result. This felt like two steps forward and one step back. Consequently, the reader may not ever need nor want to run search-simple.pl.
Third, while the AutoSuggest interface was much faster, I was not able to determine how suggestions were made. This makes the AutoSuggest interface seem a bit like a “black box”. One of my next steps, during the copious spare time I still have here in Rome, is to investigate how to make my scripts smarter. Specifically, I hope to exploit the use of the Levenshtein distance algorithm. [5]
Finally, I would not have been able to do this work without the “shoulders of giants”. Specifically, Stefano and I took long & hard looks at the code of people who have done similar things. For example, the source code of Jeff Chiu’s OpenRefine Reconciliation service demonstrates how to use the Levenshtein distance algorithm. [6] And we found Jakob Voß’s viaflookup.pl useful for pointing out AutoSuggest as well as elegant ways of submitting URL’s to remote HTTP servers. [7] “Thanks, guys!”
Fun with MARC-based authority data!
[0] VIAF – http://viaf.org
[1] VIAF Finder distribution – http://infomotions.com/sandbox/pusc/etc/viaf-finder.tar.gz
[2] VIAF API – http://www.oclc.org/developer/develop/web-services/viaf.en.html
[4] OpenRefine – http://openrefine.org
[5] Levenshtein distance – https://en.wikibooks.org/wiki/Algorithm_Implementation/Strings/Levenshtein_distance
[6] Chiu’s reconciliation service – https://github.com/codeforkjeff/refine_viaf
[7] Voß’s viaflookup.pl – https://gist.github.com/nichtich/832052/3274497bfc4ae6612d0c49671ae636960aaa40d2
2016-05-27T13:34:13+00:00 Mini-musings: Making stone soup: Working together for the advancement of learning and teaching http://infomotions.com/blog/2016/05/stone-soup/It is simply not possible for any of us to do our jobs well without the collaboration of others. Yet specialization abounds, jargon proliferates, and professional silos are everywhere. At the same time we all have a shared goal: to advance learning and teaching. How are we to balance these two seemingly conflicting characteristics in our workplace? How can we satisfy the demands of our day-to-day jobs and at the same time contribute to the work of others? ‡


The answer is not technical but instead rooted in what it means to a part of a holistic group of people. The answer is rooted in things like the abilities to listen, to share, to learn, to go beyond tolerance and towards respect, to take a sincere interest in the other person’s point of view, to discuss, and to take to heart the idea that nobody really sees the whole picture.
As people — members of the human race — we form communities with both our strengths & our weaknesses, with things we know would benefit the group & things we would rather not share, with both our beauties and our blemishes. This is part of what it means to be people. There is no denying it, and if we try, then we are only being less of who we really are. To deny it is an unrealistic expectation. We are not gods. We are not actors. We are people, and being people — real people — is a good thing.
Within any community, there are norms of behavior. Without norms of behavior, there is really no community, only chaos and anarchy. In anarchy and chaos, physical strength is oftentimes the defining characteristic of decision-making, but when the physically strong are outnumbered by the emotionally mature and intellectually aware, then chaos and anarchy are overthrown for a more holistic set of decision-making proceses. Examples include democracy, consensus building, and even the possibility governance through benevolent dictatorship.
A community’s norms are both written and unwritten. Our workplaces are good examples of such communities. On one hand there may be policies & procedures, but these policies & procedures usually describe workflows, the methods used to evaluate employees, or to some extent strategic plans. They might outline how meetings are conducted or how teams are to accomplish their goals. On the other hand, these policies & procedures do not necessarily outline how to talk with fellow employees around the virtual water cooler, how to write email messages, nor how to greet each on a day-to-day basis. Just as importantly, our written norms of behavior do not describe how to treat and communicate with people outside one’s own set of personal expertise. Don’t get me wrong. This does not mean I am advocating written norms for such things, but such things do need to be discussed and agreed upon. Such are the beginnings of stone soup.
Increasingly we seem to work in disciplines of specialization, and these specializations, necessarily, generate their own jargon. “Where have all the generalists gone? Considering our current environment, is it really impossible to be a Renaissance Man^h^h^h Person?” Increasingly, the answer to the first question is, “The generalists have gone the way of Leonardo DiVinci.” And the answer to the second question is, “Apparently so.”
For example, some of us lean more towards formal learning, teaching, research, and scholarship. These are the people who have thoroughly studied and now teach a particular academic discipline. These same people have written dissertations, which, almost by defintion, are very specialized, if not unique. They live in a world pursuant of truth while balancing the worlds of rigorous scholarly publishing and student counseling.
There are those among us who thoroughly know the in’s and out’s of computer technology. These people can enumerate the differences between a word processor and a text editor. They can compare & contrast operating systems. These people can configure & upgrade software. They can make computers communicate on the Internet. They can trouble-shoot computer problems when the computers seem — for no apparent reason — to just break.
Finally, there are those among us who specialize in the collection, organization, preservation, and dissemination of data, information, and knowledge. These people identify bodies of content, systematically describe it, make every effort to preserve it for posterity, and share it with their respective communities. These people deal with MARC records, authority lists, and subject headings.
Despite these truisms, we — our communities — need to figure out how to work together, how to bridge the gaps in our knowledge (a consequence of specialization), and how to achieve our shared goals. This is an aspect of our metaphoric stone soup.
So now the problem can be re-articulated. We live and work in communities of unwritten and poorly articulated norms. To complicate matters, because of our specializations, we all approach our situations from different perspectives and use different languages to deal with the situations. As I was discussing this presentation with a dear friend & colleague, the following poem attributed to Prissy Galagarian was brought to my attention†, and it eloquently states the imperative:
  The Person Next to You

  The person next to you is the greatest miracle
   and the greatest mystery you will ever
   meet at this moment.

  The person next to you is an inexhaustible
   reservoir of possibility,
   desire and dread,
   smiles and frowns, laughter and tears,
   fears and hopes,
   all struggling to find expression.

  The person next to you believes in something,
   stands for something, counts for something,
   lives for something, labors for something,
   waits for something, runs from something,
   runs to something.

  The person next to you has problems and fears,
   wonders how they're doing,
   is often undecided and unorganized
   and painfully close to chaos!
   Do they dare speak of it to you?

  The person next to you can live with you
   not just alongside you,
   not just next to you.

  The person next to you is a part of you.
   for you are the person next to them.
How do we overcome these impediments in order to achieve our mutual goals of the workplace? The root of the answer lies in our ability to really & truly respect our fellow employees.
Working together towards a shared goals is a whole lot like making “stone soup”. Do you know the story of “stone soup”? A man comes into a village, and asks the villagers for food. Every time he asks he is told that there is nothing to give. Despite an apparent lack of anything, the man sets up a little fire, puts a pot of water on, and drops a stone into the pot. Curious people come by, and they ask, “What are you doing?” He says, “I’m making stone soup, but I think it needs a bit of flavor.” Wanting to participate, people begin to add their own things to the soup. “I think I have some carrots,” says one villager. “I believe I have a bit of celery,” says another. Soon the pot is filled with bits of this and that and the other thing: onions, salt & pepper, a beef bone, a few tomatoes, a couple of potatoes, etc. In the end, a rich & hearty stew is made, enough for everybody to enjoy. Working together, without judgement nor selfishness, the end result is a goal well-accomplished.
This can happen in the workplace as well. It can happen in our community where the goal is teaching & learning. And in the spirit of cooking, here’s a sort of recipe:
Finally, making stone soup does not require fancy tools. A cast iron pot will work just as well as one made from aluminium or teflon. What is needed is a container large enough to hold the ingredients and withstand the heat. It doesn’t matter whether or not the heat source is gas, electric, or fire. It just has to be hot enough to allow boiling and then simmering. Similarly, stone soup in the workplace does not require Google Drive, Microsoft Office 365, nor any type of wiki. Sure, those things can facilitate project work, but they are not the means for getting to know your colleagues. Only through personal interaction will such knowledge be garnered.
Working together for the advancement of learning & teaching — or just about any other type of project work — is a lot like making stone soup. Everybody contributes a little something, and the result is nourishing meal for all.
‡ This essay was written as a presentation for the AMICAL annual conference which took place in Rome (May 12-14, 2016), and this essay is available as a one-page handout.
† http://fraternalthoughts.blogspot.it/2011/02/person-next-to-you.html
2016-05-09T12:26:41+00:00 Mini-musings: Protected: Simile Timeline test http://infomotions.com/blog/2016/04/simile-timeline-test/ 2016-04-14T20:02:27+00:00 Mini-musings: Editing authorities at the speed of four records per minute http://infomotions.com/blog/2016/04/editing-authorities/This missive outlines and documents an automated process I used to “cleanup” and “improve” a set of authority records, or, to put it another way, how I edited authorities at the speed of four records per minute.
 As you may or may not know, starting in September 2015, I commenced upon a sort of “leave of absence” from my employer.† This leave took me to Tuscany, Venice, Rome, Provence, Chicago, Philadelphia, Boston, New York City, and back to Rome. In Rome I worked for the American Academy of Rome doing short-term projects in the library. The first project revolved around authority records. More specifically, the library’s primary clientele were Americans, but the catalog’s authority records included a smattering of Italian headings. The goal of the project was to automatically convert as many of the “invalid” Italian headings into “authoritative” Library of Congress headings.
 When I first got to Rome I had the good fortune to hang out with Terry Reese, the author of the venerable MarcEdit.‡ He was there giving workshops. I participated in the workshops. I listened, I learned, and I was grateful for a Macintosh-based version of Terry’s application.
When the workshops were over and Terry had gone home I began working more closely with Sebastian Hierl, the director of the Academy’s library.❧ Since the library was relatively small (about 150,000 volumes), and because the Academy used Koha for its integrated library system, it was relatively easy for Sebastian to give me the library’s entire set of 124,000 authority records in MARC format. I fed the authority records into MarcEdit, and ran a report against them. Specifically, I asked MarcEdit to identify the “invalid” records, which really means, “Find all the records not found in the Library of Congress database.” The result was a set of approximately 18,000 records or approximately 14% of the entire file. I then used MarcEdit to extract the “invalid” records from the complete set, and this became my working data.
 I next created a rudimentary table denoting the “invalid” records and the subsequent search results for them. This tab-delimited file included values of MARC field 001, MARC field 1xx, an integer denoting the number of times I searched for a matching record, an integer denoting the number of records I found, an identifier denoting a Library of Congress authority record of choice, and a URL providing access to the remote authority record. This table was initialized using a script called authority2list.pl. Given a file of MARC records, it outputs the table.
I then systematically searched the Library of Congress for authority headings. This was done with a script called search.pl. Given the table created in the previous step, this script looped through each authority, did a rudimentary search for a valid entry, and output an updated version of the table. This script was a bit “tricky”.❦ It first searched the Library of Congress by looking for the value of MARC 1xx$a. If no records were found, then no updating was done and processing continued. If one record was found, then the Library of Congress identifier was saved to the output and processing continued. If many records were found, then a more limiting search was done by adding a date value extracted from MARC 1xx$d. Depending on the second search result, the output was updated (or not), and processing continued. Out of original 18,000 “invalid” records, about 50% of them were identified with no (zero) Library of Congress records, about 30% were associated with multiple headings, and the remaining 20% (approximately 3,600 records) were identified with one and only one Library of Congress authority record.
I now had a list of 3,600 “valid” authority records, and I needed to download them. This was done with a script called harvest.pl. This script is really a wrapper around a program called GNU Wget. Given my updated table, the script looped through each row, and if it contained a URL pointing to a Library of Congress authority record, then the record was cached to the file system. Since the downloaded records were formatted as MARCXML, I then needed to transform them into MARC21. This was done with a pair of scripts: xml2marc.sh and xml2marc.pl. The former simply looped through each file in a directory, and the later did the actual transformation but along the way updated MARC 001 to the value of the local authority record.
 In order to allow myself as well as others to verify that correct records had been identified, I wrote another pair of programs: marc2compare.pl and compare2html.pl. Given two MARC files, marc2compare.pl created a list of identifiers, original authority values, proposed authority values, and URLs pointing to full descriptions of each. This list was intended to be poured into a spreadsheet for compare & contrast purposes. The second script, compare2html.pl, simply took the output of the first and transformed it into a simple HTML page making it easier for a librarian to evaluate correctness.
Assuming the 3,600 records were correct, the next step was to merge/overlay the old records with the new records. This was a two-step process. The first step was accomplished with a script called rename.pl. Given two MARC files, rename.pl first looped through the set of new authorities saving each identifier to memory. It then looped through the original set of authorities looking for records to update. When records to update were found, each was marked for deletion by prefixing MARC 001 with “x-“. The second step employed MarcEdit to actually merge the set of new authorities with the original authorities. Consequently, the authority file increased in size by 3,600 records. It was then up to other people to load the authorities into Koka, re-evaluate the authorities for correctness, and if everything was okay, then delete each authority record prefixed with “x-“.
Done.❀
In summary, this is how things happened. I:
 There were many possible next steps. One possibility was to repeat the entire process but with an enhanced search algorithm. This could be difficult considering the fact that searches using merely the value of 1xx$a returned zero hits for half of the working data. A second possibility was to identify authoritative records from a different system such as VIAF or Worldcat. Even if this was successful, I wonder how possible it would have been to actually download authority records as MARC. A third possibility was to write a sort of disambiguation program allowing librarians to choose from a set of records. This could have been accomplished by searching for authorities, presenting possibilities, allowing librarians to make selections via an HTML form, caching the selections, and finally, batch updating the master authority list. Here at the Academy we denoted the last possibility as the “cool” one.
Now here’s an interesting way to look at the whole thing. This process took me about two weeks worth of work, and in that two weeks I processed 18,000 authority records. That comes out to 9,000 records/week. There are 40 hours in work week, and consequently, I processed 225 records/hour. Each hour is made up of 60 minutes, and therefore I processed approximately 4 records/minute, and that is 1 record every fifteen seconds for the last two weeks. Wow!?
Finally, I’d like to thank the Academy (with all puns intended). Sebastian, his colleagues, and especially my office mate (Kristine Iara) were all very supportive throughout my visit. They provided intellectual stimulation and something to do while I contemplated my navel during the “adventure”.
 † Strictly speaking, my adventure was not a sabbatical nor a leave of absence because: 1) as a librarian I was not authorized to take a sabbatical, and 2) I did not have any healthcare issues. Instead, after bits of negotiation, my contract was temporarily changed from full-time faculty to adjunct faculty, and I worked for my employer 20% of the time. The other 80% of time was spent on my “adventure”. And please don’t get me wrong, this whole thing was a wonderful opportunity for which I will be eternally grateful. “Thank you!”
‡ During our overlapping times there in Rome, Terry & I played tourist which included the Colosseum, a happenstance mass at the Pantheon, a Palm Sunday Mass in St. Peter’s Square with tickets generously given to us by Joy Nelson of ByWater Solutions, and a day-trip to Florence. Along the way we discussed librarianship, open source software, academia, and life in general. A good time was had by all.
❧ Ironically, Sebastian & I were colleagues during the dot-com boom when we both worked at North Caroline State University. The world of librarianship is small.
❦ This script — search.pl — was really a wrapper around an application called curl, and thanks go to Jeff Young of OCLC who pointed me to the ATOM interface of the LC Linked Data Service. Without Jeff’s helpful advice, I would have wrestled with OCLC’s various authentication systems and Web Service interfaces.
❀ Actually, I skipped a step in this narrative. Specifically, there are some records in the authority file that were not expected to be touched, even if they are “invalid”. This set of records was associated with a specific call number pattern. Two scripts (fu-extract.pl and fu-remove.pl) did the work. The first extracted a list of identifiers not to touch and the second removed them from my table of candidates to validate.
2016-04-07T07:52:37+00:00 Mini-musings: Failure to communicate http://infomotions.com/blog/2016/03/failure-to-communicate/In my humble opinion, what we have here is a failure to communicate.
 Libraries, especially larger libraries, are increasingly made up of many different departments, including but not limited to departments such as: cataloging, public services, collections, preservation, archives, and now-a-days departments of computer staff. From my point of view, these various departments fail to see the similarities between themselves, and instead focus on their differences. This focus on the differences is amplified by the use of dissimilar vocabularies and subdiscipline-specific jargon. This use of dissimilar vocabularies causes a communications gap and left unresolved ultimately creates animosity between groups. I believe this is especially true between the more traditional library departments and the computer staff. This communications gap is an impediment to when it comes to achieving the goals of librarianship, and any library — whether it be big or small — needs to address these issues lest it wastes both its time and money.
Here are a few examples outlining failures to communicate:
 As a whole, what the profession does not understand is that everybody working in a library has more things in common than differences. Everybody is (suppose to be) working towards the same set of goals. Everybody plays a part in achieving those goals, and it behooves everybody to learn & respect the roles of everybody else. A goal is to curate collections. This is done through physical, intellectual, and virtual arrangment, but it also requires the use of computer technology. Collection managers need to understand more of the computer technology, and the technologist needs to understand more about curation. The application of AACR2/RDA is an attempt to manifest inventory and the dissemination of knowledge. The use of databases & indexes also manifest inventory and dissemination of knowledge. Catalogers and database administrators ought to communicate on the similar levels. Similarly, there is much more to preservation of materials than putting bits on tape. “Yikes!”
What is the solution to these problems? In my opinion, there are many possibilities, but the solution ultimately rests with individuals willing to take the time to learn from their co-workers. It rests in the ability to respect — not merely tolerate — another point of view. It requires time, listening, discussion, reflection, and repetition. It requires getting to know other people on a personal level. It requires learning what others like and dislike. It requires comparing & contrasting points of view. It demands “walking a mile in the other person’s shoes”, and can be accomplished by things such as the physical intermingling of departments, cross-training, and simply by going to coffee on a regular basis.
Again, all of us working in libraries have more similarities than differences. Learn to appreciate the similarities, and the differences will become insignificant. The consequence will be a more holistic set of library collections and services.
2016-03-22T10:35:50+00:00 Mini-musings: Using BIBFRAME for bibliographic description http://infomotions.com/blog/2016/03/bibframe/Bibliographic description is an essential process of librarianship. In the distant past this process took the form of simple inventories. In the last century we saw bibliographic description evolve from the catalog card to the MARC record. With the advent of globally networked computers and the hypertext transfer protocol, we are seeing the emergence of a new form of description called BIBFRAME which is based on the principles of RDF (Resource Description Framework). This essay describes, illustrates, and demonstrates how BIBFRAME can be used to fulfill the promise and purpose of bibliographic description.†
 Libraries are about a number of things. Some of those things surround the collection and preservation of materials, most commonly books. Some of those things surround services, most commonly the lending of books.†† But it is asserted here that collections are not really about books nor any other physical medium because those things are merely the manifestation of the real things of libraries: data, information, and knowledge. It is left to another essay as to the degree libraries are about wisdom. Similarly, the primary services of libraries are not really about the lending of materials, but instead the services surround learning and intellectual growth. Librarians cannot say they have lent somebody a book and conclude they have done their job. No, more generally, libraries provide services enabling the reader to use & understand the content of acquired materials. In short, it is asserted that libraries are about the collection, organization, preservation, dissemination, and sometimes evaluation of data, information, knowledge, and sometimes wisdom.
With the advent of the Internet the above definition of librarianship is even more plausible since the materials of libraries can now be digitized, duplicated (almost) exactly, and distributed without diminishing access to the whole. There is no need to limit the collection to physical items, provide access to the materials through surrogates, nor lend the materials. Because these limitations have been (mostly) removed, it is necessary for libraries to think differently their collections and services. To the author’s mind, librarianship has not shifted fast enough nor far enough. As a long standing and venerable profession, and as an institution complete with its own set of governance, diversity, and shear size, change & evolution happen very slowly. The evolution of bibliographic description is a perfect example.
Bibliographic description happens in between the collections and services of libraries, and the nature of bibliographic description has evolved with technology. Think of the oldest libraries. Think clay tablets and papyrus scrolls. Think of the size of library collections. If a library’s collection was larger than a few hundred items, then the library was considered large. Still, the collections were so small that an inventory was relatively easy for sets of people (librarians) to keep in mind.
Think medieval scriptoriums and the development of the codex. Consider the time, skill, and labor required to duplicate an item from the collection. Consequently, books were very expensive but now had a much longer shelf life. (All puns are intended.) This increased the size of collections, but remembering everything in a collection was becoming more and more difficult. This, coupled with the desire to share the inventory with the outside world, created the demand for written inventories. Initially, these inventories were merely accession lists — a list of things owned by a library and organized by the date they were acquired.
With the advent of the printing press, even more books were available but at a much lower cost. Thus, the size of library collections grew. As it grew it became necessary to organize materials not necessarily by their acquisition date nor physical characteristics but rather by various intellectual qualities — their subject matter and usefulness. This required the librarian to literally articulate and manifest things of quality, and thus the profession begins to formalize the process of analytics as well as supplement their inventory lists with this new (which is not really new) information.
Consider some of the things beginning in the 18th and 19th centuries: the idea of the “commons”, the idea of the informed public, the idea of the “free” library, and the size of library collections numbering 10’s of thousands of books. These things eventually paved the way in the 20th century to open stacks and the card catalog — the most recent incarnation of the inventory list written in its own library short-hand and complete with its ever-evolving controlled vocabulary and authority lists — becoming available to the general public. Computers eventually happen and so does the MARC record. Thus, the process of bibliographic description (cataloging) literally becomes codified. The result is library jargon solidified in an obscure data structure. Moreover, in an attempt to make the surrogates of library collections more meaningful, the information of bibliographic description bloats to fill much more than the traditional three to five catalog cards of the past. With the advent of the Internet comes less of a need for centralized authorities. Self-service and connivence become the norm. When was the last time you used a travel agent to book airfare or reserve a hotel room?
Librarianship is now suffering from a great amount of reader dissatisfaction. True, most people believe libraries are “good things”, but most people also find libraries difficult to use and not meeting their expectations. People search the Internet (Google) for items of interest, and then use library catalogs to search for known items. There is then a strong desire to actually get the item, if it is found. After all, “Everything in on the ‘Net”. Right? To this author’s mind, the solution is two-fold: 1) digitize everthing and put the result on the Web, and 2) employ a newer type of bibliographic description, namely RDF. The former is something for another time. The later is elaborated upon below.
Resource Description Framework (RDF) is essentially relational database technology for the Internet. It is comprised of three parts: keys, relationships, and values. In the case of RDF and akin to relational databases, keys are unique identifiers and usually in the form of URIs (now called “IRIs” — Internationalized Resource Identifiers — but think “URL”). Relationships take the form of ontologies or vocabularies used to describe things. These ontologies are very loosely analogous to the fields in a relational database table, and there are ontologies for many different sets of things, including the things of a library. Finally, the values of RDF can also be URIs but are ultimately distilled down to textual and numeric information.
RDF is a conceptual model — a sort of cosmology for the universe of knowledge. RDF is made real through the use of “triples”, a simple “sentence” with three distinct parts: 1) a subject, 2) a predicate, and 3) an object. Each of these three parts correspond to the keys, relationships, and values outlined above. To extend the analogy of the sentence further, think of subjects and objects as if they were nouns, and think of predicates as if they were verbs. And here is a very important distinction between RDF and relational databases. In relational databases there is the idea of a “record” where an identifier is associated with a set of values. Think of a book that is denoted by a key, and the key points to a set of values for titles, authors, publishers, dates, notes, subjects, and added entries. In RDF there is no such thing as the record. Instead there are only sets of literally interlinked assertions — the triples.
Triples (sometimes called “statements”) are often illustrated as arced graphs where subjects and objects are nodes and predicates are lines connecting the nodes:
[ subject ] --- predicate ---> [ object ]
The “linking” in RDF statements happens when sets of triples share common URIs. By doing so, the subjects of statements end up having many characteristics, and the objects of URIs point to other subjects in other RDF statements. This linking process transforms independent sets of RDF statements into a literal web of interconnections, and this is where the Semantic Web gets its name. For example, below is a simple web of interconnecting triples:
              / --- a predicate ---------> [ an object ]
[ subject ] - | --- another predicate ---> [ another object ]
              \ --- a third predicate ---> [ a third object ]
                                                   |
                                                   |
                                          yet another predicate
                                                   |
                                                   |
                                                  \ /

                                         [ yet another object ]
An example is in order. Suppose there is a thing called Rome, and it will be represented with the following URI: http://example.org/rome. We can now begin to describe Rome using triples:
subjects                 predicates         objects
-----------------------  -----------------  -------------------------
http://example.org/rome  has name           "Rome"
http://example.org/rome  has founding date  "1000 BC"
http://example.org/rome  has description    "A long long time ago,..."
http://example.org/rome  is a type of       http://example.org/city
http://example.org/rome  is a sub-part of   http://example.org/italy
The corresponding arced graph would look like this:
                               / --- has name ------------> [ "Rome" ]
                              |  --- has description -----> [ "A long time ago..." ]
[ http://example.org/rome ] - |  --- has founding date ---> [ "1000 BC" ]
                              |  --- is a sub-part of  ---> [ http://example.org/italy ]
                               \ --- is a type of --------> [ http://example.org/city ]
In turn, the URI http://example.org/italy might have a number of relationships asserted against it also:
subjects                  predicates         objects
------------------------  -----------------  -------------------------
http://example.org/italy  has name           "Italy"
http://example.org/italy  has founding date  "1923 AD"
http://example.org/italy  is a type of       http://example.org/country
http://example.org/italy  is a sub-part of   http://example.org/europe
Now suppose there were things called Paris, London, and New York. They can be represented in RDF as well:
subjects                    predicates          objects
--------------------------  -----------------   -------------------------
http://example.org/paris    has name            "Paris"
http://example.org/paris    has founding date   "100 BC"
http://example.org/paris    has description     "You see, there's this tower..."
http://example.org/paris    is a type of        http://example.org/city
http://example.org/paris    is a sub-part of    http://example.org/france
http://example.org/london   has name            "London"
http://example.org/london   has description     "They drink warm beer here."
http://example.org/london   has founding date   "100 BC"
http://example.org/london   is a type of        http://example.org/city
http://example.org/london   is a sub-part of    http://example.org/england
http://example.org/newyork  has founding date   "1640 AD"
http://example.org/newyork  has name            "New York"
http://example.org/newyork  has description     "It is a place that never sleeps."
http://example.org/newyork  is a type of        http://example.org/city
http://example.org/newyork  is a sub-part of    http://example.org/unitedstates
Furthermore, each of “countries” can be have relationships denoted against them:
subjects                         predicates         objects
-------------------------------  -----------------  -------------------------
http://example.org/unitedstates  has name           "United States"
http://example.org/unitedstates  has founding date  "1776 AD"
http://example.org/unitedstates  is a type of       http://example.org/country
http://example.org/unitedstates  is a sub-part of   http://example.org/northamerica
http://example.org/england       has name           "England"
http://example.org/england       has founding date  "1066 AD"
http://example.org/england       is a type of       http://example.org/country
http://example.org/england       is a sub-part of   http://example.org/europe
http://example.org/france        has name           "France"
http://example.org/france        has founding date  "900 AD"
http://example.org/france        is a type of       http://example.org/country
http://example.org/france        is a sub-part of   http://example.org/europe
The resulting arced graph of all these triples might look like this:
[IMAGINE A COOL LOOKING ARCED GRAPH HERE.]
From this graph, new information can be inferred as long as one is able to trace connections from one node to another node through one or more arcs. For example, using the arced graph above, questions such as the following can be asked and answered:
In summary, RDF is data model — a method for organizing discrete facts into a coherent information system, and to this author, this sounds a whole lot like a generalized form of bibliographic description and a purpose of library catalogs. The model is built on the idea of triples whose parts are URIs or literals. Through the liberal reuse of URIs in and between sets of triples, questions surrounding the information can be answered and new information can be inferred. RDF is the what of the Semantic Web. Everything else (ontologies & vocabularies, URIs, RDF “serializations” like RDF/XML, triple stores, SPARQL, etc.) are the how’s. None of them will make any sense unless the reader understands that RDF is about establishing relationships between data for the purposes of sharing information and increasing the “sphere of knowledge”.
Linked data is RDF manifested. It is a process of codifying triples and systematically making them available on the Web. It first involves selecting, creating (“minting”), and maintaining sets of URIs denoting the things to be described. When it comes to libraries, there are many places where authoritative URIs can be gotten including: OCLC’s Worldcat, the Library of Congress’s linked data services, Wikipedia, institutional repositories, or even licensed indexes/databases.
Second, manifesting RDF as linked data involves selecting, creating, and maintaining one or more ontologies used to posit relationships. Like URIs, there are many existing bibliographic ontologies for the many different types of cultural heritage institutions: libraries, archives, and museums. Example ontologies include but are by no means limited to: BIBFRAME, bib.schema.org, the work of the (aged) LOCAH project, EAC-CPF, and CIDOC CRM.
The third step to implementing RDF as linked data is to actually create and maintain sets of triples. This is usually done through the use of a “triple store” which is akin to a relational database. But remember, there is no such thing as a record when it comes to RDF! There are a number of not a huge number of toolkits and applications implementing triple stores. 4store is (or was) a popular open source triple store implementation. Virtuoso is another popular implementation that comes in both open sources as well as commercial versions.
The forth step in the linked data process is the publishing (making freely available on the Web) of RDF. This is done in a combination of two ways. The first is to write a report against the triple store resulting in a set of “serializations” saved at the other end of a URL. Serializations are textual manifestations of RDF triples. In the “old days”, the serialization of one or more triples was manifested as XML, and might have looked something like this to describe the Declaration of Independence and using the Dublin Core and FOAF (Friend of a friend) ontologies:
<?xml version="1.0"?>
<rdf:RDF xmlns:rdf="http://www.w3.org/1999/02/22-rdf-syntax-ns#"
xmlns:dcterms="http://purl.org/dc/terms/" xmlns:foaf="http://xmlns.com/foaf/0.1/">
<rdf:Description rdf:about="http://en.wikipedia.org/wiki/Declaration_of_Independence">
  <dcterms:creator>
	<foaf:Person rdf:about="http://id.loc.gov/authorities/names/n79089957">
	  <foaf:gender>male</foaf:gender>
	</foaf:Person>
  </dcterms:creator>
</rdf:Description>
</rdf:RDF>
Many people think the XML serialization is too verbose and thus difficult to read. Consequently other serializations have been invented. Here is the same small set of triples serialized as N-Triples:
@prefix foaf: <http://xmlns.com/foaf/0.1/>.
@prefix rdf: <http://www.w3.org/1999/02/22-rdf-syntax-ns#>.
@prefix dcterms: <http://purl.org/dc/terms/>.
<http://en.wikipedia.org/wiki/Declaration_of_Independence> dcterms:creator <http://id.loc.gov/authorities/names/n79089957>.
<http://id.loc.gov/authorities/names/n79089957> a foaf:Person;
  foaf:gender "male".
Here is yet another example, but this time serialized as JSON, a data structure first implemented as a part of the Javascript language:
{
"http://en.wikipedia.org/wiki/Declaration_of_Independence": {
  "http://purl.org/dc/terms/creator": [
	{
	  "type": "uri",
	  "value": "http://id.loc.gov/authorities/names/n79089957"
	}
  ]
},
 "http://id.loc.gov/authorities/names/n79089957": {
   "http://xmlns.com/foaf/0.1/gender": [
	 {
	   "type": "literal",
	   "value": "male"
	 }
   ],
   "http://www.w3.org/1999/02/22-rdf-syntax-ns#type": [
	 {
	   "type": "uri",
	   "value": "http://xmlns.com/foaf/0.1/Person"
	 }
   ]
 }
}
RDF has even been serialized in HTML files by embedding triples into attributes. This is called RDFa, and a snippet of RDFa might look like this:
<div xmlns="http://www.w3.org/1999/xhtml"
  prefix="
    foaf: http://xmlns.com/foaf/0.1/
    rdf: http://www.w3.org/1999/02/22-rdf-syntax-ns#
    dcterms: http://purl.org/dc/terms/
    rdfs: http://www.w3.org/2000/01/rdf-schema#"
</div>
<div typeof="rdfs:Resource" about="http://en.wikipedia.org/wiki/Declaration_of_Independence">
  <div rel="dcterms:creator">
    <div typeof="foaf:Person" about="http://id.loc.gov/authorities/names/n79089957">
      <div property="foaf:gender" content="male"></div>
    </div>
  </div>
</div>
</div>
Once the RDF is serialized and put on the Web, it is intended to be harvested by Internet spiders and robots. They cache the data locally, read it, and update their local triples stores. This data is then intended to be analyzed, indexed, and used to find or discover new relationships or knowledge.
The second way of publishing linked data is through a “SPARQL endpoint”. SPARQL is a query language very similar to the query language of relational databases (SQL). SPARQL endpoints are usually Web-accesible interfaces allowing the reader to search the underlying triple store. The result is usually a stream of XML. Admitted, SPARQL is obtuse at the very least.
Just like the published RDF, the output of SPARQL queries can be serialized in many different forms. And just like relational databases, triple stores and SPARQL queries are not intended to be used directly by the reader. Instead, something more friendly (but ultimately less powerful and less flexible) is always intended.
So what does this have to do with libraries and specifically bibliographic description? The answer is not that complicated. The what of librarianship has not really changed over the millenium. Librarianship is still about processes of collection, organization, preservation, dissemination, and sometimes evaluation. On the other hand, with the evolution of technology and cultural expectations, the how’s of librarianship have changed dramatically. Considering the current environment, it is time to evolve, yet again. The next evolution is the employment of RDF and linked data as the means of bibliographic description. By doing so the data, information, and knowledge contained in libraries will be more accessible and more useful to the wider community. As time has gone on, the data and metadata of libraries has become less and less librarian-centric. By taking the leap to RDF and linked data, this will only become more true, and this is a good thing for both libraries and the people they serve.
Enter BIBFRAME, an ontology designed for libraries and their collections. It is not the only ontology intended to describe libraries and their collections. There are other examples as well, notably, bib.schema.org, FRBR for RDF, MODS and MADS for RDF, and to some extent, Dublin Core. Debates rage on mailing lists regarding the inherent advantages & disadvantages of each of these ontologies. For the most part, the debates seem to be between BIBFRAME, bib.schema.org, and FRBR for RDF. BIBFRAME is sponsored by the Library of Congress and supported by a company called Zepheira. At its very core are the ideas of a work and its instance. In other words, BIBFRAME boils the things of libraries down to two entities. Bib.schema.org is a subset of schema.org, an ontology endorsed by the major Internet search engines (Google, Bing, and Yahoo). And since schema.org is designed to enable the description of just about anything, the implementation of bib.schema.org is seen as a means of reaching the widest possible audience. On the other hand, bib.schema.org is not always seen as being as complete as BIBFRAME. The third contender is FRBR for RDF. Personally, the author has not seen very many examples of its use, but it purports to better serve the needs/desires of the reader through the concepts of WEMI (Work, Expression, Manifestation, and Item).
That said, it is in this author’s opinion, that the difference between the various ontologies is akin to debating the differences between vanilla and chocolate ice cream. It is a matter of opinion, and the flavors are not what is important, but rather it is the ice cream itself. Few people outside libraries really care which ontology is used. Besides, each ontology includes predicates for the things everybody expects: titles, authors, publishers, dates, notes, subjects/keywords, added entries, and locations. Moreover, in this time of transition, it is not feasible to come up with the perfect solution. Instead, this evolution is an iterative process. Give something a go. Try it for a limited period of time. Evaluate. And repeat. We also live in a world of digital data and information. This data and information is, by its very nature, mutable. There is no reason why one ontology over another needs to be debated ad nauseum. Databases (triple stores) support the function of find/replace with ease. If one ontology does not seem to be meeting the desired needs, then (simply) change to another one.††† In short, BIBFRAME may not be the “best” ontology, but right now, it is good enough.
Now that the fundamentals have been outlined and elaborated upon, a workflow can be articulated. At the risk of mixing too many metaphors, here is a “recipe” for doing bibliographic description using BIBFRAME (or just about any other bibliographic ontology):
If the profession continues to use its existing integrated library systems for maintaining bibliographic data (Step #4), then the hard problem to solve is transforming and exposing the bibliographic data as linked data in the form of the given ontology. If the profession designs a storage and maintenance system rooted in the given ontology to begin with, then the problem is accurately converting existing data into the ontology and then designing mechanisms for creating/editing the data. The later option may be “better”, but the former option seems less painful and requires less retooling. This author advocates the “better” solution.
After a while, such a system may enable a library to meet the expressed needs/desires of its constituents, but it may present the library with a different set of problems. On one hand, the use of RDF as the root of a discovery system almost literally facilitates a “Web of knowledge”. But on the other hand, to what degree can it be used to do (more mundane) tasks such as circulation and acquisitions? One of the original purposes of bibliographic description was to create a catalog — an inventory list. Acquisitions adds to the list, and circulation modifies the list. To what degree can the triple store be used to facilitate these functions? If the answer is “none”, then there will need to be some sort of outside application interfacing with the triple store. If the answer is “a lot”, then the triple store will need to include an ontology to facilitate acquisitions and circulation.
In the spirit of putting the money where the mouth is, the author has created the most prototypical and toy implementations possible. It is merely a triple store filled with a tiny set of automatically transformed MARC records and made publicly accessible via SPARQL. The triple store was built using a set of Perl modules called Redland. The system supports initialization of a triple store, the adding of items to the store via files saved on a local file system, rudimentary command-line search, a way to dump the contents of the triple store in the form of RDF/XML, and a SPARQL endpoint. [1] Thus, Step #4 from the recipe above has been satisfied.
To facilitate Step #5 a MARC to BIBFRAME transformation tool was employed [2]. The transformed MARC data was very small, and the resulting serialized RDF was valid. [3, 4] The RDF was imported into the triple store and resulted in the storage of 5,382 triples. Remember, there is no such thing as a record in the world of RDF! Using the SPARQL endpoint, it is now possible to query the triple store. [5] For example, the entire store can be dumped with this (dangerous) query:
# dump of everything
SELECT ?s ?p ?o
WHERE { ?s ?p ?o }
To see what types of things are described one can list only the objects (classes) of the store:
# only the objects
SELECT DISTINCT ?o
WHERE { ?s a ?o }
ORDER BY ?o
To get a list of all the store’s properties (types of relationships), this query is in order:
# only the predicates
SELECT DISTINCT ?p
WHERE { ?s ?p ?o }
ORDER BY ?p
BIBFRAME denotes the existence of “Works”, and to get a list of all the works in the store, the following query can be executed:
# a list of all BIBFRAME Works
SELECT ?s
WHERE { ?s a <http://bibframe.org/vocab/Work> }
ORDER BY ?s
This query will enumerate and tabulate all of the topics in the triple store. Thus providing the reader with an overview of the breadth and depth of the collection in terms of subjects. The output is ordered by frequency:
# a breadth and depth of subject analsysis
SELECT ( COUNT( ?l ) AS ?c ) ?l
WHERE {
  ?s a <http://bibframe.org/vocab/Topic> .
  ?s <http://bibframe.org/vocab/label> ?l
}
GROUP BY ?l
ORDER BY DESC( ?c )
All of the information about a specific topic in this particular triple store can be listed in this manner:
# about a specific topic
SELECT ?p ?o
WHERE { <http://bibframe.org/resources/Ssh1456874771/vil_134852topic10> ?p ?o }
The following query will create the simplest of title catalogs:
# simple title catalog
SELECT ?t ?w ?c ?l ?a
WHERE {
  ?w a <http://bibframe.org/vocab/Work>           .
  ?w <http://bibframe.org/vocab/workTitle>    ?wt .
  ?wt <http://bibframe.org/vocab/titleValue>  ?t  .
  ?w <http://bibframe.org/vocab/creator>      ?ci .
  ?ci <http://bibframe.org/vocab/label>       ?c  .
  ?w <http://bibframe.org/vocab/subject>      ?s  .
  ?s <http://bibframe.org/vocab/label>        ?l  .
  ?s <http://bibframe.org/vocab/hasAuthority> ?a
}
ORDER BY ?t
The following query is akin to a phrase search. It looks for all the triples (not records) containing a specific key word (catholic):
# phrase search
SELECT ?s ?p ?o
WHERE {
  ?s ?p ?o
  FILTER REGEX ( ?o, 'catholic', 'i' )
}
ORDER BY ?p
Automatically transformed MARC data into BIBFRAME RDF will contain a preponderance of literal values when URIs are really desired. The following query will find all of the literals and sort them by the number of their individual occurrences:
# find all literals
SELECT ?p ?o ( COUNT ( ?o ) as ?c )
WHERE { ?s ?p ?o FILTER ( isLiteral ( ?o ) ) }
GROUP BY ?o
ORDER BY DESC( ?c )
It behooves the cataloger to identify URIs for these literal values and replace the literals (or supplement) the triples accordingly (Step #5E in the recipe, above). This can be accomplished both programmatically as well as manually by first creating a list of appropriate URIs and then executing a set of INSERT or UPDATE commands against the triple store.
“Blank nodes” (URIs that point to nothing) are just about as bad as literal values. The following query will list all of the blank nodes in a triple store:
# find all blank nodes
SELECT ?s ?p ?o WHERE { ?s ?p ?o FILTER ( isBlank( ?s ) ) }
And the data associated with a particular blank node can be queried in this way:
# learn about a specific blank node
SELECT distinct ?p WHERE { _:r1456957120r7483r1 ?p ?o } ORDER BY ?p
In the case of blank nodes, the cataloger will then want to “mint” new URIs and perform an additional set of INSERT or UPDATE operations against the underlying triple store. This is a continuation of Step #5E.
These SPARQL queries applied against this prototypical implementation have tried to illustrate how RDF can fulfill the needs and requirements of bibliographic description. One can now begin to see how an RDF triple store employing a bibliographic ontology can be used to fulfill some of the fundamental goals of a library catalog.
This essay defined librarianship as a set of interlocking collections and services. Bibliographic description was outlined in an historical context, with the point being that the process of bibliographic description has evolved with technology and cultural expectations. The principles of RDF and linked data were then described, and the inherent advantages & disadvantages of leading bibliographic RDF ontologies were touched upon. The essay then asserted the need for faster evolution regarding bibliographic description and advocated the use of RDF and BIBFRAME for this purpose. Finally, the essay tried to demonstrate how RDF and BIBFRAME can be used to satisfy the functionality of the library catalog. It did this through the use of a triple store and a SPARQL endpoint. In the end, it is hoped the reader understands that there is no be-all end-all solution for bibliographic description, but the use of RDF technology is the wave of the future, and BIBFRAME is good enough when it comes to the ontology. Moving to the use of RDF for bibliographic description will be painful for the profession, but not moving to RDF will be detrimental.
† This presentation ought to be also be available as a one-page handout in the form of a PDF document.
†† Moreover, collections and services go hand-in-hand because collections without services are useless, and services without collections are empty. As a buddhist monk once said, “Collections without services is the sound of one hand clapping.” Librarianship requires a healthy balance of both.
††† That said, no matter what a person does, things always get lost in translation. This is true of human language just as much as it is true for the language (data/information) of computers. Yes, data & information will get lost when moving from one data model to another, but still I contend the fundamental and most useful elements will remain.
†††† This process (Step #5E) was coined by Roy Tennant and his colleagues at OCLC as “entification”.
[1] toy implementation – http://infomotions.com/sandbox/bibframe/
[2] MARC to BIBFRAME – http://bibframe.org/tools/transform/start
[3] sample MARC data – http://infomotions.com/sandbox/bibframe/data/data.xml
[4] sample RDF data – http://infomotions.com/sandbox/bibframe/data/data.rdf
[5] SPARQL endpoint – http://infomotions.com/sandbox/bibframe/sparql/
This past Fall I taught “XML 101” online and to library school graduate students. This posting echoes the scripts of my video introductions, and I suppose this posting could also be used as very gentle introduction to XML for librarians.
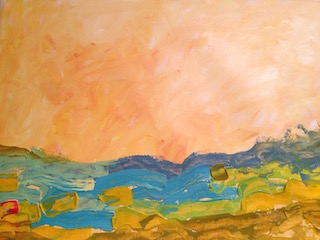 I work at the University of Notre Dame, and my title is Digital Initiatives Librarian. I have been a librarian since 1987. I have been writing software since 1976, and I will be your instructor. Using materials and assignments created by the previous instructors, my goal is to facilitate your learning of XML.
XML is a way of transforming data into information. It is a method for marking up numbers and text, giving them context, and therefore a bit of meaning. XML includes syntactical characteristics as well as semantic characteristics. The syntactical characteristics are really rather simple. There are only five or six rules for creating well-formed XML, such as: 1) there must be one and only one root element, 2) element names are case-sensitive, 3) elements must be close properly, 4) elements must be nested properly, 4) attributes must be quoted, and 5) there are a few special characters (&, <, and >) which must be escaped if they are to be used in their literal contexts. The semantics of XML is much more complicated and they denote the intended meaning of the XML elements and attributes. The semantics of XML are embodied in things called DTDs and schemas.
Again, XML is used to transform data into information. It is used to give data context, but XML is also used to transmit this information in an computer-independent way from one place to another. XML is also a data structure in the same way MARC, JSON, SQL, and tab-delimited files are data structures. Once information is encapsulated as XML, it can unambiguously transmitted from one computer to another where it can be put to use.
This course will elaborate upon these ideas. You will learn about the syntax and semantics of XML in general. You will then learn how to manipulate XML using XML-related technologies called XPath and XSLT. Finally, you will learn library-specific XML “languages” to learn how XML can be used in Library Land.
In this, the second week of “XML 101 for librarians”, you will learn about well-formed XML and valid XML. Well-formed XML is XML that conforms to the five or six syntactical rules. (XML must have one and only one root element. Element names are case sensitive. Elements must be closed. Elements must be nested correctly. Attributes must be quoted. And there are a few special characters that must be escaped (namely &, <, and >). Valid XML is XML that is not only well-formed but also conforms to a named DTD or schema. Think of valid XML as semantically correct.
Jennifer Weintraub and Lisa McAulay, the previous instructors of this class, provide more than a few demonstrations of how to create well-formed as well as valid XML. Oxygen, the selected XML editor for this course is both powerful and full-featured, but using it efficiently requires practice. That’s what the assignments are all about. The readings supplement the demonstrations.
DTD’s, schemas, and namespaces put the “X” in XML. They make XML extensible. They allow you to define your own elements and attributes to create your own “language”.
DTD’s — document type declarations — and schemas are the semantics of XML. They define what elements exists, what order they appear in, what attributes they can contain, and just as importantly what the elements are intended to contain. DTD’s are older than schemas and not as robust. Schemas are XML documents themselves and go beyond DTD’s in that they provide the ability to define the types of data elements and attributes contain.
Namespaces allow you, the author, to incorporate multiple DTD and schema definitions into a single XML document. Namespaces provide a way for multiple elements of the same name to exist concurrently in a document. For example, two different DTD’s may contain an element called “title”, but one DTD refers to a title as in the title of a book, and the other refers to “title” as if it were an honorific.
Schemas are an alternative and more intelligent alternative to DTDs. While DTDs define the structure of XML documents, schemas do it with more exactness. While DTDs only allow you to define elements, the number of elements, the order of elements, attributes, and entities, schemas allow you to do these things and much more. For example, they allow you to define the types of content that go into elements or attributes. Strings (characters). Numbers. Lists of characters or numbers. Boolean (true/false) values. Dates. Times. Etc. Schemas are XML documents in an of themselves, and therefore they can be validated just like any other XML document with a pre-defined structure.
The reading and writing of XML schemas is very librarian-ish because it is about turning data into information. It is about structuring data so it makes sense, and it does this in an unambiguous and computer-independent fashion. It is too bad our MARC (bibliographic) standards are not as rigorous.
 The first is yet another technology for modeling your XML, and it is called RelaxNG. This third modeling technology is intended to be more human readable than schemas and more robust that DTDs. Frankly, I have not seen RelaxNG implements very many times, but it behooves you to know it exists and how it compares to other modeling tools.
The second is Schematron. This tool too is used to validate XML, but instead of returning “ugly” computer-looking error messages, its errors are intended to be more human-readable and describe why things are the way they are instead of just saying “Wrong!”
Lastly, there is an introduction to digital libraries and trends in their current development. More and more, digital libraries are really and truly implementing the principles of traditional librarianship complete with collection, organization, preservation, and dissemination. At the same time, they are pushing the boundaries of the technology and stretching our definitions. Remember, it is not so much about the technology (the how of librarianship) that is important, but rather the why of libraries and librarianship. The how changes quickly. The why changes slowly, albiet sometimes too slowly.
This week is all about XPath, and it is used to select content from your XML files. It is akin to navigating a computer’s filesystem from the command line in order to learn what is located in different directories.
XPath is made up of expressions which return values of true, false, strings (characters), numbers, or nodes (subsets of XML files). XPath is used in conjunction with other XML technologies, most notably XSTL and XQuery. XSLT is used to transform XML files into other plain text files. XQuery is akin to the structured query language of relational databases.
You will not be able to do very much with XML other than read or write it, unless you understand XPath. An understanding XPath is essencial if you want to do truly interesting things with XML.
This week you will be introduced to XSLT, a programming language used to transform XML into other plain text files.
XML is all about information, and it is not about use nor display. In order for XML to be actually useful — to be applied towards some sort of end — specific pieces of data need to be extracted from XML or the whole of the XML file needs to be converted into something else. The most common conversion (or “transformation”) is from some sort of XML into HTML for display in a Web browser. For example, bibliographic XML (MARCXML or MODS) may be transformed into a sort of “catalog card” for display, or a TEI file may be transformed into a set of Web pages, or an EAD file may be transformed into a guide intended for printing. Alternatively, you may want to tranform the bibliographic data into a tab-delimited text file for a spreadsheet or an SQL file for a relational database. Along with other sets of information, an XML file may contain geographic coordinates, and you may want to extract just those coordinates to create a KML file — a sort of map file.
XSLT is a programming language but not like most programming languages you may know. Most programming languages are “procedural” (like Perl, PHP, or Python), meaning they execute their commands in a step-wise manner. “First do this, then do that, then do the other thing.” This can be contrasted with “declarative” programming languages where events occur or are encountered in a data file, and then some sort of execution happens. There are relatively few declarative programming languages, but LISP is/was one of them. Because of the declarative nature of XSLT, the apply-templates command is so important. The apply-templates command sort of tells the XSLT processor to go off and find more events.
Now that you are beginning to learn XSLT and combining it with XPath, you are beginning to do useful things with the XML you have been creating. This is where the real power is. This is where it gets really interesting.
TEI is a granddaddy, when it comes to XML “languages”. It started out as a different from of mark-up, a mark-up called SGML, and SGML was originally a mark-up language designed at IBM for the purposes of creating, maintaining, and distributing internal documentation. Now-a-days, TEI is all but a hallmark of XML.
TEI is a mark-up language for any type of literature: poetry or prose. Like HTML, it is made up of head and body sections. The head is the place for administrative, bibliographic, and provenance metadata. The body is where the poetry or prose is placed, and there are elements for just about anything you can imagine: paragraphs, lines, headings, lists, figures, marginalia, comments, page breaks, etc. And if there is something you want to mark-up, but an element does not explicitly exist for it, then you can almost make up your own element/attribute combination to suit your needs.
TEI is quite easily the most well-documented XML vocabulary I’ve ever seen. The community is strong, sustainable, albiet small (if not tiny). The majority of the community is academic and very scholarly. Next to a few types of bibliographic XML (MARCXML, MODS, OAIDC, etc.), TEI is probably the most commonly used XML vocabulary in Library Land, with EAD being a close second. In libraries, TEI is mostly used for the purpose of marking-up transcriptions of various kinds: letters, runs of out-of-print newsletters, or parts of a library special collection. I know of no academic journals marked-up in TEI, no library manuals, nor any catalogs designed for printing and distribution.
TEI, more than any other type of XML designed for literature, is designed to support the computed critical analysis of text. But marking something up in TEI in a way that supports such analysis is extraordinarily expensive in terms of both time and expertise. Consequently, based on my experience, there are relatively very few such projects, but they do exist.
As alluded to throughout this particular module, XSL-FO is not easy, but despite this fact, I sincerely believe it is under-utilized tool.
FO stands for “Formatting Objects”, and it in an of itself is an XML vocabulary used to define page layout. It has elements defining the size of a printed page, margins, running headers & footers, fonts, font sizes, font styles, indenting, pagination, tables of contents, back-of-the-book indexes, etc. Almost all of these elements and their attributes use a syntax similar to the syntax of HTML’s cascading stylesheets.
Once an XML file is converted into an FO document, you are expected to feed the FO document to a FO processor, and the FO processor will convert the document into something intended for printing — usually a PDF document.
FO is important because not everything is designed nor intended to be digital. Digital everything is mis-nomer. The graphic design of a printed medium is different from the graphic design of computer screens or smart phones. In my opinion, important XML files ought to be transformed into different formats for different mediums. Sometimes those mediums are screen oriented. Sometimes it is better to print something, and printed somethings last a whole lot longer. Sometimes it is important to do both.
FO is another good example of what XML is all about. XML is about data and information, not necessarily presentation. XSL transforms data/information into other things — things usually intended for reading by people.
Encoded Archival Description (or EAD) is the type of XML file used to enumerate, evaluate, and make accessible the contents of archival collections. Archival collections are often the raw and primary materials of new humanities scholarship. They are usually “the papers” of individuals or communities. They may consist of all sorts of things from letters, photographs, manuscripts, meeting notes, financial reports, audio cassette tapes, and now-a-days computers, hard drives, or CDs/DVDs. One thing, which is very important to understand, is that these things are “collections” and not intended to be used as individual items. MARC records are usually used as a data structure for bibliographically describing individual items — books. EAD files describe an entire set of items, and these descriptions are more colloquially called “finding aids”. They are intended to be read as intellectual works, and the finding aids transform collections into coherent wholes.
Like TEI files, EAD files are comprised of two sections: 1) a header and 2) a body. The header contains a whole lot or very little metadata of various types: bibliographic, administrative, provenance, etc. Some of this metadata is in the form of lists, and some of it is in the form of narratives. More than TEI files, EAD files are intended to be displayed on a computer screen or printed on paper. This is why you will find many XSL files transforming EAD into either HTML or FO (and then to PDF).
RDF is an acronym for Resource Description Framework. It is a data model intended to describe just about anything. The data model is based on an idea called triples, and as the name implies, the triples have three parts: 1) subjects, 2) predicates, and 3) objects.
Subjects are always URIs (think URLs), and they are the things described. Objects can be URIs or literals (words, phrases, or numbers), and objects are the descriptions. Predicates are also always URIs, and they denote the relationship between the subjects and the objects.
The idea behind RDF was this. Describe anything and everthing in RDF. Resuse as many of the URIs used by other people as possible. Put the RDF on the Web. Allow Internet robots/spiders to harvest and cache the RDF. Allow other computer programs to ingest the RDF, analyse it for the similar uses of subjects, predicates, and objects, and in turn automatically uncover new knowledge and new relationships between things.
RDF is/was originally expressed as XML, but the wider community had two problems with RDF. First, there were no “killer” applications using RDF as input, and second, RDF expressed as XML was seen as too verbose and too confusing. Thus, the idea of RDF languished. More recently, RDF is being expressed in other forms such as JSON and Turtle and N3, but there are still no killer applications.
You will hear the term “linked data” in association with RDF, and linked data is the process of making RDF available on the Web.
RDF is important for libraries and “memory” or “cultural heritage” institutions, because the goal of RDF is very similar to the goals of libraries, archives, and museums.
 The MARC standard has been the bibliographic bread & butter of Library Land since the late 1960’s. When it was first implemented it was an innovative and effect data structure used primarily for the production of catalog cards. With the increasing availability of computers, somebody got the “cool” idea of creating an online catalog. While logical, the idea did not mature with a balance of library and computing principles. To make a long story short, library principles prevailed and the result has been and continues to be painful for both the profession as well as the profession’s clientele.
MARCXML was intended to provide a pathway out of this morass, but since it was designed from the beginning to be “round tripable” with the original MARC standard, all of the short-comings of the original standard have come along for the ride. The Library Of Congress was aware of these short-comings, and consequently MODS was designed. Unlike MARC and MARCXML, MODS has no character limit and its field names are human-readable, not based on numeric codes. Given that MODS is flavor of XML, all of this is a giant step forward.
Unfortunately, the library profession’s primary access tools — the online catalog and “discovery system” — still heavily rely on traditional MARC for input. Consequently, without a wholesale shift in library practice, the intellectual capital the profession so dearly wants to share is figuratively locked in the 1960’s.
XML really is an excellent technology, and it is most certainly apropos for the work of cultural heritage institutions such as libraries, archives, and museums. This is true for many reasons:
On the other hand, it does have a number of disadvantages, for example:
To date you have learned how to read, write, and process XML and a number of its specific “flavors”, but you have by no means learned everything. Instead you have received a more than adequate introduction. Other XML topics of importance include:
In short, XML is not a panacea, but it is an excellent technology for library work.
You have all but concluded a course on XML in libraries, and now is a good time for a summary.
First of all, XML is one of culture’s more recent attempts at formalizing knowledge. At its root (all puns intended) is data, such as the number like 1776. Through mark-up we might say this number is a year, thus turning the data into information. By putting the information into context, we might say that 1776 is when the Declaration of Independence was written and a new type of government was formed. Such generalizations fall into the realm of knowledge. To some degree, XML facilitates the transformation of data into knowledge. (Again, all puns intended.)
Second, understand that XML is also a data structure defined by the characteristics of well-formedness. By that I mean XML has one and only one root element. Elements must be opened and closed in a hierarchal manner. Attributes of elements must be quoted, and a few special characters must always be escaped. The X in XML stands for “extensible”, and through the use of DTDs and schemas, specific XML “flavors” can be specified.
With this under your belts you then experimented with at least a couple of XML flavors: TEI and EAD. The former is used to mark-up literature. The later is used to describe archival collections. You then learned about the XML transformation process through the application of XSL and XPath, two rather difficult technologies to master. Lastly, you made strong efforts to apply the principles of XML to the principles of librarianship by marking up sets of documents or creating your own knowledge entity. It is hoped you have made a leap from mere technology to system. It is not about Oxygen nor graphic design. It is about the chemistry of disseminating data as unambiguously as possible for the purposes of increasing the sphere of knowledge. With these things understood, you are better equipped to practice librarianship in the current technological environment.
Finally, remember, there is no such thing as a Dublin Core record.
 This course in XML was really only an introduction. You were expected to read, write, and transform XML. This process turns data into information. All of this is fine, but what about knowledge?
One of the original reasons texts were marked up was to facilitate analysis. Researchers wanted to extract meaning from texts. One way to do that is to do computational analysis against text. To facilitate computational analysis people thought is was necessary for essential characteristics of a text to be delimited. (It is/was thought computers could not really do natural language processing.) How many paragraphs exists? What are the names in a text? What about places? What sorts of quantitative data can be statistically examined? What main themes does the text include? All of these things can be marked-up in a text and then counted (analyzed).
Now that you have marked up sets of letters with persname elements, you can use XPath to not only find persname elements but count them as well. Which document contains the most persnames? What are the persnames in each document. Tabulate their frequency. Do this over a set of documents to look for trends across the corpus. This is only a beginning, but entirely possible given the work you have already done.
Libraries do not facilitate enough quantitative analysis against our content. Marking things up in XML is a good start, but lets go to the next step. Let’s figure out how the profession can move its readership from discovery to analysis — towards use & understand.
2016-01-06T18:05:55+00:00 Mini-musings: Mr. Serials continues http://infomotions.com/blog/2016/01/mr-serials/The (ancient) Mr. Serials Process continues to support four mailing list archives, specifically, the archives of ACQNET, Colldv-l, Code4Lib, and NGC4Lib, and this posting simply makes the activity explicit.
 Mr. Serials is/was a process I developed quite a number of years ago as a method for collecting, organizing, archiving electronic journals (serials). The process worked well for a number of years, until electronic journals were no longer distributed via email. Now-a-days, Mr. Serials only collects the content of a few mailing lists. That’s okay. Things change. No big deal.
On the other hand, from a librarian’s and archivist’s point-of-view, it is important to collect mailing list content in its original form — email. Email uses the SMTP protocol. The communication sent back and forth, between email server and client, is well-structured albiet becoming verbose. Probably “the” standard for saving email on a file system is called mbox. Given a mbox file, it is possible to use any number of well-known applications to read/write mbox data. Heck, all you need is a text editor. Increasingly, email archives are not available from mailing list applications, and if they are, then they are available only to mailing list administrators and/or in a proprietary format. For example, if you host a mailing list on Google, can you download an archive of the mailing list in a form that is easily and universally readable? I think not.
Mr. Serials circumvents this problem. He subscribes to mailing lists, saves the incoming email to mbox files, and processes the mbox files to create searchable/browsable interfaces. The interfaces are not hugely aesthetically appealing, but they are more than functional, and the source files are readily available. Just ask.
Most recently both the ACQNET and Colldv-l mailing lists moved away from their hosting institutions to servers hosted by the American Library Association. This has not been the first time these lists have moved. It probably won’t be the last, but since Mr. Serials continues subscribe to these lists, comprehensive archives persevere. Score a point for librarianship and the work of archives. Long live Mr. Serials.
2016-01-06T16:42:37+00:00 Mini-musings: Re-MARCable http://infomotions.com/blog/2015/11/re-marcable/This blog posting contains: 1) questions/statements about MARC and posted by graduate library school students taking an online XML class I’m teaching this semester, and 2) my replies. Considering my previously published blog posting, you might say this posting is “re-MARCable”.
I’m having some trouble accessing the file named data.marc for the third question in this week’s assignment. It keeps opening in word and all I get is completely unreadable. Is there another way of going about finding the answer for that particular question?
Okay. I have to admit. I’ve been a bit obtuse about the MARC file format.
MARC is/was designed to contain ASCII characters, and therefore it ought to be human-readable. MARC does not contain binary characters and therefore ought to be readable in text editors. DO NOT open the .marc file in your word processor. Use your text editor to open it up. If you have line wrap turned off, then you ought to see one very long line of ugly text. If you turn on line wrap, then you will see many lines of… ugly text. Attached (hopefully) is a screen shot of many MARC records loaded into my text editor. And I rhetorically ask, “How many records are displayed, and how do you know?”

I’m trying to get y’all to answer a non-rhetorical question asked against yourself, “Considering the state of today’s computer technology, how viable is MARC? What are the advantages and disadvantages of MARC?”
I am taking Basic Cataloging and Classification this semester, but we did not discuss octets or have to look at an actual MARC file. Since this is supposed to be read by a machine, I don’t think this file format is for human consumption which is why it looks scary.
[Student], you continue to be a resource for the entire class. Thank you.
Everybody, yes, you will need to open the .marc file in your text editor. All of the files we are creating in this class ought to be readable in your text editor. True and really useful data files ought to be text files so they can be transferred from application to application. Binary files are sometimes more efficient, but not long-lasting. Here in Library Land we are in it for the long haul. Text files are where it is at. PDF is bad enough. Knowing how to manipulate things in a text editor is imperative when it comes to really using a computer. Imperative!!! Everything on the Web is in plain text.
In any event, open the .marc file in your text editor. On a Macintosh that is Text Edit. On Windows it is NotePad or WordPad. Granted all of these particular text editors are rather brain-dead, but they all function necessarily. A better text editor for Macintosh is Text Wrangler, and for Windows is NotePad++. When you open the .marc file, it will look ugly. It will seem unreadable, but that is not the case at all. Instead, a person needs to know the “secret codes” of cataloging, as well as a bit of an obtuse data structure in order to make sense of the whole thing.
Okay. Octets. Such are 8-bit characters, as opposed to the 7-bit characters of ASCII enclosing. The use of 8-bit characters enabled Library Land to integrate characters such as ñ, é, or å into its data. And while Library Land was ahead of the game in this regard, it did not embrace Unicode when it came along:
Unicode is a computing industry standard for the consistent encoding, representation, and handling of text expressed in most of the world’s writing systems. Developed in conjunction with the Universal Character Set standard and published as The Unicode Standard, the latest version of Unicode contains a repertoire of more than 120,000 characters covering 129 modern and historic scripts, as well as multiple symbol sets. [1]
Nor did Library Land update its data when changes happened. Consequently, not only do folks outside Library Land need to know how to read and write MARC records (which they can’t), they also need to know and understand the weird characters encodings which we use. In short, the data of Library Land is not very easily readable by the wider community, let alone very many people within our own community. Now that is irony. Don’t you think so!? Our data is literally and figuratively stuck in 1965, and we continue to put it there.
Professor, is this data.marc file suppose to be read only by a machine as [a fellow classmate] suggested?
Only readable by a computer? The answer is both no and yes.
Any data file intended to be shared between systems (sets of applications) ought to be saved as plain text in order to facilitate transparency and eliminate application monopolies/tyrannies. Considering the time when MARC was designed, it fulfilled these requirements. The characters were 7-bits long (ASCII), the MARC codes were few and far between, and its sequential nature allowed it to be shipped back and forth on things like tape or even a modem. (“Remember modems?”) Without the use of an intermediary computer program, is is entirely possible to read and write a MARC records with a decent text editor. So, the answer is “No, MARC is not only readable by a machine.”
On the other hand, considering how much extra data (“information”) the profession has stuffed into MARC data structure, it is really really hard to edit MARC records with a text editor. Library Land has mixed three things into a single whole: data, presentation, and data structure. This is really bad when it comes to computing. For example, a thing may have been published in 1542, but the cataloger is not certain of this date. Consequently, they will enter a data value of [1542]. Well, that is not a date (a number), but rather a string (a word). To make matters worse, the cataloger may think the date (year) of publication is within a particular decade but not exactly sure, and the date may be entered like as [154?]. Ack! Then let’s get tricky and add a copyright notation to a more recent but uncertain date — [c1986]. Does it never end? Then lets’ talk about the names of people. The venerable Fred Kilgour — founder of OCLC — is denoted in cataloging rules as Kilgour, Fred. Well, I don’t think Kilgour, Fred ever backwards talked so make sure his ideas sortable. Given the complexity of cataloging rules, which never simplify, it is really not feasible to read and write MARC records without an intermediate computer program. So, on the other hand, “Yes, an intermediary computer is necessary.” But if this is true, then why don’t catalogers know to read and write MARC records? The answer lies in what I said above. We have mixed three things into a single whole, and that is a really bad idea. We can’t expect catalogers to be computer programmers too.
The bottom line is this. Library Land automated its processes but it never really went to the next level and used computers to enhance library collections and services. All Library Land has done is used computers to facilitate library practice; Library Land has not embraced the true functionality of computers such as its ability to evaluate data/information. We have simply done the same thing. We wrote catalog cards by hand. We then typed catalog cards. We then used a computer to create them.
One more thing, Library Land simply does not have enough computer programmer types. Libraries build collections. Cool. Libraries provide services against the collections. Wonderful. This worked well (more or less) when libraries were physical entities in a localized environment. Now-a-days, when libraries are a part of a global network, libraries need to speak the global language, and that global language is spoken through computers. Computers use relational databases to organize information. Computers use indexes to make the information findable. Computers use well-structured Unicode files (such XML, JSON, and SQL files) to transmit information from one computer to another. In order to function, people who work in libraries (librarians) need to know these sorts of technologies in order to work on a global scale, but realistically speaking, what percentage of librarians, now how to do these thing, let alone know what they are? Probably less than 10%. It needs to be closer to 33%. Where 33% of the people build collections, 33% of the people provide services, and 33% of the people glue the work of the first 66% into a coherent whole. What to do with the remaining 1%? Call them “administrators”.
[1] Unicode – https://en.wikipedia.org/wiki/Unicode
2015-11-17T19:07:59+00:00 Mini-musings: MARC, MARCXML, and MODS http://infomotions.com/blog/2015/11/marc/
 This is the briefest of comparisons between MARC, MARCXML, and MODS. Its was written for a set of library school students learning XML.
MARC is an acronym for Machine Readable Cataloging. It was designed in the 1960’s, and its primary purpose was to ship bibliographic data on tape to libraries who wanted to print catalog cards. Consider the computing context of the time. There were no hard drives. RAM was beyond expensive. And the idea of a relational database had yet to be articulated. Consider the idea of a library’s access tool — the card catalog. Consider the best practice of catalog cards. “Generate no more than four or five cards per book. Otherwise, we will not be able to accommodate all of the cards in our drawers.” MARC worked well, and considering the time, it represented a well-designed serial data structure complete with multiple checksum redundancy.
Someone then got the “cool” idea to create an online catalog from MARC data. The idea was logical but grew without a balance of library and computing principles. To make a long story short, library principles sans any real understanding of computing principles prevailed. The result was a bloating of the MARC record to include all sorts of administrative data that never would have made it on to a catalog card, and this data was delimited in the MARC record with all sorts of syntactical “sugar” in the form of punctuation. Moreover, as bibliographic standards evolved, the previously created data was not updated, and sometimes people simply ignored the rules. The consequence has been disastrous, and even Google can’t systematically parse the bibliographic bread & butter of Library Land.* The folks in the archives community — with the advent of EAD — are so much better off.
Soon after XML was articulated the Library Of Congress specified MARCXML — a data structure designed to carry MARC forward. For the most part, it addressed many of the necessary issues, but since it insisted on making the data in a MARCXML file 100% transformable into a “traditional” MARC record, MARCXML falls short. For example, without knowing the “secret codes” of cataloging — the numeric field names — it is very difficult to determine what are the authors, titles, and subjects of a book.
The folks at the Library Of Congress understood these limitations almost from the beginning, and consequently they created an additional bibliographic standard called MODS — Metadata Object Description Schema. This XML-based metadata schema goes a long way in addressing both the computing times of the day and the needs for rich, full, and complete bibliographic data. Unfortunately, “traditional” MARC records are still the data structure ingested and understood by the profession’s online catalogs and “discovery systems”. Consequently, without a wholesale shift in practice, the profession’s intellectual content is figuratively stuck in the 1960’s.
* Consider the hodgepodge of materials digitized by Google and accessible in the HathiTrust. A search for Walden by Henry David Thoreau returns a myriad of titles, all exactly the same.
This is much more of an exercise than it is an assignment. The goal of the activity is not to get correct answers but instead to provide a framework for the reader to practice critical thinking against some of the bibliographic standards of the library profession. To the best of your ability, and in the form of an written essay between 500 and 1000 words long, answer and address the following questions based on the contents of the given .zip file:
These are “sum reflextions” on travel; travel is a good thing, for many reasons.
 I am blogging in front of the Pantheon. Amazing? Maybe. Maybe not. But the ability to travel, see these sorts of things, experience the different languages and cultures truly is amazing. All too often we live in our own little worlds, especially in the United States. I can’t blame us too much. The United States is geographically large. It borders only two other countries. One country speaks Spanish. The other speaks English and French. While the United States is the proverbial “melting pot”, there really isn’t very much cultural diversity in the United States, not compared to Europe. Moreover, the United States does not nearly have the history of Europe. For example, I am sitting in front of a building that was build before the “New World” was even considered as existing. It doesn’t help that the United States’ modern version of imperialism tends to make “United Statesians” feel as if they are the center of the world. I guess, that is some ways, it is not much different than Imperial Rome. “All roads lead to Rome.”
As you may or may not know, I have commenced upon a sort of leave of absence from my employer. In the past six weeks I have moved all of belongings to a cabin in a remote part of Indiana, and I have moved myself to Chicago. From there I began a month-long adventure. It began in Tuscany where I painted and deepened my knowledge of Western art history. I spent a week in Venice where I did more painting, walked up to my knees in water because the streets flooded, and I experienced Giotto’s frescos in Padua. For the past week I experienced Rome and did my best to actively participate in a users group meeting called ADLUG — the remnants of a user’s group meeting surrounding one of the very first integrated library systems — Dobris Libris. I also painted and rode a bicycle along the Appian Way. I am now on my way to Avignon where I will take a cooking class and continue on a “artist’s education”.
 Travel is not easy. It requires a lot of planning and coordination. “Where will I be when, and how will I get there? Once I’m there, what am I going to do, and how will I make sure things don’t go awry?” In this way, travel is not for the fient of heart, especially when venturing into territory where you do not know the language. It can be scary. Nor is travel inexpensive. One needs to maintain two households.
Travel is a kind of education that can not be gotten through the reading of books, the watching of television, nor discussion with other people. It is something that must be experienced first hand. Like sculpture, it is literally an experience that can only exist time & space in order to fully appreciate.
What does this have to do with librarianship? On one hand, nothing. On the other hand, everthing. From my perspective, librarianship is about a number of processes applied against a number of things. These processes include collection, organization, preservation, dissemination, and sometimes evaluation. The things of librarianship are data, information, knowledge, and sometimes wisdom. Even today, with the advent of our globally networked computers, the activities of librarianship remain essentially unchanged when compared to the activities of more than a hundred years ago. Libraries still curate collections, organize the collections into useful sets, provide access to the collections, and endeavor to maintain all of these services for the long haul.
Like most people and travel, many librarians (and people who work in libraries) do not have a true appreciation for the work of their colleagues. Sure, everybody applauds everybody else’s work, but have they actually walked in those other people’s shoes? The problem is most acute between the traditional librarians and the people who write computer programs for libraries. Both sets of people have the same goals; they both want to apply the same processes to the same things, but their techniques for accomplishing those goals are disimilar. One wants to take a train to get where they are going, and other wants to fly. This must change lest the profession become even less relevant.
 What is the solution? In a word, travel. People need to mix and mingle with the other culture. Call it cross-training. Have the computer programmer do some traditional cataloging for a few weeks. Have the cataloger learn how to design, implement, and maintain a relational database. Have the computer programmer sit at the reference desk for a while in order to learn about service. Have the reference librarian work with the computer programmer and learn how to index content and make it searchable. Have the computer programmer work in an archive or conservatory making books and saving content in gray cardboard boxes. Have the archivist hang out with computer programmer and learn how content is backed up and restored.
How can all this happen? In my opinion, the most direct solution is advocacy from library administration. Without the blessing of library administration everybody will say, “I don’t have time for such ‘travel’.” Well, library work is never done, and time will need to be carved out and taken from the top, like retirement savings, in order for such trips abroad to come to fruition.
The waiters here at my cafe are getting restless. I have had my time here, and it is time to move on. I will come back, probably in the Spring, and I’ll stay longer. In the meantime, I will continue with my own personal education.
2015-10-25T11:31:16+00:00 Mini-musings: What is old is new again http://infomotions.com/blog/2015/10/old-is-new/The “how’s” of librarianship are changing, but not the “what’s”.
(This is an outline for my presentation given at the ADLUG Annual Meeting in Rome (October 21, 2015). Included here are also the one-page handout and slides, both in the form of PDF documents.)
Linked Data is a method of describing objects, and these objects can be the objects in a library. In this way, Linked Data is a type of bibliographic description.
Linked Data is a manifestation of the Semantic Web. It is an interconnection of virtual sentences known as triples. Triples are rudimentary data structures, and as the name implies, they are made of three parts: 1) subjects, 2) predicates, and 3) objects. Subjects always take the form of a URI (think “URL”), and they point to things real or imaginary. Objects can take the form of a URI or a literal (think “word”, “phrase” or “number”). Predicates also take the form of a URI, and they establish relationships between subjects and objects. Sets of predicates are called ontologies or vocabularies and they present the languages of Linked Data.

Through the curation of sets of triples, and through the re-use of URIs, it is often possible to make explicit assuming information and new knowledge.
There are an increasing number of applications enabling libraries to transform and convert their bibliographic data into Linked Data. One such application is called the ALIADA.
When & if the intellectual content of libraries, archives, and museums is manifested as Linked Data, then new relationships between resources will be uncovered and discovered. Consequently, one of the purposes of cultural heritage institutions will be realized. Thus, Linked Data is a newer, more timely method of describing collections; what is old is new again.
The curation of collections, especially in libraries, does not have to be limited to physical objects. Increasingly new opportunities regarding the curation of digital objects represent a growth area.
With the advent of the Internet there exists an abundance of full-text digital objects just waiting to be harvested, collected, and cached. It is not good enough to link and point to such objects because links break and institutions (websites) dissolve.
Curating digital objects is not easy, and it requires the application of traditional library principles of preservation in order to be fulfilled. It also requires systematic organization and evaluation in order to be useful.
Done properly, there are many advantages to the curation of such digital collections: long-term access, analysis & evaluation, use & re-use, and relationship building. Examples include: the creation of institutional repositories, the creation of bibliographic indexes made up of similar open access journals, and the complete works of an author of interest.
In the recent past I have created “browsers” used to do “distant reading” against curated collections of materials from the HathiTrust, the EEBO-TCP, and JSTOR. Given a curated list of identifiers each of the browsers locally caches the full text of digital object object, creates a “catalog” of the collection, does full text indexing against the whole collection, and generates a set of reports based on the principles of text mining. The result is a set of both HTML files and simple tab-delimited text files enabling the reader to get an overview of the collection, query the collection, and provide the means for closer reading.

How can these tools be used? A reader could first identify the complete works of a specific author from the HathiTrust, say, Ralph Waldo Emerson. They could then identify all of the journal articles in JSTOR written about Ralph Waldo Emerson. Finally the reader could use the HathiTrust and JSTOR browsers to curate the full text of all the identified content to verify previously established knowledge or discover new knowledge. On a broader level, a reader could articulate a research question such as “What are some of the characteristics of early American literature, and how might some of its authors be compared & contrasted?” or “What are some of the definitions of a ‘great’ man, and how have these definitions changed over time?”
The traditional principles of librarianship (collection, organization, preservation, and dissemination) are alive and well in this digital age. Such are the “whats” of librarianship. It is the “hows” of the librarianship that need to evolve in order the profession to remain relevant. What is old is new again.
2015-10-22T10:40:09+00:00 Mini-musings: Painting in Tuscany http://infomotions.com/blog/2015/10/painting/As you may or may not know, I have commenced upon a sort of leave of absence from my employer, and I spent the last the better part of the last two weeks painting in Tuscany.
Me and eight other students arrived in Arezzo (Italy) on Wednesday, October 1, and we were greeted by Yves Larocque of Walk The Arts. We then spent the next ten days on a farm/villa very close to Singalunga (Italy) where we learned about color theory, how to mix colors, a bit of Western art history, and art theory. All the while we painted and painted and painted. I have taken a few art classes in my day and this was quite honestly the best one I’ve ever attended. It was thorough, individualized, comprehensive, and totally immersive. Painting in Tuscany was a wonderful way to commence a leave of absence. The process gave me a chance to totally get away, see things from a different vantage point, and begin an assessment.


What does this have to do with librarianship? I don’t know, yet. When I find out I’ll let you know.
2015-10-13T10:30:07+00:00 Mini-musings: My water collection predicts the future http://infomotions.com/blog/2015/09/water-predicts/As many of you may or may not know, I collect water, and it seems as if my water collection predicts the future, sort of.
 Since 1979 or so, I’ve been collecting water. [1] The purpose of the collection is/was enable me to see and experience different parts of the world whenever I desired. As the collection grew and my computer skills developed, I frequently used the water collection as a kind of Guinea pig for digital library projects. For example, my water collection was once manifested as a HyperCard Stack complete with the sound of running water in the background. For a while my water collection was maintained in a FileMaker database that generated sets of HTML. Quite a number of years ago I migrated everything to MySQL and embedded images of the water bottles in fields of the database. This particular implementation also exploited XML and XSLT to dynamically make the content available on the Web. (There was even some RDF output.) After that I included geographic coordinates into the database. This made it easy for me to create maps illustrating whence the water came. To date, there are about two hundred and fifty waters in my collection, but active collecting has subsided in the past few years.
But alas, this past year I migrated my co-located host to a virtual machine. In the process I moved all of my Web-based applications — dating back more than two decades — to a newer version of the LAMP stack, and in the process I lost only a single application — my water collection. I still have all the data, but the library used to integrate XSLT into my web server (AxKit) simply would not work with Apache 2.0, and I have not had the time to re-implement a suitable replacement.
Concurrently, I have been negotiating a two-semester long leave-of-absence from my employer. The “leave” has been granted and commenced a few of weeks ago. The purpose of the leave is two-fold: 1) to develop my skills as a librarian, and 2) to broaden my experience as a person. The first part of my leave is to take a month-long vacation, and that vacation begins today. For the first week I will paint in Tuscany. For the second week I will drink coffee in Venice. During the third week I will give a keynote talk at ADLUG in Rome. [2] Finally, during the fourth week I will learn how to make croissants in Provence. After the vacation is over I will continue to teach “XML 101” to library school graduate students at San Jose State University. [3] I will also continue to work for the University of Notre Dame on a set of three text mining projects (EEBO, JSTOR, and HathiTrust). [4, 5, 6]
As I was getting ready for my “leave” I was rooting through my water collection, and I found four different waters, specifically from: 1) Florence, 2) Venice, 3) Rome, and 4) Nice. As I looked at the dates of when the water was collected, I realized I will be in those exact same four places, on those exact same four days, exactly thirty-three years after I originally collected them. My water collection predicted my future. My water collection is a sort of model of me and my professional career. My water collection has sent me a number of signs.
This “leave-of-absence” (which in not really a leave nor a sabbatical, but instead a temporary change to adjunct faculty status) is a whole lot like going to college for the first time. “Where in the world am I going? What in the world am I going to do? Who in the world will I meet?” It is both exciting and scary at once and at the same time. It is an opportunity I would be foolish to pass up, but it is not as easy as you might imagine. That said, I guess I am presently an artist- and librarian-at-large. I think I need new, albeit temporary, business cards to proclaim my new title(s).
Wish me luck, and “On my mark. Get set. Go!”
Given a citations.xml file, this suite of software — the JSTOR Workset Browser — will cache and index content identified through JSTOR’s Data For Research service. The resulting (and fledgling) reports created by this suite enables the reader to “read distantly” against a collection of journal articles.
The suite requires a hodgepodge of software: Perl, Python, and the Bash Shell. Your milage may vary. Sample usage: cat etc/citations-thoreau.xml | bin/make-everything.sh thoreau
“Release early. Release often”.
2015-06-30T23:07:02+00:00 Life of a Librarian: Early English love was black & white http://sites.nd.edu/emorgan/2015/06/black-and-white/Apparently, when it comes to the idea of love during the Early English period, everything is black & white.
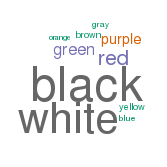 Have harvested the totality of the EEBO-TCP (Early English Books Online – Text Creation Partnership) corpus. Using an extraordinarily simple (but very effective) locally developed indexing system, I extracted all the EEBO-TCP identifiers whose content was cataloged with the word love. I then fed these identifiers to a suite of software which: 1) caches the EEBO-TCP TEI files locally, 2) indexes them, 3) creates a browsable catalog of them, 4) supports a simle full text search engine against them, and 5) reports on the whole business (below). Through this process I have employed three sets of “themes” akin to the opposite of stop (function) words. Instead of specifically eliminating these words from the analysis, I specifically do analysis based on these words. One theme is “big” names. Another theme is “great” ideas. The third them is colors: white, black, red, yellow, blue, etc. Based on the ratio of each item’s number of words compared the number of times specific color words appear, I can generate a word cloud of colors (or colours) words, and you can “see” that in terms of love, everything is black & white. Moreover, the “most colorful” item is entitled The whole work of love, or, A new poem, on a young lady, who is violently in love with a gentleman of Lincolns-Inn by a student in the said art. — a charming, one-page document whose first two lines are:
LOVE is a thing that’s not on Reaſon laid,
But upon Nature and her Dictates made.
The corpus of the EEBO-TCP is some of the cleanest data I’ve ever seen. The XML is not only well-formed, but conforms the TEI schema. The metadata is thorough, (almost) 100% complete, (usually) consistently applied. It comes with very effective stylesheets, and the content is made freely easily available in a number of places. It has been a real joy to work with!
An analysis of the corpus’s metadata provides an overview of what and how many things it contains, when things were published, and the sizes of its items:
Possible correlations between numeric characteristics of records in the catalog can be illustrated through a matrix of scatter plots. As you would expect, there is almost always a correlation between pages and number of words. Are others exist? For more detail, browse the catalog.
By counting and tabulating the words in each item of the corpus, it is possible to measure additional characteristics:
Perusing the list of all words in the corpus (and their frequencies) as well as all unique words can prove to be quite insightful. Are there one or more words in these lists connoting an idea of interest to you, and if so, then to what degree do these words occur in the corpus?
To begin to see how words of your choosing occur in specific items, search the collection.
Through the creation of locally defined “dictionaries” or “lexicons”, it is possible to count and tabulate how specific sets of words are used across a corpus. This particular corpus employs three such dictionaries — sets of: 1) “big” names, 2) “great” ideas, and 3) colors. Their frequencies are listed below:
The distribution of words (histograms and boxplots) and the frequency of words (wordclouds), and how these frequencies “cluster” together can be illustrated:
Based on the information above, the following items (and their associated links) are of possible interest:
 baxter
This page describes a corpus named baxter. It is a programmatically generated report against the full text of all the writing of Richard Baxter (a English Puritan church leader, poet, and hymn-writer) as found in Early English Books Online. It was created using a (fledgling) tool called the EEBO Workset Browser.
An analysis of the corpus’s metadata provides an overview of what and how many things it contains, when things were published, and the sizes of its items:
Possible correlations between numeric characteristics of records in the catalog can be illustrated through a matrix of scatter plots. As you would expect, there is almost always a correlation between pages and number of words. Are others exist? For more detail, browse the catalog.
By counting and tabulating the words in each item of the corpus, it is possible to measure additional characteristics:
Perusing the list of all words in the corpus (and their frequencies) as well as all unique words can prove to be quite insightful. Are there one or more words in these lists connoting an idea of interest to you, and if so, then to what degree do these words occur in the corpus?
To begin to see how words of your choosing occur in specific items, search the collection.
Through the creation of locally defined “dictionaries” or “lexicons”, it is possible to count and tabulate how specific sets of words are used across a corpus. This particular corpus employs three such dictionaries — sets of: 1) “big” names, 2) “great” ideas, and 3) colors. Their frequencies are listed below:
The distribution of words (histograms and boxplots) and the frequency of words (wordclouds), and how these frequencies “cluster” together can be illustrated:
Based on the information above, the following items (and their associated links) are of possible interest:
 emerson
This page describes a corpus named emerson, and it was programmatically created with a program called the HathiTrust Research Center Workset Browser.
An analysis of the corpus’s metadata provides an overview of what and how many things it contains, when things were published, and the sizes of its items:
Possible correlations between numeric characteristics of records in the catalog can be illustrated through a matrix of scatter plots. As you would expect, there is almost always a correlation between pages and number of words. Are others exist? For more detail, browse the catalog.
By counting and tabulating the words in each item of the corpus, it is possible to measure additional characteristics:
Perusing the list of all words in the corpus (and their frequencies) as well as all unique words can prove to be quite insightful. Are there one or more words in these lists connoting an idea of interest to you, and if so, then to what degree do these words occur in the corpus?
To begin to see how words of your choosing occur in specific items, search the collection.
Through the creation of locally defined “dictionaries” or “lexicons”, it is possible to count and tabulate how specific sets of words are used across a corpus. This particular corpus employs three such dictionaries — sets of: 1) “big” names, 2) “great” ideas, and 3) colors. Their frequencies are listed below:
The distribution of words (histograms and boxplots) and the frequency of words (wordclouds), and how these frequencies “cluster” together can be illustrated:
Based on the information above, the following items (and their associated links) are of possible interest:
 thoreau
This page describes a corpus named thoreau, and it was programmatically created with a program called the HathiTrust Research Center Workset Browser.
An analysis of the corpus’s metadata provides an overview of what and how many things it contains, when things were published, and the sizes of its items:
Possible correlations between numeric characteristics of records in the catalog can be illustrated through a matrix of scatter plots. As you would expect, there is almost always a correlation between pages and number of words. Are others exist? For more detail, browse the catalog.
By counting and tabulating the words in each item of the corpus, it is possible to measure additional characteristics:
Perusing the list of all words in the corpus (and their frequencies) as well as all unique words can prove to be quite insightful. Are there one or more words in these lists connoting an idea of interest to you, and if so, then to what degree do these words occur in the corpus?
To begin to see how words of your choosing occur in specific items, search the collection.
Through the creation of locally defined “dictionaries” or “lexicons”, it is possible to count and tabulate how specific sets of words are used across a corpus. This particular corpus employs three such dictionaries — sets of: 1) “big” names, 2) “great” ideas, and 3) colors. Their frequencies are listed below:
The distribution of words (histograms and boxplots) and the frequency of words (wordclouds), and how these frequencies “cluster” together can be illustrated:
Based on the information above, the following items (and their associated links) are of possible interest:
I have begun creating a “browser” against content from EEBO-TCP in the same way I have created a browser against worksets from the HathiTrust. The goal is to provide “distant reading” services against subsets of the Early English poetry and prose. You can see these fledgling efforts against a complete set of Richard Baxter’s works. Baxter was an English Puritan church leader, poet, and hymn-writer. [1, 2, 3]
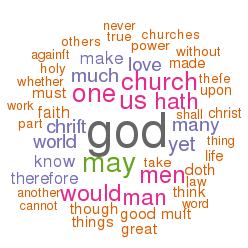 EEBO is an acronym for Early English Books Online. It is intended to be a complete collection of English literature between 1475 through to 1700. TCP is an acronym for Text Creation Partnership, a consortium of libraries dedicated to making EEBO freely available in the form of XML called TEI (Text Encoding Initiative). [4, 5]
The EEBO-TCP initiative is releasing their efforts in stages. The content of Stage I is available from a number of (rather hidden) venues. I found the content on a University Michigan Box site to be the easiest to use, albiet not necessarily the most current. [6] Once the content is cached — in the fullest of TEI glory — it is possible to search and browse the collection. I created a local, terminal-only interface to the cache and was able to exploit authority lists, controlled vocabularies, and free text searching of metadata to create subsets of the cache. [7] The subsets are akin to HathiTrust “worksets” — items of particular interest to me.
Once a subset was identified, I was able to mirror (against myself) the necessary XML files and begin to do deeper analysis. For example, I am able to create a dictionary of all the words in the “workset” and tabulate their frequencies. Baxter used the word “god” more than any other, specifically, 65,230 times. [8] I am able to pull out sets of unique words, and I am able to count how many times Baxter used words from three sets of locally defined “lexicons” of colors, “big” names, and “great” ideas. Furthermore, I am be to chart and graph trends of the works, such as when they were written and how they cluster together in terms of word usage or lexicons. [9, 10]
I was then able to repeat the process for other subsets, items about: lutes, astronomy, Unitarians, and of course, Shakespeare. [11, 12, 13, 14]
The EEBO-TCP Workset Browser is not as mature as my HathiTrust Workset Browser, but it is coming along. [15] Next steps include: calculating an integer denoting the number of pages in an item, implementing a Web-based search interface to a subset’s full text as well as metadata, putting the source code (written in Python and Bash) on GitHub. After that I need to: identify more robust ways to create subsets from the whole of EEBO, provide links to the raw TEI/XML as well as HTML versions of items, implement quite a number of cosmetic enhancements, and most importantly, support the means to compare & contrast items of interest in each subset. Wish me luck?
More fun with well-structured data, open access content, and the definition of librarianship.
Here some of developments with the playing of my EEBO (Early English Books Online) data.
 I used the repository on Box to get my content, and I mirrored it locally. [1, 2] I then looped through the content using XPath to extract rudimentary metadata, thus creating a “catalog” (index). Along the way I calculated the number of words in each document and saved that as a field of each “record”. Being a tab-delimited file, it is trivial to import the catalog into my favorite spreadsheet, database, editor, or statistics program. This allowed me to browse the collection. I then used grep to search my catalog, and save the results to a file. I searched for Richard Baxter. [6, 7, 8]. I then used an R script to graph the numeric data of my search results. Currently, there are only two types: 1) dates, and 2) number of words. [9, 10, 11, 12] From these graphs I can tell that Baxter wrote a lot of relatively short things, and I can easily see when he published many of his works. (He published a lot around 1680 but little in 1665.) I then transformed the search results into a browsable HTML table. The table has hidden features. (Can you say, “Usability?”) For example, you can click on table headers to sort. This is cool because I want sort things by number of words. (Number of pages doesn’t really tell me anything about length.) There is also a hidden link to the left of each record. Upon clicking on the blank space you can see subjects, publisher, language, and a link to the raw XML.
For a good time, I then repeated the process for things Shakespeare and things astronomy. [14, 15] Baxter took me about twelve hours worth of work, not counting the caching of the data. Combined, Shakespeare and astronomy took me less than five minutes. I then got tired.
My next steps are multi-faceted and presented in the following incomplete unordered list:
Fun with TEI/XML, text mining, and the definition of librarianship.
I have started adding visualizations literally illustrating the characteristics of the various “catalogs” generated by the HathiTrust Workset Browser. These graphics (box plots, histograms, and scatter plots) make it easier to see what is in the catalog and the features of the items it contains.
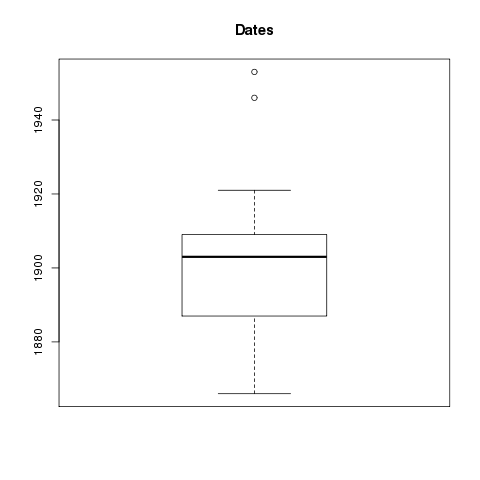

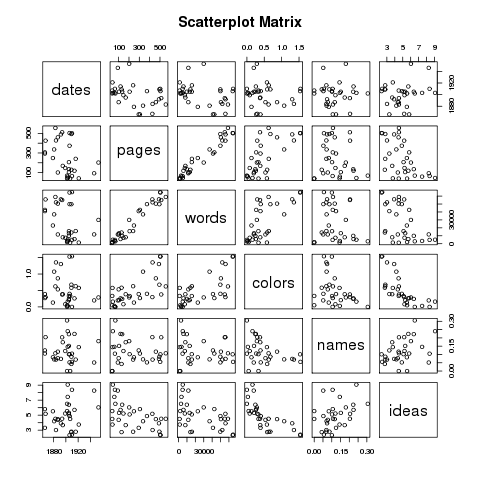
For example, read the “about page” reporting on the complete works of Henry David Thoreau. For more detail, see the “home page” on GitHub.
2015-06-05T01:12:54+00:00 Life of a Librarian: HathiTrust Workset Browser on GitHub http://sites.nd.edu/emorgan/2015/06/browser-on-github/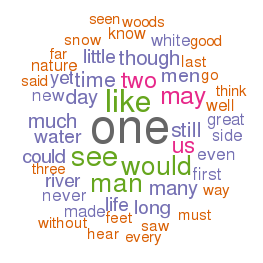 I have put my (fledgling) HathiTrust Workset Browser on GitHub. Try:
The Browser is a tool for doing “distant reading” against HathiTrust “worksets”. Given a workset rsync file, it will cache the workset’s content locally, index it, create some reports against the content, and provide the means to search/browse the collection. It should run out of the box on Linux and Macintosh computers. It requires the bash shell and Python, which come for free on these operating systems. Some sample content is available at:
Developing code with and through GitHub is interesting. I’m learning.
2015-06-03T02:17:08+00:00 Life of a Librarian: HathiTrust Resource Center Workset Browser http://sites.nd.edu/emorgan/2015/05/htrc-workset-browser/In my copious spare time I have hacked together a thing I’m calling the HathiTrust Research Center Workset Browser, a (fledgling) tool for doing “distant reading” against corpora from the HathiTrust. [1]
The idea is to: 1) create, refine, or identify a HathiTrust Research Center workset of interest — your corpus, 2) feed the workset’s rsync file to the Browser, 3) have the Browser download, index, and analyze the corpus, and 4) enable to reader to search, browse, and interact with the result of the analysis. With varying success, I have done this with a number of worksets ranging on topics from literature, philosophy, Rome, and cookery. The best working examples are the ones from Thoreau and Austen. [2, 3] The others are still buggy.
As a further example, the Browser can/will create reports describing the corpus as a whole. This analysis includes the size of a corpus measured in pages as well as words, date ranges, word frequencies, and selected items of interest based on pre-set “themes” — usage of color words, name of “great” authors, and a set of timeless ideas. [4] This report is based on more fundamental reports such as frequency tables, a “catalog”, and lists of unique words. [5, 6, 7, 8]

The whole thing is written in a combination of shell and Python scripts. It should run on just about any out-of-the-box Linux or Macintosh computer. Take a look at the code. [9] No special libraries needed. (“Famous last words.”) In its current state, it is very Unix-y. Everything is done from the command line. Lot’s of plain text files and the exploitation of STDIN and STDOUT. Like a Renaissance cartoon, the Browser, in its current state, is only a sketch. Only later will a more full-bodied, Web-based interface be created.
The next steps are numerous and listed in no priority order: putting the whole thing on GitHub, outputting the reports in generic formats so other things can easily read them, improving the terminal-based search interface, implementing a Web-based search interface, writing advanced programs in R that chart and graph analysis, provide a means for comparing & contrasting two or more items from a corpus, indexing the corpus with a (real) indexer such as Solr, writing a “cookbook” describing how to use the browser to to “kewl” things, making the metadata of corpora available as Linked Data, etc.
‘Want to give it a try? For a limited period of time, go to the HathiTrust Research Center Portal, create (refine or identify) a collection of personal interest, use the Algorithms tool to export the collection’s rsync file, and send the file to me. I will feed the rsync file to the Browser, and then send you the URL pointing to the results. [10] Let’s see what happens.
Fun with public domain content, text mining, and the definition of librarianship.
The purpose of this page is to explore and demonstrate some of the possibilities of marrying close and distant reading. By combining both of these processes there is a hope greater comprehension and understanding of a corpus can be gained when compared to using close or distant reading alone. (This text might also be republished at http://dh.crc.nd.edu/sandbox/thatcamp-2015/ as well as http://nd2015.thatcamp.org/2015/04/07/close-and-distant/.)
To give this exploration a go, two texts are being used to form a corpus: 1) Machiavelli’s The Prince and 2) Emerson’s Representative Men. Both texts were printed and bound into a single book (codex). The book is intended to be read in the traditional manner, and the layout includes extra wide margins allowing the reader to liberally write/draw in the margins. As the glue is drying on the book, the plain text versions of the texts were evaluated using a number of rudimentary text mining techniques and with the results made available here. Both the traditional reading as well as the text mining are aimed towards answering a few questions. How do both Machiavelli and Emerson define a “great” man? What characteristics do “great” mean have? What sorts of things have “great” men accomplished?
| Feature | The Prince | Representative Men |
|---|---|---|
| Author | Niccolò di Bernardo dei Machiavelli (1469 – 1527) | Ralph Waldo Emerson (1803 – 1882) |
| Title | The Prince | Representative Men |
| Date | 1532 | 1850 |
| Fulltext | plain text | HTML | PDF | TEI/XML | plain text | HTML | PDF | TEI/XML |
| Length | 31,179 words | 59,600 words |
| Fog score | 23.1 | 14.6 |
| Flesch score | 33.5 | 52.9 |
| Kincaid score | 19.7 | 11.5 |
| Frequencies | unigrams, bigrams, trigrams, quadgrams, quintgrams | unigrams, bigrams, trigrams, quadgrams, quintgrams |
| Parts-of-speech | nouns, pronouns, adjectives, verbs, adverbs | nouns, pronouns, adjectives, verbs, adverbs |
Search for “man or men” in The Prince. Search for “man or men” in Representative Men.
I observe this project to be a qualified success.
First, I was able to print and bind my book, and while the glue is still trying, I’m confident the final results will be more than usable. The real tests of the bound book are to see if: 1) I actually read it, 2) I annotate it using my personal method, and 3) if I am able to identify answers to my research questions, above.
 bookmaking tools |
 almost done |
Second, the text mining services turned out to be more of a compare & contrast methodology as opposed to a question-answering process. For example, I can see that one book was written hundreds of years before the other. The second book is almost twice as long and the first. Readability score-wise, Machiavelli is almost certainly written for the more educated and Emerson is easier to read. The frequencies and parts-of-speech are enumerative, but not necessarily illustrative. There are a number of ways the frequencies and parts-of-speech could be improved. For example, just about everything could be visualized into histograms or word clouds. The verbs ought to lemmatized. The frequencies ought to be depicted as ratios compared to the texts. Other measures could be created as well. For example, my Great Books Coefficient could be employed.
How do Emerson and Machiavelli define a “great” man. Hmmm… Well, I’m not sure. It is relatively easy to get “definitions” of men in both books (The Prince or Representative Men). And network diagrams illustrating what words are used “in the same breath” as the word man in both works are not very dissimilar:
 “man” in The Prince |
 “man” in Representative men |
I think I’m going to have to read the books to find the answer. Really.
Bunches o’ code was written to produce the reports:
You can download this entire project — code and all — from http://dh.crc.nd.edu/sandbox/thatcamp-2015/reports/thatcamp-2015.tar.gz or http://infomotions.com/blog/wp-content/uploads/2015/04/thatcamp-2015.tar.gz.
2015-04-12T16:47:07+00:00 Life of a Librarian: Text files http://sites.nd.edu/emorgan/2015/03/text-files/While a rose is a rose is a rose, a text file is not a text file is not a text file.
For better or for worse, we here in our text analysis workshop are dealing with three different computer operating systems: Windows, Macintosh, and Linux. Text mining requires the subject of its analysis to be in the form of plain text files. [1] But there is a subtle difference between the ways each of our operating systems expect to deal with “lines” in that text. Let me explain.
Imagine a classic typerwriter. A cylinder (called a “platten”) fit into a “carriage” designed to move back & forth across a box while “keys” were slapped against a piece of inked ribbon ultimately imprinting a character on a piece of paper rolled around the platten. As each key was pressed the platten moved a tiny bit from right to left. When the platten got to the left-most position, the operator was expected to manually move the platten back to the right-most postion and continue typing. This movement was really two movements in one. First, the carriage was “returned” to the right-most position, and second, the platten was rolled one line up. (The paper was “fed” around the platten by one line.) If one or the other of these two movements were not performed, then the typing would either run off the right-hand side of the paper, or the letters would be imprinted on top of the previously typed characters. These two movements are called “carriage returns” and “line feeds”, respectively.
Enter computers. Digital representations of characters were saved to files. These files are then sent to printers, but there is no person there to manually move the platten from left to right nor to roll the paper further into the printer. Instead, invisible characters were created. There are many invisible characters, and the two of most interest to us are carriage return (ASCII character 13) and line feed (sometimes called “new line” and ASCII character 10). [2] When the printer received these characters the platten moved accordingly.
Enter our operating systems. For better or for worse, traditionally each of our operating systems treat the definition of lines differently:
Go figure?
Macintosh is much more like Unix now-a-days, so most Macintosh text files use the Unix convention.
Windows folks, remember how your text files looked funny when initially displayed? This is because the original text files only contained ASCII 10 and not ASCII 13. Notepad, your default text editor, did not “see” line feed characters and consequently everything looked funny. Years ago, if a Macintosh computer read a Unix/Linux text file, then all the letters would be displayed on top of each other, even messier.
If you create a text file on your Windows or (older) Macintosh computer, and then you use these files as input to other programs (ie., wget -i ./urls.txt), then the operation may fail because the programs may not know how a line is denoted in the input.
Confused yet? In any event, text files are not text files are not text files. And the solution to this problem is to use full-featured text editor — the subject of another essay.
[1] plain text files explained – http://en.wikipedia.org/wiki/Plain_text
[2] intro’ to ASCII – http://www.theasciicode.com.ar
I have all but finished writing a hands-on text analysis workshop. From the syllabus:
The purpose of this 5-week workshop is to increase the knowledge of text mining principles among participants. By the end of the workshop, students will be able to describe the range of basic text mining techniques (everything from the creation of a corpus, to the counting/tabulating of words, to classification & clustering, and visualizing the results of text analysis) and have garnered hands-on experience with all of them. All the materials for this workshop are available online. There are no prerequisites except for two things: 1) a sincere willingness to learn, and 2) a willingness to work at a computer’s command line interface. Students are really encouraged to bring their own computers to class.
The workshop is divided into the following five, 90-minute sessions, one per week:
- Overview of text mining and working from the command line
- Building a corpus
- Word and phrase frequencies
- Extracting meaning with dictionaries, partsofspeech analysis, and named entity recognition
- Classification and topic modeling
For better or for worse, the workshop’s computing environment will be the Linux command line. Besides the usual command-line suspects, participants will get their hands dirty with wget, tika, a bit of Perl, a lot of Python, Wordnet, Treetagger, Standford’s Named Entity Recognizer, and Mallet.
For more detail, see the syllabus, sample code, and corpus.
2015-01-09T21:42:32+00:00 Life of a Librarian: distance.cgi – My first Python-based CGI script http://sites.nd.edu/emorgan/2015/01/distance/Yesterday I finished writing my first Python-based CGI script — distance.cgi. Given two words, it allows the reader to first disambiguate between various definitions of the words, and second, uses Wordnet’s network to display various relationships (distances) between the resulting “synsets”. (Source code is here.)
Reader input
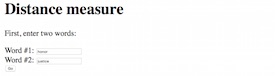
Disambiguate
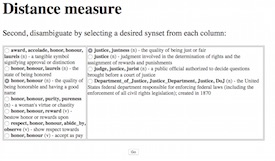
Display result
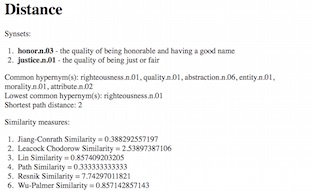
The script relies on Python’s Natural Language Toolkit (NLTK) which provides an enormous amount of functionality when it comes to natural language processing. I’m impressed. On the other hand, the script is not zippy, and I am not sure how performance can be improved. Any hints?
2015-01-09T21:10:41+00:00 Mini-musings: Great Books Survey http://infomotions.com/blog/2015/01/great-books-survey/I am happy to say that the Great Books Survey is still going strong. Since October of 2010 it has been answered 24,749 times by 2,108 people from people all over the globe. To date, the top five “greatest” books are Athenian Constitution by Aristotle, Hamlet by Shakespeare, Don Quixote by Cervantes, Odyssey by Homer, and the Divine Comedy by Dante. The least “greatest” books are Rhesus by Euripides, On Fistulae by Hippocrates, On Fractures by Hippocrates, On Ulcers by Hippocrates, On Hemorrhoids by Hippocrates. “Too bad Hippocrates”.

For more information about this Great Books of the Western World investigation, see the various blog postings.
2015-01-01T15:55:26+00:00 Life of a Librarian: My second Python script, dispersion.py http://sites.nd.edu/emorgan/2014/11/dispersion/This is my second Python script, dispersion.py, and it illustrates where common words appear in a text.
#!/usr/bin/env python2

# dispersion.py - illustrate where common words appear in a text
#
# usage: ./dispersion.py <file>

# Eric Lease Morgan <emorgan@nd.edu>
# November 19, 2014 - my second real python script; "Thanks for the idioms, Don!"


# configure
MAXIMUM = 25
POS     = 'NN'

# require
import nltk
import operator
import sys

# sanity check
if len( sys.argv ) != 2 :
  print "Usage:", sys.argv[ 0 ], "<file>"
  quit()

# get input
file = sys.argv[ 1 ]

# initialize
with open( file, 'r' ) as handle : text = handle.read()
sentences = nltk.sent_tokenize( text )
pos       = {}

# process each sentence
for sentence in sentences :

  # POS the sentence and then process each of the resulting words
  for word in nltk.pos_tag( nltk.word_tokenize( sentence ) ) :

    # check for configured POS, and increment the dictionary accordingly
    if word[ 1 ] == POS : pos[ word[ 0 ] ] = pos.get( word[ 0 ], 0 ) + 1

# sort the dictionary
pos = sorted( pos.items(), key = operator.itemgetter( 1 ), reverse = True )

# do the work; create a dispersion chart of the MAXIMUM most frequent pos words
text = nltk.Text( nltk.word_tokenize( text ) )
text.dispersion_plot( [ p[ 0 ] for p in pos[ : MAXIMUM ] ] )

# done
quit()
I used the program to analyze two works: 1) Thoreau’s Walden, and 2) Emerson’s Representative Men. From the dispersion plots displayed below, we can conclude a few things:
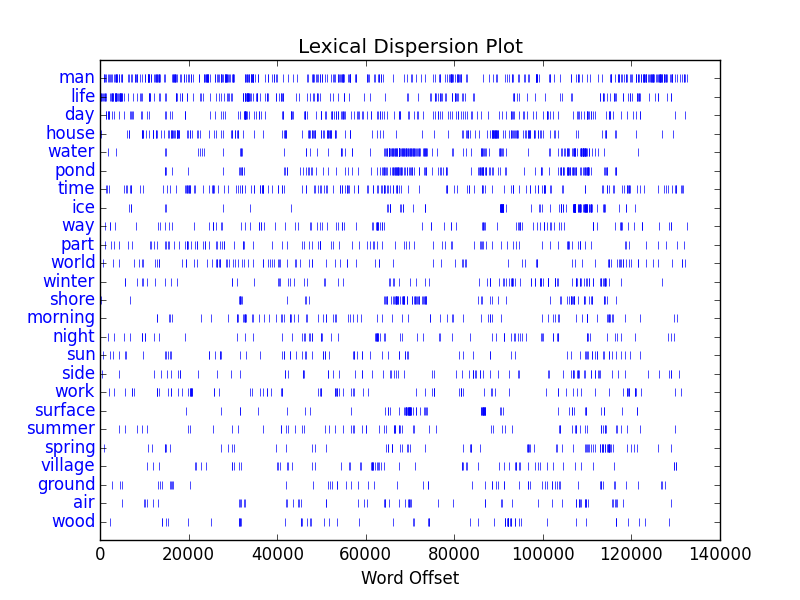
Thoreau’s Walden
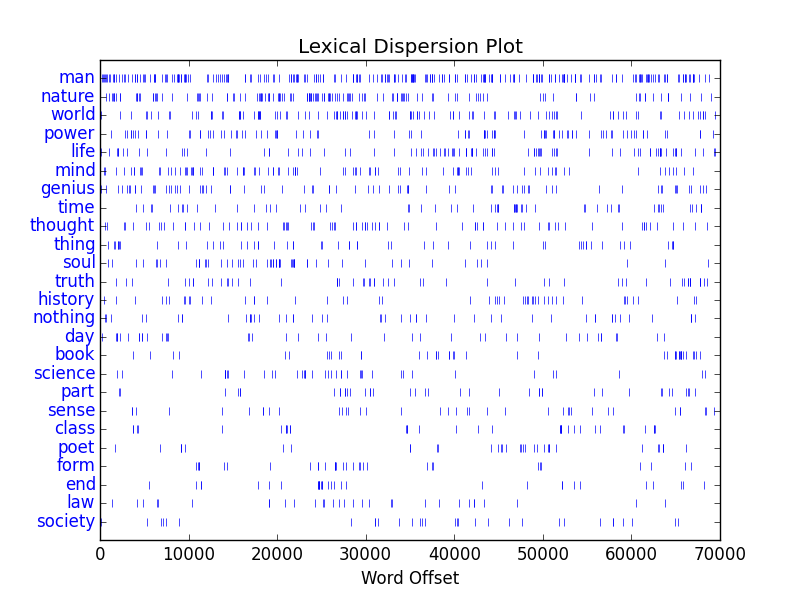
Emerson’s Representative Men
Python’s Natural Langauge Toolkit (NLTK) is a good library to get start with for digital humanists. I have to learn more though. My jury is still out regarding which is better, Perl or Python. So far, they have more things in common than differences.
2014-11-19T22:54:28+00:00 Life of a Librarian: My first R script, wordcloud.r http://sites.nd.edu/emorgan/2014/11/r/This is my first R script, wordcloud.r:
#!/usr/bin/env Rscript

# wordcloud.r - output a wordcloud from a set of files in a given directory

# Eric Lease Morgan <eric_morgan@infomotions.com>
# November 8, 2014 - my first R script!


# configure
MAXWORDS    = 100
RANDOMORDER = FALSE
ROTPER      = 0

# require
library( NLP )
library( tm )
library( methods )
library( RColorBrewer )
library( wordcloud )

# get input; needs error checking!
input <- commandArgs( trailingOnly = TRUE )

# create and normalize corpus
corpus <- VCorpus( DirSource( input[ 1 ] ) )
corpus <- tm_map( corpus, content_transformer( tolower ) )
corpus <- tm_map( corpus, removePunctuation )
corpus <- tm_map( corpus, removeNumbers )
corpus <- tm_map( corpus, removeWords, stopwords( "english" ) )
corpus <- tm_map( corpus, stripWhitespace )

# do the work
wordcloud( corpus, max.words = MAXWORDS, random.order = RANDOMORDER, rot.per = ROTPER )

# done
quit()
Given the path to a directory containing a set of plain text files, the script will generate a wordcloud.
Like Python, R has a library well-suited for text mining — tm. Its approach to text mining (or natural language processing) is both similar and dissimilar to Python’s. They are similar in that they both hope to provide a means for analyzing large volumes of texts. It is similar in that they use different underlying data structures to get there. R might be more for analytic person. Think statistics. Python may be more for the “literal” person, all puns intended. I will see if I can exploit the advantages of both.
2014-11-10T23:50:47+00:00 Life of a Librarian: My first Python script, concordance.py http://sites.nd.edu/emorgan/2014/11/python/Below is my first Python script, concordance.py:
#!/usr/bin/env python2

# concordance.py - do KWIK search against a text
#
# usage: ./concordance.py <file> <word>ph

# Eric Lease Morgan <emorgan@nd.edu>
# November 5, 2014 - my first real python script!


# require
import sys
import nltk

# get input; needs sanity checking
file = sys.argv[ 1 ]
word = sys.argv[ 2 ]

# do the work
text = nltk.Text( nltk.word_tokenize( open( file ).read( ) ) )
text.concordance( word )

# done
quit()
Given the path to a plain text file as well as a word, the script will output no more than twenty-five lines containing the given word. It is a keyword-in-context (KWIC) search engine, one of the oldest text mining tools in existence.
The script is my first foray into Python scripting. While Perl is cool (and “kewl”), it behooves me to learn the language of others if I expect good communication to happen. This includes others using my code and me using the code of others. Moreover, Python comes with a library (module) call the Natural Langauge Toolkit (NLTK) which makes it relatively easy to get my feet wet with text mining in this environment.
2014-11-10T21:43:41+00:00 Mini-musings: Doing What I’m Not Suppose To Do http://infomotions.com/blog/2014/10/doing/ I suppose I’m doing what I’m not suppose to do. One of those things is writing in books.
I’m attending a local digital humanities conference. One of the presenters described and demonstrated a program from MIT called Annotation Studio. Using this program a person can upload some text to a server, annotate the text, and share the annotations with a wider audience. Interesting!?
I then went for a walk to see an art show. It seems I had previously been to this art museum. The art was… art, but I did not find it beautiful. The themes were disturbing.
I then made it to the library where I tried to locate a copy of my one and only formally published book — WAIS And Gopher Servers. When I was here previously, I signed the book’s title page, and I came back to do the same thing. Alas, the book had been moved to remote storage.
I then proceeded to find another book in which I had written something. I was successful, and I signed the title page. Gasp! Considering the fact that no one had opened the book in years, and the pages were glued together I figured, “What the heck!”
Just as importantly, my contribution to the book — written in 1992 — was a short story called, “A day in the life of Mr. D“. It is an account of how computers would be used in the future. In it the young boy uses it to annotate a piece of text, and he gets to see the text of previous annotators. What is old is new again.
P.S. I composed this blog posting using an iPad. Functional but tedious.
2014-10-24T18:09:37+00:00 Readings: Hundredth Psalm to the Tune of "Green Sleeves": Digital Approaches to Shakespeare's Language of Genre http://muse.jhu.edu/journals/shakespeare_quarterly/v061/61.3.hope.html Provides a set of sound arguments for the use of computers to analyze texts, and uses DocuScope as an example. eye candy by Eric |
This essay provides an overview of linked open data (LOD) with a bent towards archivists. It enumerates a few advantages the archival community has when it comes to linked data, as well as some distinct disadvantages. It demonstrates one way to expose EAD as linked data through the use of XSLT transformations and then through a rudimentary triple store/SPARQL endpoint combination. Enhancements to the linked data publication process are then discussed. The text of this essay in the form of a handout as well as a number of support files is can also be found at http://infomotions.com/sandbox/lodlamday/.
The ultimate goal of LOD is to facilitate the discovery of new information and knowledge. To accomplish this goal, people are expected to make metadata describing their content available on the Web in one or more forms of RDF — Resource Description Framework. RDF is not so much a file format as a data structure. It is a collection of “assertions” in the form of “triples” akin to rudimentary “sentences” where the first part of the sentence is a “subject”, the second part is a “predicate”, and the third part is an “object”. Both the subjects and predicates are required to be Universal Resource Identifiers — URIs. (Think “URLs”.) The subject URI is intended to denote a person, place, or thing. The predicate URI is used to specify relationships between subjects and the objects. When verbalizing RDF assertions, it is usually helpful to prefix predicate URIs with a “is a” or “has a” phrase. For example, “This book ‘has a’ title of ‘Huckleberry Finn'” or “This university ‘has a’ home page of URL”. The objects of RDF assertions are ideally more URIs but they can also be “strings” or “literals” — words, phrases, numbers, dates, geo-spacial coordinates, etc. Finally, it is expected that the URIs of RDF assertions are shared across domains and RDF collections. By doing so, new assertions can be literally “linked” across the world of RDF in the hopes of establishing new relationships. By doing so new new information and new knowledge is brought to light.
Manifesting RDF from archival materials by hand is not an easy process because nobody is going to manually type the hundreds of triples necessary to adequately describe any given item. Fortunately, it is common for the description of archival materials to be manifested in the form of EAD files. Being a form of XML, valid EAD files must be well-formed and conform to a specific DTD or schema. This makes it easy to use XSLT to transform EAD files into various (“serialized”) forms of RDF such as XML/RDF, turtle, or JSON-LD. A few years ago such a stylesheet was written by Pete Johnston for the Archives Hub as a part of the Hub’s LOCAH project. The stylesheet outputs XML/RDF and it was written specifically for Archives Hub EAD files. It has been slightly modified here and incorporated into a Perl script. The Perl script reads the EAD files in a given directory and transforms them into both XML/RDF and HTML. The XML/RDF is intended to be read by computers. The HTML is intended to be read by people. By simply using something like the Perl script, an archive can easily participate in LOD. The results of these efforts can be seen in the local RDF and HTML directories. Nobody is saying the result is perfect nor complete, but it is more than a head start, and all of this is possible because the content of archives is often times described using EAD.
By definition, linked data (RDF) is structured data, and structured data lends itself very well to relational database applications. In the realm of linked data, these database applications are called “triple stores”. Database applications excel at the organization of data, but they are also designed to facilitate search. In the realm of relational databases, the standard query language is called SQL, and there is a similar query language for triples stores. It is called SPARQL. The term “SPARQL endpoints” is used denote a URL where SPARQL queries can be applied to a specific triple store.
4store is an open source triple store application which also supports SPARQL endpoints. Once compiled and installed, it is controlled and managed through a set of command-line applications. These applications support the sorts of things one expects with any other database application such as create database, import into database, search database, dump database, and destroy database. Two other commands turn on and turn off SPARQL endpoints.
For the purposes of LODLAM Training Day, a 4store triple store was created, filled with sample data, and made available as a SPARQL endpoint. If it has been turned on, then the following links ought to return useful information and demonstrating additional ways of publishing linked data:
SELECT DISTINCT ?o WHERE {?s a ?o} – a list of all the objects which are types of subjects. Useful for learning what types of things are described in any triple store.SELECT DISTINCT ?p WHERE {?s ?p ?o} – a list of all the predicates used in the triple store. Useful for learning how things are described in any triple store. If the ontologies used in the original RDF are well-documented, then by following the URIs (URLs) and reading the documentation found there, a person can use the previous two standard queries to understand the contents of any triple store. In this way, linked data (RDF) is self-documenting.SELECT ?title ?description ?url WHERE { ?s <http://xmlns.com/foaf/0.1/page> ?url . ?s <http://www.w3.org/2000/01/rdf-schema#label> ?title . ?s <http://data.archiveshub.ac.uk/def/scopecontent> ?description } order by ?title – a rudimentary bibliography of all finding aidsSELECT DISTINCT ?subject WHERE { ?s <http://purl.org/dc/terms/subject> ?uri . ?uri <http://www.w3.org/2000/01/rdf-schema#label> ?subject } ORDER BY ?subject – an alphabetical list of all the store’s subject headingsThe previous sections demonstrate the ease at which archival metadata can be published as linked data. These demonstrations are not the the be-all nor end-all of linked data the publication process. Additional techniques could be employed. Exploiting content negotiation in response to a given URI is an excellent example. Supporting alternative RDF serializations is another example. It behooves the archivist to provide enhanced views of the linked data, which are sometimes called “graphs”. The linked data can be combined with the linked data of other publishers to implement even more interesting services, views, and graphs. All of these things are advanced techniques requiring the skills of additional people (graphic designers, usability experts, computer programmers, systems administrators, allocators of time and money, project managers, etc.). Despite this, given the tools outlined above, it is not too difficult to publish linked data now and today. Such are the advantages.
On the other hand, there are at least two distinct disadvantages. The most significant derives from the inherent nature of archival material. Archival material is almost always rare or unique. Because it is rare and unique, there are few (if any) previously established URIs for the people and things described in archival collections. This is unlike the world of librarianship, where the materials of libraries are often owned my multiple institutions. Union catalogs share authority lists denoting people and institutions. Shared URIs across domains is imperative for the idea of the Semantic Web to come to fruition. The archival community has no such collection of shared URIs. Maybe the community-wide implementation and exploitation of Encoded Archival Context for Corporate Bodies, Persons, and Families (EAC-CPF) can help resolve this problem. After all, it too is a form of XML which lends itself very will to XSLT transformation.
Second, and almost as importantly, the use of EAD is not really the best way manifest archival metadata for linked data publication. EADs are finding aids. They are essentially narrative essays describing collections as a whole. They tell stories. The controlled vocabularies articulated in the header do not necessarily apply to each of the items in the container list. For good reasons, the items in the container list are minimally described. Consequently, the resulting RDF statement come across rather thin and poorly linked to fuller descriptions. Moreover, different archivists put different emphases on different aspect of EAD description. This makes amalgamated collections of archival linked data difficult to navigate; the linked data requires cleaning and normalization. The solution to these problems might be to create and maintain archival collections in database applications, such as ArchivesSpace, and have linked data published from there. By doing so the linked data publication efforts of the archival community would be more standardized and somewhat centralized.
This essay has outlined the ease at which archival metadata in the form of EAD can be easily published as linked data. The result is far from perfect, but a huge step in the right direction. Publishing linked data is not an event, but rather an iterative process. There is always room for improvement. Starting today, publish your metadata as linked data.
2014-08-16T14:56:10+00:00 Readings: Theme from Macroanalysis: Digital Methods and Literary History (Topics in the Digital Humanities) http://www.worldcat.org/oclc/829370513 This chapter describes the how's and why's of topic modeling.These are brief notes about my recent experiences with Koha.
 As you may or may not know, Koha is a grand daddy of library-related open source software, and it is an integrated library system to boot. Such are no small accomplishments. For reasons I will not elaborate upon, I’ve been playing with Koha for the past number of weeks, and in short, I want to say, “I’m impressed.” The community is large, international, congenial, and supportive. The community is divided into a number of sub-groups: developers, committers, commercial support employees, and, of course, librarians. I’ve even seen people from another open source library system (Evergreen) provide technical support and advice. For the most part, everything is on the ‘Net, well laid out, and transparent. There are some rather “organic” parts to the documentation akin to an “English garden”, but that is going to happen in any de-centralized environment. All in all, and without any patronizing intended, “Kudos to Koha!”
Looking through my collection of tarballs, I see I’ve installed Koha a number of times over the years, but this time it was challenging. Sparing you all the details, I needed to use a specific version of MySQL (version 5.5), and I had version 5.6. The installation failure was not really Koha’s fault. It is more the fault of MySQL because the client of MySQL version 5.6 outputs a warning message to STDOUT when a password is passed on the command line. This message confused the Koha database initialization process, thus making Koha unusable. After downgrading to version 5.5 the database initialization process was seamless.
My next step was to correctly configure Zebra — Koha’s default underlying indexer. Again, I had installed from source, and my Zebra libraries, etc. were saved in a directory different from the configuration files created by the Koha’s installation process. After correctly updating the value of modulePath to point to /usr/local/lib/idzebra-2.0/ in zebra-biblios-dom.cfg, zebra-authorities.cfg, zebra-biblios.cfg, and zebra-authorities-dom.cfg I could successfully index and search for content. I learned this from a mailing list posting.
Koha comes (for free) with a number of “extras”. For example, the Zebra indexer can be deployed as both a Z39.50 server as well as an SRU server. Turning these things on was as simple as uncommenting a few lines in the koha-conf.xml file and opening a few ports in my firewall. Z39.50 is inherently unusable from a human point of view so I didn’t go into configuring it, but it does work. Through the use of XSL stylesheets, SRU can be much more usable. Luckily I have been here before. For example, a long time ago I used Zebra to index my Alex Catalogue as well as some content from the HathiTrust (MBooks). The hidden interface to the Catalogue sports faceted searching and used to support spelling corrections. The MBooks interface transforms MARCXML into simple HTML. Both of these interfaces are quite zippy. In order to get Zebra to recognize my XSL I needed to add an additional configuration directive to my koha-conf.xml file. Specifically, I need to add a docpath element to my public server’s configuration. Once I re-learned this fact, implementing a rudimentary SRU interface to my Koha index was easy and results are returned very fast. I’m impressed.
My big goal is to figure out ways Koha can expose its content to the wider ‘Net. To this end sKoha comes with an OAI-PMH interface. It needs to be enabled, and can be done through the Koha Web-based backend under Home -> Koha Administration -> Global Preferences -> General Systems Preferences -> Web Services. Once enabled, OAI sets can be created through the Home -> Administration -> OAI sets configuration module. (Whew!) Once this is done Koha will respond to OAI-PMH requests. I then took it upon myself to transform the OAI output into linked data using a program called OAI2LOD. This worked seamlessly, and for a limited period of time you can browse my Koha’s cataloging data as linked data. The viability of the resulting linked data is questionable, but that is another blog posting.
Library catalogs (OPACs, “discovery systems”, whatever you want to call them) are not simple applications/systems. They are a mixture of very specialized inventory lists, various types of people with various skills and authorities, indexing, and circulation, etc. Then we — as librarians — add things like messages of the day, record exporting, browsable lists, visualizations, etc. that complicate the whole thing. It is simply not possible to create a library catalog in the “Unix way“. The installation of Koha was not easy for me. There are expenses with open source software, and I all but melted down my server during the installation process. (Everything is now back to normal.) I’ve been advocating open source software for quite a while, and I understand the meaning of “free” in this context. I’m not complaining. Really.
Now that I’ve gotten this far, my next step is to investigate the feasibility of using a different indexer with Koha. Zebra is functional. It is fast. It is multi-faceted (all puns intended). But configuring it is not straight-forward, and its community of support is tiny. I see from rooting around in the Koha source code that Solr has been explored. I have also heard through the grapevine that ElasticSearch has been explored. I will endeavor to explore these things myself and report on what I learn. Different indexers, with more flexible API’s may make the possibility of exposing Koha content as linked data more feasible as well.
Wish me luck.
2014-07-19T18:16:31+00:00 Readings: Matisse: "Jazz" http://www.desmoinesartcenter.org/webres/File/Gallery_Guides/Matisse%20G.G.web.pdf "Arguably one of the most beloved works of twentieth-century art, Henri Matisse's "Jazz" portfolio - with its inventiveness, spontaneity, and pure intensely pigmented color - projects a sense of joy and freedom." These are the gallery notes from an exhibit of Jazz at the Des Moines (Iowa) art museum.
 "Jazz (1947) is an artist's book of 250 prints for the folded book version and 100 impressions for the suite, which contains the unfolded pochoirs without the text, based on paper cutouts by Henri Matisse. Teriade, a noted 20th century art publisher, arranged to have Matisse's cutouts rendered as pochoir (stencil) prints."
 "In 1943, while convalescing from a serious operation, Henri Matisse began work on a set of collages to illustrate an, as yet, untitled and undecided text. This suite of twenty images, translated into "prints" by the stenciling of gouache paint, became known as Jazz---considered one of his most ambitious and important series of work." These are notes about the work Jazz by Matisse.
 This is mostly a set of notes to myself on lexicons and sentiment analysis.
A couple of weeks ago I asked Jeffrey Bain-Conkin to read at least one article about sentiment analysis (sometimes called “opinion mining”), and specifically I asked him to help me learn about the use of lexicons in such a process. He came back with a few more articles and a list of pointers to additional information. Thank you, Jeffrey! I am echoing the list here for future reference, for the possible benefit of others, and to remove some of the clutter from my to-do list. While I haven’t read and examined each of the items in great detail, just re-creating the list increases my knowledge. The list is divided into three sections: lexicons, software, and “more”.
What did I learn? I learned that to do sentiment analysis, lexicons are often employed. I learned that to evaluate a corpus for a particular sentiment, a researcher first needs to create a lexicon embodying that sentiment. Each element in the lexicon then needs to be assigned a quantitative value. The lexicon is then compared to the corpus tabulating the occurrences. Once tabulated, scores can then be summed, measurements taken, observations made and graphed, and conclusions/judgments made. Correct? Again, thank you, Jeffrey!
“Librarians love lists.”
2014-07-09T00:12:43+00:00 Life of a Librarian: What’s Eric Reading? http://sites.nd.edu/emorgan/2014/07/reading/I have resurrected an application/system of files used to archive and disseminate things (mostly articles) I’ve been reading. I call it What’s Eric Reading? From the original About page:
2014-07-04T01:36:11+00:00 Readings: Librarians And Scholars: Partners In Digital Humanities http://www.educause.edu/ero/article/librarians-and-scholars-partners-digital-humanitiesI have been having fun recently indexing PDF files.
For the pasts six months or so I have been keeping the articles I’ve read in a pile, and I was rather amazed at the size of the pile. It was about a foot tall. When I read these articles I “actively” read them — meaning, I write, scribble, highlight, and annotate the text with my own special notation denoting names, keywords, definitions, citations, quotations, list items, examples, etc. This active reading process: 1) makes for better comprehension on my part, and 2) makes the articles easier to review and pick out the ideas I thought were salient. Being the librarian I am, I thought it might be cool (“kewl”) to make the articles into a collection. Thus, the beginnings of Highlights & Annotations: A Value-Added Reading List.
The techno-weenie process for creating and maintaining the content is something this community might find interesting:
- Print article and read it actively.
- Convert the printed article into a PDF file — complete with embedded OCR — with my handy-dandy ScanSnap scanner.
- Use MyLibrary to create metadata (author, title, date published, date read, note, keywords, facet/term combinations, local and remote URLs, etc.) describing the article.
- Save the PDF to my file system.
- Use pdttotext to extract the OCRed text from the PDF and index it along with the MyLibrary metadata using Solr.
- Provide a searchable/browsable user interface to the collection through a mod_perl module.
Software is never done, and if it were then it would be called hardware. Accordingly, I know there are some things I need to do before I can truely deem the system version 1.0. At the same time my excitment is overflowing and I thought I’d share some geekdom with my fellow hackers.
Fun with PDF files and open source software.
"Libraries have numerous capabilities and considerable expertise available to accelerate digital humanities initiatives. The University of Michigan Library developed a model for effective partnership between libraries and digital humanities scholars; this model contributes to both a definition and redefinition of this emergent field. As the U-M experience shows, using the digital humanities as a key innovation tool can help libraries and their host institutions transform the way research, teaching, and learning are conceptualized. Several real-world examples illustrate the power of collaboration in providing win-win scenarios for both librarians and scholars in the advancement of scholarship."
This was an article mostly on "how we did good."
For a good time I have started to investigate how to index MARC data using ElasticSearch. This posting outlines some of my initial investigations and hacks.
ElasticSearch seems to be an increasingly popular indexer. Getting it up an running on my Linux host was… trivial. It comes withe a full-fledged Perl interface. Nice! Since ElasticSearch takes JSON as input, I needed to serialize my MARC data accordingly, and MARC::File::JSON seems to do a fine job. With this in hand, I wrote three programs:
I have some work to do, obviously. First of all, do I really want to index MARC in its raw, communications format? I don’t think so, but that is where I’ll start. Second, the search script doesn’t really search. Instead it simply gets all the records. This is because I really don’t know how to search yet; I don’t really know how to query fields like “245 subfield a”.
#!/usr/bin/perl

# configure
use constant INDEX => 'pamphlets';
use constant MARC  => './pamphlets.marc';
use constant MAX   => 100;
use constant TYPE  => 'marc';

# require
use MARC::Batch;
use MARC::File::JSON;
use Search::Elasticsearch;
use strict;

# initialize
my $batch = MARC::Batch->new( 'USMARC', MARC );
my $count = 0;
my $e     = Search::Elasticsearch->new;

# process each record in the batch
while ( my $record = $batch->next ) {

  # debug
  print $record->title, "\n";

  # serialize the record into json
  my $json = &MARC::File::JSON::encode( $record );

  # increment
  $count++;

  # index; do the work
  $e->index(  index   => INDEX,
                type    => TYPE,
                id      => $count,
                body    => { "$json" }
    );

  # check; only do a few
  last if ( $count > MAX );

}

# done
exit;# configure
use constant INDEX => 'pamphlets';
use constant TYPE => 'marc';
# require
use MARC::File::JSON;
use Search::Elasticsearch;
use strict;
# initialize
my $e = Search::Elasticsearch->new;
# get; do the work
my $doc = $e->get( index => INDEX,
type => TYPE,
id => $ARGV[ 0 ]
);
# reformat and output; done
my $record = MARC::Record->new_from_json( keys( $doc->{ '_source' } ) );
print $record->as_formatted, "\n";
exit;# configure
use constant INDEX => 'pamphlets';
# require
use MARC::File::JSON;
use Search::Elasticsearch;
use strict;
# initialize
my $e = Search::Elasticsearch->new;
# search
my $results = $e->search(
index => INDEX,
body => { query => { match_all => { $ARGV[ 0 ] } } }
);
# output
my $hits = $results->{ 'hits' }->{ 'hits' };
for ( my $i = 0; $i <= $#$hits; $i++ ) {
my $record = MARC::Record->new_from_json( keys( $$hits[ $i ]->{ '_source' } ) );
print $record->as_formatted, "\n\n";
}
# done
exit;
Last month a number of us from the Hesburgh Libraries attended a day-long workshop on data visualisation facilitated by Andy Kirk of Visualising Data. This posting documents some of the things I learned.
First and foremost, we were told there are five steps to creating data visualisations. From the handouts and supplemented with my own understanding, they include:
Here are a few meaty quotes:
One of my biggest take-aways was the juxtaposition of two spectrum: reading to feeling, and explaining to exploring. In other words, to what degree is the visualization expected to be read or felt, and to what degree is it offering the possibilities to explain or explore the data? Kirk illustrated the idea like this:
                read
                 .
                / \
                 |
                 |
   explain <-----+-----> explore
                 |
                 |
                \ /
                 .
                feel
The the reading/feeling spectrum reminded me of the usability book entitled Don’t Make Me Think. The explaining/exploring spectrum made me consider interactivity in visualisations.
I learned two other things along the way: 1) creating visualisations is a team effort requiring a constellation of skilled people (graphic designers, statisticians, content specialists, computer technologists, etc.), and 2) is it entirely plausible to combine more than one graphic — data set illustration — into a single visualisation.
Now I just need to figure out how to put these visualisation techniques into practice.
2014-06-17T00:05:57+00:00 Life of a Librarian: ORCID Outreach Meeting (May 21 & 22, 2014) http://sites.nd.edu/emorgan/2014/06/orcid/
 This posting documents some of my experiences at the ORCID Outreach Meeting in Chicago (May 21 & 22, 2014).
As you may or may now know, ORCID is an acronym for “Open Researcher and Contributor ID”.* It is also the name of a non-profit organization whose purpose is to facilitate the creation and maintenance of identifiers for scholars, researchers, and academics. From ORCID’s mission statement:
ORCID aims to solve the name ambiguity problem in research and scholarly communications by creating a central registry of unique identifiers for individual researchers and an open and transparent linking mechanism between ORCID and other current researcher ID schemes. These identifiers, and the relationships among them, can be linked to the researcher’s output to enhance the scientific discovery process and to improve the efficiency of research funding and collaboration within the research community.
A few weeks ago the ORCID folks facilitated a user’s group meeting. It was attended by approximately 125 people (mostly librarians or people who work in/around libraries), and some of the attendees came from as far away as Japan. The purpose of the meeting was to build community and provide an opportunity to share experiences.
The meeting itself was divided into number of panel discussions and a “codefest”. The panel discussions described successes (and failures) for creating, maintaining, enhancing, and integrating ORCID identifiers into workflows, institutional repositories, grant application processes, and information systems. Presenters described poster sessions, marketing materials, information sessions, computerized systems, policies, and politics all surrounding the implementation of ORCID identifiers. Quite frankly, nobody seemed to have a hugely successful story to tell because too few researchers seem to think there is a need for identifiers. I, as a librarian and information professional, understand the problem (as well as the solution), but outside the profession there may not seem to be much of a problem to be solved.
That said, the primary purpose of my attendance was to participate in the codefest. There were less than a dozen of us coders, and we all wanted to use the various ORCID APIs to create new and useful applications. I was most interested in the possibilities of exploiting the RDF output obtainable through content negotiation against an ORCID identifier, a la the command line application called curl:
curl -L -H "Accept: application/rdf+xml" http://orcid.org/0000-0002-9952-7800
Unfortunately, the RDF output only included the merest of FOAF-based information, and I was interested in bibliographic citations.
Consequently I shifted gears, took advantage of the ORCID-specific API, and I decided to do some text mining. Specifically, I wrote a Perl program — orcid.pl — that takes an ORCID identifier as input (ie. 0000-0002-9952-7800) and then:
For example, the following command will create a “bag of words” containing the content of all the writings associated with my ORCID identifier and have DOIs:
$ ./orcid.pl 0000-0002-9952-7800 > morgan.txt
Using this program I proceeded to create a corpus of files based on the ORCID identifiers of eleven Outreach Meeting attendees. I then used my “tiny text mining tools” to do analysis against the corpus. The results were somewhat surprising:
Ideally, the hack I wrote would allow a person to feed one or more identifiers to a system and output a report summarizing and analyzing the journal article content at a glance — a quick & easy “distant reading” tool.
I finished my “hack” in one sitting which gave me time to attend the presentations of the second day.
All of the hacks were added to a pile and judged by a vendor on their utility. I’m proud to say that Jeremy Friesen’s — a colleague here at Notre Dame — hack won a prize. His application followed the links to people’s publications, created a screen dump of the publications’ root pages, and made a montage of the result. It was a visual version of orcid.pl. Congratulations, Jeremy!
I’m very glad I attended the Meeting. I reconnected with a number of professional colleagues, and I my awareness of researcher identifiers was increased. More specifically, there seem to be a growing number of these identifiers. Examples for myself include:
And for a really geeky good time, I learned to create the following set of RDF triples with the use of these identifiers:
@prefix dc: <http://purl.org/dc/elements/1.1/> .
  <http://dx.doi.org/10.1108/07378831211213201> dc:creator
  "http://isni.org/isni/0000000035290715" ,
  "http://id.loc.gov/authorities/names/n94036700" ,
  "http://orcid.org/0000-0002-9952-7800" ,
  "http://viaf.org/viaf/26290254" ,
  "http://www.researcherid.com/rid/F-2062-2014" ,
  "http://www.scopus.com/authid/detail.url?authorId=25944695600" .
I learned about the (subtle) difference between an identifier and a authority control record. I learned of the advantages and disadvantages the various identifiers. And through a number of serendipitous email exchanges, I learned about ISNIs which are a NISO standard for identifiers and seemingly popular in Europe but relatively unknown here in the United States. For more detail, see the short discussion of these things in the Code4Lib mailing list archives.
Now might be a good time for some of my own grassroots efforts to promote the use of ORCID identifiers.
* Thanks, Pam Masamitsu!
** For a good time, try http://pub.orcid.org/0000-0002-9952-7800/orcid-works, or substitute your identifier to see a list of your publications.
*** The problem with splash screens is exactly what the very recent CrossRef Text And Data Mining API is designed to address.
2014-06-13T20:04:17+00:00 Life of a Librarian: CrossRef’s Text and Data Mining (TDM) API http://sites.nd.edu/emorgan/2014/06/tdm/
 A few weeks ago I learned that CrossRef’s Text And Data Mining (TDM) API had gone version 1.0, and this blog posting describes my tertiary experience with it.
A number of months ago I learned about Prospect, a fledgling API being developed by CrossRef. Its purpose was to facilitate direct access to full text journal content without going through the hassle of screen scraping journal article splash pages. Since then the API has been upgraded to version 1.0 and renamed the Text And Data Mining API. This is how the API is expected to be used:
What sorts of choices is one expected to make? Good question. First and foremost, a person is suppose to evaluate the license URI. If the URI points to a palatable license, then you may want to download the full text which seems to come in PDF and/or XML flavors. With version 1.0 of the API, I have discovered ORCID identifiers are included in the header. I believe these denote authors/contributors of the articles.
Again, all of this is based on the content of the HTTP links header. Here is an example header, with carriage returns added for readability:
<http://downloads.hindawi.com/journals/isrn.neurology/2013/908317.pdf>;
rel="http://id.crossref.org/schema/fulltext"; type="application/pdf"; version="vor",
<http://downloads.hindawi.com/journals/isrn.neurology/2013/908317.xml>;
rel="http://id.crossref.org/schema/fulltext"; type="application/xml"; version="vor",
<http://creativecommons.org/licenses/by/3.0/>; rel="http://id.crossref.org/schema/license";
version="vor", <http://orcid.org/0000-0002-8443-5196>; rel="http://id.crossref.org/schema/person",
<http://orcid.org/0000-0002-0987-9651>; rel="http://id.crossref.org/schema/person",
<http://orcid.org/0000-0003-4669-8769>; rel="http://id.crossref.org/schema/person"
I wrote a tiny Perl library — extractor.pl — used to do steps #1 through #3, above. It returns a reference to a hash containing the values in the links header. I then wrote three Perl scripts which exploit the library:
Here are a few comments. Myself, as a person who increasingly wants direct access to full text articles, the Text And Data Mining API is a step in the right direction. Now all that needs to happen is for publishers to get on board and feed CrossRef the URIs of full text content along the associated licensing terms. I found the links header to be a bit convoluted, but this is what programming libraries are for. I could not find a comprehensive description of what name/value combinations can exist in the links header. For example, the documentation alludes to beginning and ending dates. CrossRef seems to have a growing number of interesting applications and APIs which are probably going unnoticed, and there is an opportunity of some sort lurking in there. Specifically, somebody out to do something the text/turtle (RDF) output of the DOI resolutions.
‘More fun with HTTP and bibliographics.
2014-06-11T00:09:49+00:00 Readings: Ranking and extraction of relevant single words in text http://www.intechopen.com/books/brain_vision_and_ai/ranking_and_extraction_of_relevant_single_words_in_text Describes a technique for extracting the key (significant) words from a text"Stylometry provides powerful techniques for examining authorial style variation. This study uses several such techniques to explore the traditional distinction between James's early and late styles. They confirm this distinction, identify an intermediate style, and facilitate an analysis of the lexical character of James's style. Especially revealing are techniques that identify words with extremely variable frequencies across James's oeuvre-words that clearly characterize the various period styles. Such words disproportionately increase or decrease steadily throughout James's remarkably unidirectional stylistic development. Stylometric techniques constitute a promising avenue of research that exploits the power of corpus analysis and returns our attention to a manageable subset of an author's vocabulary."
I learned about various stlyometric techniques such as Delta, and to some degree PCA.
"The vast increase in online expressions of consumer sentiment offers a powerful new tool for studying consumer attitudes. To explore the narratives that consumers use to frame positive and negative sentiment online, we computationally investigate linguistic structure in 900,000 online restaurant reviews. Negative reviews, especially in expensive restaurants, were more likely to use features previously associated with narratives of trauma: negative emotional vocabulary, a focus on the past actions of third person actors such as waiters, and increased use of references to "we" and "us", suggesting that negative reviews function as a means of coping with service-related trauma. Positive reviews also employed framings contextualized by expense: inexpensive restaurant reviews use the language of addiction to frame the reviewer as craving fatty or starchy foods. Positive reviews of expensive restaurants were long narratives using long words emphasizing the reviewer's linguistic capital and also focusing on sensory pleasure. Our results demonstrate that portraying the self, whether as well-educated, as a victim, or even as addicted to chocolate, is a key function of reviews and suggests the important role of online reviews in exploring social psychological variables."
Very interesting use of lexicons. Bad restaurant reviews were associated with interpersonal interactions. Good reviews were associated with sensual pleasure.
 This posting describes how to turn off and on a thing called the jobs topic in the Code4Lib mailing list.
Code4Lib is a mailing list whose primary focus is computers and libraries. Since its inception in 2004, it has grown to include about 2,800 members from all around the world but mostly from the United States. The Code4Lib community has also spawned an annual conference, a refereed online journal, its own domain, and a growing number of regional “franchises”.
The Code4Lib community has also spawned job postings. Sometimes these job postings flood the mailing list, and while it is entirely possible use mail filters to exclude such postings, there is also “more than one way to skin a cat”. Since the mailing list uses the LISTSERV software, the mailing list has been configured to support the idea of “topics“, and through this feature a person can configure their subscription preferences to exclude job postings. Here’s how. By default every subscriber to the mailing list will get all postings. If you want to turn off getting the jobs postings, then email the following command to listserv@listserv.nd.edu:
If you want to turn on the jobs topic and receive the notices, then email the following command to listserv@listserv.nd.edu:
Sorry, but if you subscribe to the mailing list in digest mode, then the topics command has no effect; you will get the job postings no matter what.
HTH.
Special thanks go to Jodi Schneider and Joe Hourcle who pointed me in the direction of this LISTSERV functionality. Thank you!
2014-05-15T20:59:09+00:00 LiAM: Linked Archival Metadata: Linked Archival Metadata: A Guidebook (version 0.99) http://sites.tufts.edu/liam/2014/04/24/version-099/I have created and made availble 0.99 of Linked Archival Metadata: A Guidebook. It is distributed here in two flavors: PDF and ePub (just because I can). From the Executive Summary:
Linked data is a process for embedding the descriptive information of archives into the very fabric of the Web. By transforming archival description into linked data, an archivist will enable other people as well as computers to read and use their archival description, even if the others are not a part of the archival community. The process goes both ways. Linked data also empowers archivists to use and incorporate the information of other linked data providers into their local description. This enables archivists to make their descriptions more thorough, more complete, and more value-added. For example, archival collections could be automatically supplemented with geographic coordinates in order to make maps, images of people or additional biographic descriptions to make collections come alive, or bibliographies for further reading.
Publishing and using linked data does not represent a change in the definition of archival description, but it does represent an evolution of how archival description is accomplished. For example, linked data is not about generating a document such as EAD file. Instead it is about asserting sets of statements about an archival thing, and then allowing those statements to be brought together in any number of ways for any number of purposes. A finding aid is one such purpose. Indexing is another purpose. For use by a digital humanist is anther purpose. While EAD files are encoded as XML documents and therefore very computer readable, the reader must know the structure of EAD in order to make the most out of the data. EAD is archives-centric. The way data is manifested in linked data is domain-agnostic.
The objectives of archives include collection, organization, preservation, description, and often times access to unique materials. Linked data is about description and access. By taking advantages of linked data principles, archives will be able to improve their descriptions and increase access. This will require a shift in the way things get done but not what gets done. The goal remains the same.
Many tools are ready exist for transforming data in existing formats into linked data. This data can reside in Excel spreadsheets, database applications, MARC records, or EAD files. There are tiers of linked data publishing so one does not have to do everything all at once. But to transform existing information or to maintain information over the long haul requires the skills of many people: archivists & content specialists, administrators & managers, metadata specialists & catalogers, computer programers & systems administrators.
Moving forward with linked data is a lot like touristing to Rome. There are many ways to get there, and there are many things to do once you arrive, but the result will undoubtably improve your ability to participate in the discussion of the human condition on a world wide scale.
Thank you’s go to all the people who provided feedback along the way. “Thanks!“
2014-04-24T18:08:59+00:00 LiAM: Linked Archival Metadata: Trends and gaps in linked data for archives http://sites.tufts.edu/liam/2014/04/23/trends/“A funny thing happened on the way to the forum.”
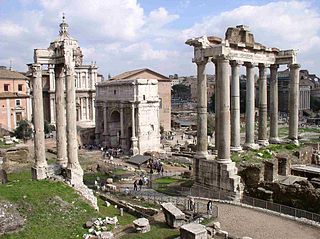 Two recent professional meetings have taught me that — when creating some sort of information service — linked data will reside and be mixed with data collected from any number of Internet sites. Linked data interfaces will coexist with REST-ful interfaces, or even things as rudimentary as FTP. To the archivist, this means linked data is not the be-all and end-all of information publishing. There is no such thing. To the application programmer, this means you will need to have experience with a ever-growing number of Internet protocols. To both it means, “There is more than one way to get there.”
In October of 2013 I had the opportunity to attend the Semantic Web In Libraries conference. It was a three-day event attended by approximately three hundred people who could roughly be divided into two equally sized groups: computer scientists and cultural heritage institution employees. The bulk of the presentations fell into two categories: 1) publishing linked data, and 2) creating information services. The publishers talked about ontologies, human-computer interfaces for data creation/maintenance, and systems exposing RDF to the wider world. The people creating information services were invariably collecting, homogenizing, and adding value to data gathered from a diverse set of information services. These information services were not limited to sets of linked data. They also included services accessible via REST-ful computing techniques, OAI-PMH interfaces, and there were probably a few locally developed file transfers or relational database dumps described as well. These people where creating lists of information services, regularly harvesting content from the services, writing cross-walks, locally storing the content, indexing it, providing services against the result, and sometimes republishing any number of “stories” based on the data. For the second group of people, linked data was certainly not the only game in town.
In February of 2014 I had the opportunity to attend a hackathon called GLAM Hack Philly. A wide variety of data sets were presented for “hacking” against. Some where TEI files describing Icelandic manuscripts. Some was linked data published from the British museum. Some was XML describing digitized journals created by a vendor-based application. Some of it resided in proprietary database applications describing the location of houses in Philadelphia. Some of it had little or no computer-readable structure and described plants. Some of it was the wiki mark-up for local municipalities. After the attendees (there were about two dozen of us) learned about each of the data sets we self-selected and hacked away at projects of our own design. The results fell into roughly three categories: geo-referencing objects, creating searchable/browsable interfaces, and data enhancement. With the exception of the hack repurposing journal content into visual art, the results were pretty typical for cultural heritage institutions. But what fascinated me was way us hackers selected our data sets. Namely, the more complete and well-structured the data the more hackers gravitated towards it. Of all the data sets, the TEI files were the most complete, accurate, and computer-readable. Three or four projects were done against the TEI. (Heck, I even hacked on the TEI files.) The linked data from the British Museum — very well structured but not quite as through at the TEI — attracted a large number of hackers who worked together for a common goal. All the other data sets had only one or two people working on them. What is the moral to the story? There are two of them. First, archivists, if you want people to process your data and do “kewl” things against it, then make sure the data is thorough, complete, and computer-readable. Second, computer programmers, you will need to know a variety of data formats. Linked data is not the only game in town.
The technologies described in this Guidebook are not the only way to accomplish the goals of archivists wishing to make their content more accessible. Instead, linked data is just one of many protocols in the toolbox. It is open, standards-based, and simpler rather than more complex. On the other hand, other protocols exist which have a different set of strengths and weaknesses. Computer technologists will need to have a larger rather than smaller knowledge of various Internet tools. For archivists, the core of the problem is still the collection and description of content. This — a what of archival practice — continues to remain constant. It is the how of archival practice — the technology — that changes at a much faster pace.
With great interest I read the Spring/Summer issue of Information Standards Quarterly entitled “Linked Data in Libraries, Archives, and Museums” where there were a number of articles pertaining to linked data in cultural heritage institutions. Of particular interest to me were the loosely enumerated challenges of linked data. Some of them included:
There are a number of challenges in the linked data process. Some of them are listed below, and some of them have been alluded to previously. Create useful linked data, meaning, create linked that links to other linked data. Linked data does not live in a world by itself. Remember, the “l” stands for “linked”. For example, try to include URIs that are the URIs used on other linked data sets. Sometimes this is not possible, for example, with the names of people in archival materials. When possible, they used VIAF, but other times they needed to create their own URI denoting an individual. There is a level of rigor involved in creating the data model, and there may be many discussions regarding semantics. For example, what is a creator? Or, when is a term intended to be an index term as opposed to a reference. When does one term in one vocabulary equal a different term in a different vocabulary? Balance the creation of your own vocabulary with the need to speak the language of others using their vocabulary. Consider “fixing” the data as it comes in or goes out because it might not be consistent nor thorough. Provenance is an issue. People — especially scholars — will want to know where the linked data came from and whether or not it is authoritative. How to solve or address this problem? The jury is still out on this one. Creating and maintaining linked data is difficult because it requires the skills of a number of different types of people. Computer programmers. Database designers. Subject experts. Metadata specialists. Archivists. Etc. A team is all but necessary.
Linked data represents a modern way of making your archival descriptions accessible to the wider world. In that light, it represents a different way of doing things but not necessary a different what of doing things. You will still be doing inventory. You will still be curating collections. You will still be prioritizing what goes and what stays.
Linked data makes a lot of sense, but there are some personnel and technological gaps needing to be filled before it can really and truly be widely adopted by archives (or libraries or museums). They include but are not limited to: hands-on training, “string2URI” tools, database to RDF interfaces, mass RDF editors, and maybe “killer applications”.
Different people learn in different ways, and hands-on training on what linked data is and how it can be put into practice would go a long way towards the adoption of linked data in archives. These hands-on sessions could be as short as an hour or as long as one or two days. They would include a mixture of conceptual and technological topics. For example, there could be a tutorial on how to search RDF triple stores using SPARQL. Another tutorial would compare & contrast the data models of databases with the RDF data model. A class could be facilitated on how to transform XML files (MARCXML, MODS, EAD) to any number of RDF serializations and publish the result on a Web server. There could be a class on how to design URIs. A class on how to literally draw an RDF ontology would be a good idea. Another class would instruct people on how to formally read & write an ontology using OWL. Yet another hands-on workshop would demonstrate to participants the techniques for creating, maintaining, and publishing an RDF triple store. Etc. Linked data might be a “good thing”, but people are going to need to learn how to work more directly with it. These hands-on trainings could be aligned with hack-a-thons, hack-fests, or THATCamps so a mixture of archivists, metadata specialists, and computer programmers would be in the same spaces at the same times.
There is a need for tools enabling people and computers to automatically associate string literals with URIs. If nobody (or relatively few people) share URIs across their published linked data, then the promises of linked data won’t come to fruition. Archivists (and librarians and people who work in museums) take things like controlled vocabularies and name authority lists very seriously. Identifying the “best” URI for a given thing, subject term, or personal name is something the profession is going to want to do and do well.
Fabian Steeg and Pascal Christoph at the 2013 Semantic Web in Libraries conference asked the question, “How can we benefit from linked data without being linked data experts?” Their solution was the creation of a set of tools enabling people to query a remote service and get back a list of URIs which were automatically inserted into a text. This is an example of a “string2URI” tool that needs to be written and widely adopted. These tools could be as simple as a one-box, one-button interface where a person enters a word for phrase and one or more URIs are returned for selection. A slightly more complicated version would include a drop-down menu allowing the person to select places to query for the URI. Another application suggested by quite a number of people would use natural language to first extract named entities (people, places, things, etc.) from texts (like abstracts, scope notes, biographical histories, etc.). Once these entities were extracted, they would then be fed to string2URI. The LC Linked Data Service, VIAF, and Worldcat are very good examples of string2URI tools. The profession needs more of them. SNAC’s use of EAC-CPF is a something to watch in this space.
There are distinct advantages and disadvantages of the current ways of creating and maintaining the descriptions of archival collections. They fill a particular purpose and function. Nobody is going to suddenly abandon well-known techniques for ones seemingly unproven. Consequenlty, there is a need to easily migrate existing data to RDF. One way towards this goal is to transform or export archival descriptions from their current containers to RDF. D2RQ could go a long way towards publishing the underlying databases of PastPerfect, Archon, Archivist’s Toolkit, or ArchivesSpace as RDF. A seemingly little used database to RDF modeling language — R2RML — could be used for similar purposes. These particular solutions are rather generic. Either a great deal of customizations needs to be done using D2RQ, or new interfaces to the underlying databases need to be created. Regarding the later, this will require a large amount of specialized work. An ontology & vocabulary would need to be designed or selected. The data and the structure of the underlying databases would need to be closely examined. A programmer would need to write reports against the database to export RDF and publish it in one form or another. Be forewarned. Software, like archival description, is never done. On the other hand, this sort of work could be done once and then shared with the wider archival community and then applied to local implementations of Archivist’s Toolkit, ArchivesSpace, etc.
Archivists curate physical collections as well as descriptions of those collections. Ideally, the descriptions would reside in a triple store as if it were a database. The store would be indexed. Queries could be applied against the store. Create, read, update, and delete operations could be easily done. As RDF is amassed it will almost definitely need to be massaged and improved. URIs may need to be equated. Controlled vocabulary terms may need to be related. Supplementary statements may need to be asserted enhancing the overall value of the store. String literals may need to be normalized or even added. This work will not be done on a one-by-one statement-by-statement basis. There are simply too many triples — 100′s of thousands, if not millions of them. Some sort of mass RDF editor will need to be created. If the store was well managed, and if a peson was well-versed in SPARQL, then much of this work could be done through SPARQL statements. But SPARQL is not for the faint of heart, and despite what some people say, it is not easy to write. Tools will need to be created — akin to the tools described by Diane Hillman and articulated through the experience with the National Science Foundation Digital Library — making it easy to do large-scale additions and updates to RDF triple stores.
To some degree, the idea of the Semantic Web and linked data has been oversold. We were told, “Make very large sets of RDF freely available and new relationships between resources will be discovered.” The whole thing smacks of artificial intelligence which simultaneously scares people and makes them laugh out loud. On the other hand, a close reading of Allemang’s and Hendler’s book Semantic Web For The Working Ontologist describes exactly how and why these new relationships can be discovered, but these discoveries do take some work and a significant volume of RDF from a diverse set of domains.
So maybe the “killer” application is not so much a sophisticated super-brained inference engine but something less sublime. A number of examples come to mind. Begin by recreating the traditional finding aid. Transform an EAD file into serialized RDF, and from the RDF create a finding aid. This is rather mundane and redundant but it will demonstrate and support a service model going forward. Go three steps further. First, create a finding aid, but supplement it with data and information from your other finding aids. Your collections do not exist in silos nor isolation. Supplement these second-generation finding aids with images, geographic coordinates, links to scholarly articles, or more thorough textual notes all discovered from outside linked data sources. Third, establish relationships between your archival collections and the archival collections outside your institution. Again, relationships could be created between collections and between items in the collections. These sorts of “killer” applications enables the archivist to stretch the definition of finding aid.
Another “killer” application may be a sort of union catalog. Each example of the union catalog will have some sort of common domain. The domain could be topical: Catholic studies, civil war history, the papers of a particular individual or organization. Collect the RDF from archives of these domains, put it into a single triple store, clean up and enhance the RDF, index it, and provide a search engine against the index. The domain could be regional. For example, the RDF from an archive, library, and museum of an individual college or university could be created, amalgamated, and presented. The domain could be professional: all archives, all libraries, or all museums.
Another killer application, especially in an academic environment, would be the integration of archival description into course management systems. Manifest archival descriptions as RDF. Manifest course offerings across the academy in the form of RDF. Manifest student and instrutor information as RDF. Discover and provide links between archival content and people in specific classes. This sort of application will make archival collections much more relevant to the local population.
Tell stories. Don’t just provide links. People want answers as much as they want lists of references. After search queries are sent to indexes, provide search results in the form of lists of links, but also mash together information from search results into a “named graph” that includes an overview of the apparent subject queried, images of the subject, a depiction of where the subject is located, and few very relevant and well-respected links to narrative descriptions of the subject. You can see these sorts of enhancement in the results of many Google and Facebook search results.
Support the work of digital humanists. Amass RDF. Clean, normalize, and enhance it. Provide access to it via searchable and browsable interfaces. Provide additional services against the results such as timelines built from the underlying dates found in the RDF. Create word clouds based on statistically significant entities such as names of people or places or themes. Provide access to search results in the form of delimited files so the data can be imported into other tools for more sophisticated analysis. For example, support a search results to Omeka interface. For that matter, create an Omeka to RDF service.
The “killer” application for linked data is only as far away as your imagination. If you can articulate it, then it can probably be created.
Linked data changes the way your descriptions get expressed and distributed. It is a lot like taking a trip across country. The goal was always to get to the coast to see the ocean, but instead of walking, going by stage coach, taking a train, or driving a car, you will be flying. Along the way you may visit a few cities and have a few layovers. Bad weather may even get in the way, but sooner or later you will get to your destination. Take a deep breath. Understand that the process will be one of learning, and that learning will be applicable in other aspects of your work. The result will be two-fold. First, a greater number of people will have access to your collections, and consequently, more people will will be using your collections.
2014-04-23T19:25:02+00:00 LiAM: Linked Archival Metadata: LiAM Guidebook: Executive summary http://sites.tufts.edu/liam/2014/04/21/executive-summary/
 Linked data is a process for embedding the descriptive information of archives into the very fabric of the Web. By transforming archival description into linked data, an archivist will enable other people as well as computers to read and use their archival description, even if the others are not a part of the archival community. The process goes both ways. Linked data also empowers archivists to use and incorporate the information of other linked data providers into their local description. This enables archivists to make their descriptions more thorough, more complete, and more value-added. For example, archival collections could be automatically supplemented with geographic coordinates in order to make maps, images of people or additional biographic descriptions to make collections come alive, or bibliographies for further reading.
Publishing and using linked data does not represent a change in the definition of archival description, but it does represent an evolution of how archival description is accomplished. For example, linked data is not about generating a document such as EAD file. Instead it is about asserting sets of statements about an archival thing, and then allowing those statements to be brought together in any number of ways for any number of purposes. A finding aid is one such purpose. Indexing is another purpose. For use by a digital humanist is anther purpose. While EAD files are encoded as XML documents and therefore very computer readable, the reader must know the structure of EAD in order to make the most out of the data. EAD is archives-centric. The way data is manifested in linked data is domain-agnostic.
The objectives of archives include collection, organization, preservation, description, and often times access to unique materials. Linked data is about description and access. By taking advantages of linked data principles, archives will be able to improve their descriptions and increase access. This will require a shift in the way things get done but not what gets done. The goal remains the same.
Many tools are ready exist for transforming data in existing formats into linked data. This data can reside in Excel spreadsheets, database applications, MARC records, or EAD files. There are tiers of linked data publishing so one does not have to do everything all at once. But to transform existing information or to maintain information over the long haul requires the skills of many people: archivists & content specialists, administrators & managers, metadata specialists & catalogers, computer programers & systems administrators.
Moving forward with linked data is a lot like touristing to Rome. There are many ways to get there, and there are many things to do once you arrive, but the result will undoubtably improve your ability to participate in the discussion of the human condition on a world wide scale.
2014-04-21T20:59:20+00:00 LiAM: Linked Archival Metadata: Rome in three days, an archivists introduction to linked data publishing http://sites.tufts.edu/liam/2014/04/17/rome-in-three-days/If you to go to Rome for a few days, do everything you would do in a single day, eat and drink in a few cafes, see a few fountains, and go to a museum of your choice.
 Linked data in archival practice is not new. Others have been here previously. You can benefit from their experience and begin publishing linked data right now using tools with which you are probably already familiar. For example, you probably have EAD files, sets of MARC records, or metadata saved in database applications. Using existing tools, you can transform this content into RDF and put the result on the Web, thus publishing your information as linked data.
If you have used EAD to describe your collections, then you can easily make your descriptions available as valid linked data, but the result will be less than optimal. This is true not for a lack of technology but rather from the inherent purpose and structure of EAD files.
A few years ago an organisation in the United Kingdom called the Archive’s Hub was funded by a granting agency called JISC to explore the publishing of archival descriptions as linked data. The project was called LOCAH. One of the outcomes of this effort was the creation of an XSL stylesheet (ead2rdf) transforming EAD into RDF/XML. The terms used in the stylesheet originate from quite a number of standardized, widely accepted ontologies, and with only the tiniest bit configuration / customization the stylesheet can transform a generic EAD file into valid RDF/XML for use by anybody. The resulting XML files can then be made available on a Web server or incorporated into a triple store. This goes a long way to publishing archival descriptions as linked data. The only additional things needed are a transformation of EAD into HTML and the configuration of a Web server to do content negotiation between the XML and HTML.
For the smaller archive with only a few hundred EAD files whose content does not change very quickly, this is a simple, feasible, and practical solution to publishing archival descriptions as linked data. With the exception of doing some content negotiation, this solution does not require any computer technology that is not already being used in archives, and it only requires a few small tweaks to a given workflow:
EAD is a combination of narrative description and a hierarchal inventory list, and this data structure does not lend itself very well to the triples of linked data. For example, EAD headers are full of controlled vocabularies terms but there is no way to link these terms with specific inventory items. This is because the vocabulary terms are expected to describe the collection as a whole, not individual things. This problem could be overcome if each individual component of the EAD were associated with controlled vocabulary terms, but this would significantly increase the amount of work needed to create the EAD files in the first place.
The common practice of using literals to denote the names of people, places, and things in EAD files would also need to be changed in order to fully realize the vision of linked data. Specifically, it would be necessary for archivists to supplement their EAD files with commonly used URIs denoting subject headings and named authorities. These URIs could be inserted into id attributes throughout an EAD file, and the resulting RDF would be more linkable, but the labor to do so would increase, especially since many of the named items will not exist in standardized authority lists.
Despite these short comings, transforming EAD files into some sort of serialized RDF goes a long way towards publishing archival descriptions as linked data. This particular process is a good beginning and outputs valid information, just information that is not as linkable as possible. This process lends itself to iterative improvements, and outputting something is better than outputting nothing. But this particular proces is not for everybody. The archive whose content changes quickly, the archive with copious numbers of collections, or the archive wishing to publish the most complete linked data possible will probably not want to use EAD files as the root of their publishing system. Instead some sort of database application is probably the best solution.
In some ways MARC lends it self very well to being published via linked data, but in the long run it is not really a feasible data structure.
Converting MARC into serialized RDF through XSLT is at least a two step process. The first step is to convert MARC into MARCXML and then MARCXML into MODS. This can be done with any number of scripting languages and toolboxes. The second step is to use a stylesheet such as the one created by Stefano Mazzocchi to transform the MODS into RDF/XML — mods2rdf.xsl From there a person could save the resulting XML files on a Web server, enhance access via content negotiation, and called it linked data.
Unfortunately, this particular approach has a number of drawbacks. First and foremost, the MARC format had no place to denote URIs; MARC records are made up almost entirely of literals. Sure, URIs can be constructed from various control numbers, but things like authors, titles, subject headings, and added entries will most certainly be literals (“Mark Twain”, “Adventures of Huckleberry Finn”, “Bildungsroman”, or “Samuel Clemans”), not URIs. This issue can be overcome if the MARCXML were first converted into MODS and URIs were inserted into id or xlink attributes of bibliographic elements, but this is extra work. If an archive were to take this approach, then it would also behoove them to use MODS as their data structure of choice, not MARC. Continually converting from MARC to MARCXML to MODS would be expensive in terms of time. Moreover, with each new conversion the URIs from previous iterations would need to be re-created.
Encoded Archival Context for Corporate Bodies, Persons, and Families (EAC-CPF) goes a long way to implementing a named authority database that could be linked from archival descriptions. These XML files could easily be transformed into serialized RDF and therefore linked data. The resulting URIs could then be incorporated into archival descriptions making the descriptions richer and more complete. For example the FindAndConnect site in Australia uses EAC-CPF under the hood to disseminate information about people in its collection. Similarly, “SNAC aims to not only make the [EAC-CPF] records more easily discovered and accessed but also, and at the same time, build an unprecedented resource that provides access to the socio-historical contexts (which includes people, families, and corporate bodies) in which the records were created” More than a thousand EAC-CPF records are available from the RAMP project.
If you have archival descriptions in either of the METS or MODS formats, then transforming them into RDF is as far away as your XSLT processor and a content negotiation implementation. As of this writing there do not seem to be any METS to RDF stylesheets, but there are a couple stylesheets for MODS. The biggest issue with these sorts of implementations are the URIs. It will be necessary for archivists to include URIs into as many MODS id or xlink attributes as possible. The same thing holds true for METS files except the id attribute is not designed to hold pointers to external sites.
Some archives and libraries use a content management system called ContentDM. Whether they know it or not, ContentDM comes complete with an OAI-PMH (Open Archives Initiative – Protocol for Metadata Harvesting) interface. This means you can send a REST-ful URL to ContentDM, and you will get back an XML stream of metadata describing digital objects. Some of the digital objects in ContentDM (or any other OAI-PMH service provider) may be something worth exposing as linked data, and this can easily be done with a system called oai2lod. It is a particular implementation of D2RQ, described below, and works quite well. Download application. Feed oai2lod the “home page” of the OAI-PMH service provider, and oai2load will publish the OAI-PMH metadata as linked open data. This is another quick & dirty way to get started with linked data.
Publishing linked data through XML transformation is functional but not optimal. Publishing linked data from a database comes closer to the ideal but requires a greater amount of technical computer infrastructure and expertise.
Databases — specifically, relational databases — are the current best practice for organizing data. As you may or may not know, relational databases are made up of many tables of data joined together with keys. For example, a book may be assigned a unique identifier. The book has many characteristics such as a title, number of pages, size, descriptive note, etc. Some of the characteristics are shared by other books, like authors and subjects. In a relational database these shared characteristics would be saved in additional tables, and they would be joined to a specific book through the use of unique identifiers (keys). Given this sort of data structure, reports can be created from the database describing its content. Similarly, queries can be applied against the database to uncover relationships that may not be apparent at first glance or buried in reports. The power of relational databases lies in the use of keys to make relationships between rows in one table and rows in other tables. The downside of relational databases as a data model is infinite variety of fields/table combinations making them difficult to share across the Web.
Not coincidently, relational database technology is very much the way linked data is expected to be implemented. In the linked data world, the subjects of triples are URIs (think database keys). Each URI is associated with one or more predicates (think the characteristics in the book example). Each triple then has an object, and these objects take the form of literals or other URIs. In the book example, the object could be “Adventures Of Huckleberry Finn” or a URI pointing to Mark Twain. The reports of relational databases are analogous to RDF serializations, and SQL (the relational database query language) is analogous to SPARQL, the query language of RDF triple stores. Because of the close similarity between well-designed relational databases and linked data principles, the publishing of linked data directly from relational databases makes whole lot of sense, but the process requires the combined time and skills of a number of different people: content specialists, database designers, and computer programmers. Consequently, the process of publishing linked data from relational databases may be optimal, but it is more expensive.
Thankfully, many archivists probably use some sort of behind the scenes database to manage their collections and create their finding aids. Moreover, archivists probably use one of three or four tools for this purpose: Archivist’s Toolkit, Archon, ArchivesSpace, or PastPerfect. Each of these systems have a relational database at their heart. Reports could be written against the underlying databases to generate serialized RDF and thus begin the process of publishing linked data. Doing this from scratch would be difficult, as well as inefficient because many people would be starting out with the same database structure but creating a multitude of varying outputs. Consequently, there are two alternatives. The first is to use a generic database application to RDF publishing platform called D2RQ. The second is for the community to join together and create a holistic RDF publishing system based on the database(s) used in archives.
D2RQ is a very powerful software system. It is supported, well-documented, executable on just about any computing platform, open source, focused, functional, and at the same time does not try to be all things to all people. Using D2RQ it is more than possible to quickly and easily publish a well-designed relational database as RDF. The process is relatively simple:
The downside of D2RQ is its generic nature. It will create an RDF ontology whose terms correspond to the names of database fields. These field names do not map to widely accepted ontologies & vocabularies and therefore will not interact well with communities outside the ones using a specific database structure. Still, the use of D2RQ is quick, easy, and accurate.
2014-04-18T00:43:16+00:00 LiAM: Linked Archival Metadata: Rome in a day, the archivist on a linked data pilgrimage way http://sites.tufts.edu/liam/2014/04/16/rome-in-a-day/If you are going to be in Rome for only a few days, you will want to see the major sites, and you will want to adventure out & about a bit, but at the same time is will be a wise idea to follow the lead of somebody who has been there previously. Take the advise of these people. It is an efficient way to see some of the sights.
If you to go to Rome for a day, then walk to the Colosseum and Vatican City. Everything you see along the way will be extra.
 Linked data is not a fad. It is not a trend. It makes a lot of computing sense, and it is a modern way of fulfilling some the goals of archival practice. Just like Rome, it is not going away. An understanding of what linked data has to offer is akin to experiencing Rome first hand. Both will ultimately broaden your perspective. Consequently it is a good idea to make a concerted effort to learn about linked data, as well as visit Rome at least once. Once you have returned from your trip, discuss what you learned with your friends, neighbors, and colleagues. The result will be enlightening everybody.
The previous sections of this book described what linked data is and why it is important. The balance of book describes more of the how’s of linked data. For example, there is a glossary to help reenforce your knowledge of the jargon. You can learn about HTTP “content negotiation” to understand how actionable URIs can return HTML or RDF depending on the way you instruct remote HTTP servers. RDF stands for “Resource Description Framework”, and the “resources” are represented by URIs. A later section of the book describes ways to design the URIs of your resources. Learn how you can transform existing metadata records like MARC or EAD into RDF/XML, and then learn how to put the RDF/XML on the Web. Learn how to exploit your existing databases (such as the one’s under Archon, Archivist’s Toolkit, or ArchiveSpace) to generate RDF. If you are the Do It Yourself type, then play with and explore the guidebook’s tool section. Get the gentlest of introductions to searching RDF using a query language called SPARQL. Learn how to read and evaluate ontologies & vocabularies. They are manifested as XML files, and they are easily readable and visualizable using a number of programs. Read about and explore applications using RDF as the underlying data model. There are a growing number of them. The book includes a complete publishing system written in Perl, and if you approach the code of the publishing system as if it were a theatrical play, then the “scripts” read liked scenes. (Think of the scripts as if they were a type of poetry, and they will come to life. Most of the “scenes” are less than a page long. The poetry even includes a number of refrains. Think of the publishing system as if it were a one act play.) If you want to read more, and you desire a vetted list of books and articles, then a later section lists a set of further reading.
After you have spent some time learning a bit more about linked data, discuss what you have learned with your colleagues. There are many different aspects of linked data publishing, such as but not limited to:
In archival practice, each of these things would be done by different sets of people: archivists & content specialists, administrators & managers, computer programers & systems administrators, metadata experts & catalogers. Each of these sets of people have a piece of the publishing puzzle and something significant to contribute to the work. Read about linked data. Learn about linked data. Bring these sets of people together discuss what you have learned. At the very least you will have a better collective understanding of the possibilities. If you don’t plan to “go to Rome” right away, you might decide to reconsider the “vacation” at another time.
2014-04-17T01:33:24+00:00 LiAM: Linked Archival Metadata: Four “itineraries” for putting linked data into practice for the archivist http://sites.tufts.edu/liam/2014/04/14/itineraries/Even Michelangelo, when he painted the Sistine Chapel, worked with a team of people each possessing a complementary set of skills. Each had something different to offer, and the discussion between themselves was key to their success.
If you to go to Rome for a day, then walk to the Colosseum and Vatican City. Everything you see along the way will be extra. If you to go to Rome for a few days, do everything you would do in a single day, eat and drink in a few cafes, see a few fountains, and go to a museum of your choice. For a week, do everything you would do in a few days, and make one or two day-trips outside Rome in order to get a flavor of the wider community. If you can afford two weeks, then do everything you would do in a week, and in addition befriend somebody in the hopes of establishing a life-long relationship.
 When you read a guidebook on Rome — or any travel guidebook — there are simply too many listed things to see & do. Nobody can see all the sites, visit all the museums, walk all the tours, nor eat at all the restaurants. It is literally impossible to experience everything a place like Rome has to offer. So it is with linked data. Despite this fact, if you were to do everything linked data had to offer, then you would do all of things on the following list starting at the first item, going all the way down to evaluation, and repeating the process over and over:
Given that it is quite possible you do not plan to immediately dive head-first into linked data, you might begin by getting your feet wet or dabbling in a bit of experimentation. That being the case, here are a number of different “itineraries” for linked data implementation. Think of them as strategies. They are ordered from least costly and most modest to greatest expense and completest execution:


Koha Gruppo Italiano has organized the following free event that may be of interest to linked data affectionatos in cultural heritage institutions:
Italian Lectures on Semantic Web and Linked Data: Practical Examples for Libraries, Wednesday May 7, 2014 at The American University of Rome – Auriana Auditorium (Via Pietro Roselli, 16 – Rome, Italy)
Please RSVP to f.wallner at aur.edu by May 5.
This event is generously sponsored by regesta.exe, Bucap Document Imaging SpA, and SOS Archivi e Biblioteche.


A new but still “pre-published” version of the Linked Archival Metadata: A Guidebook is available. From the introduction:
The purpose of this guidebook is to describe in detail what linked data is, why it is important, how you can publish it to the Web, how you can take advantage of your linked data, and how you can exploit the linked data of others. For the archivist, linked data is about universally making accessible and repurposing sets of facts about you and your collections. As you publish these fact you will be able to maintain a more flexible Web presence as well as a Web presence that is richer, more complete, and better integrated with complementary collections.
And from the table of contents:
There are a number of versions:
Feedback desired and hoped for.
2014-04-12T12:41:39+00:00 Life of a Librarian: The 3D Printing Working Group is maturing, complete with a shiny new mailing list http://sites.nd.edu/emorgan/2014/04/3d-mailing-list/
 A couple of weeks ago Kevin Phaup took the lead of facilitating a 3D printing workshop here in the Libraries’s Center For Digital Scholarship. More than a dozen students from across the University participated. Kevin presented them with an overview of 3D printing, pointed them towards a online 3D image editing application (Shapeshifter), and everybody created various objects which Matt Sisk has been diligently printing. The event was deemed a success, and there will probably be more specialized workshops scheduled for the Fall.
Since the last blog posting there has also been another Working Group meeting. A short dozen of us got together in Stinson-Remick where we discussed the future possibilities for the Group. The consensus was to create a more formal mailing list, maybe create a directory of people with 3D printing interests, and see about doing something more substancial — with a purpose — for the University.
To those ends, a mailing list has been created. Its name is 3D Printing Working Group . The list is open to anybody, and its purpose is to facilitate discussion of all things 3D printing around Notre Dame and the region. To subscribe address an email message to listserv@listserv.nd.edu, and in the body of the message include the following command:
where Your Name is… your name.
Finally, the next meeting of the Working Group has been scheduled for Wednesday, May 14. It will be sponsored by Bob Sutton of Springboard Technologies, and it will be located in Innovation Park across from the University, and it will take place from 11:30 to 1 o’clock. I’m pretty sure lunch will be provided. The purpose of the meeting will be continue to outline the future directions of the Group as well as to see a demonstration of a printer called the Isis3D.
2014-04-09T00:28:04+00:00 LiAM: Linked Archival Metadata: What is linked data and why should I care? http://sites.tufts.edu/liam/2014/04/04/what-is-ld-2/“Tell me about Rome. Why should I go there?”
 Linked data is a standardized process for sharing and using information on the World Wide Web. Since the process of linked data is woven into the very fabric of the way the Web operates, it is standardized and will be applicable as long as the Web is applicable. The process of linked data is domain agnostic meaning its scope is equally apropos to archives, businesses, governments, etc. Everybody can and everybody is equally invited to participate. Linked data is application independent. As long as your computer is on the Internet and knows about the World Wide Web, then it can take advantage of linked data.
Linked data is about sharing and using information (not mere data but data put into context). This information takes the form of simple “sentences” which are intended to be literally linked together to communicate knowledge. The form of linked data is similar to the forms of human language, and like human languages, linked data is expressive, nuanced, dynamic, and exact all at once. Because of its atomistic nature, linked data simultaneously simplifies and transcends previous information containers. It reduces the need for profession-specific data structures, but at the same time it does not negate their utility. This makes it easy for you to give your information away, and for you to use other people’s information.
The benefits of linked data boil down to two things: 1) it makes information more accessible to both people as well as computers, and 2) it opens the doors to any number of knowledge services limited only by the power of human imagination. Because it standardized, agnostic, independent, and mimics human expression linked data is more universal than the current processes of information dissemination. Universality infers decentralization, and decentralization promotes dissemination. On the Internet anybody can say anything at anytime. In the aggregate, this is a good thing and it enables information to be combined in ways yet to be imagined. Publishing information as linked data enables you to seamlessly enhance your own knowledge services as well as simultaneously enhance the knowledge of others.
2014-04-04T20:51:29+00:00 LiAM: Linked Archival Metadata: Impressed with ReLoad http://sites.tufts.edu/liam/2014/04/04/reload/“Rome is the Eternal City. After visting Rome you will be better equipped to participate in the global conversation of the human condition.”
I’m impressed with the linked data project called ReLoad. Their data is robust, complete, and full of URIs as well as human-readable labels. From the project’s home page:
The ReLoad project (Repository for Linked open archival data) will foster experimentation with the technology and methods of linked open data for archival resources. Its goal is the creation of a web of linked archival data.
LOD-LAM, which is an acronym for Linked Open Data for Libraries, Archives and Museums, is an umbrella term for the community and active projects in this area.The first experimental phase will make use of W3C semantic web standards, mash-up techniques, software for linking and for defining the semantics of the data in the selected databases.
The archives that have made portions of their institutions’ data and databases openly available for this project are the Central State Archive, and the Cultural Heritage Institute of Emilia Romagna Region. These will be used to test methodologies to expose the resources as linked open data.
For example, try these links:
Their data is rich enough so things like LodLive can visualize resources well:

This posting outlines a current trend in some academic libraries, specifically, the inclusion of digital humanities into their service offerings. It provides the briefest of introductions to the digital humanities, and then describes how one branch of the digital humanities — text mining — is being put into practice here in the Hesburgh Libraries’ Center For Digital Scholarship at the University of Notre Dame.
(This posting and its companion one-page handout was written for the Information Organization Research Group, School of Information Studies at the University of Wisconsin Milwaukee, in preparation for a presentation dated April 10, 2014.)

For all intents and purposes, the digital humanities is a newer rather than older scholarly endeavor. A priest named Father Busa is considered the “Father of the Digital Humanities” when, in 1965, he worked with IBM to evaluate the writings of Thomas Aquinas. With the advent of the Internet, ubiquitous desktop computing, an increased volume of digitized content, and sophisticated markup languages like TEI (the Text Encoding Initiative), the processes of digital humanities work has moved away from a fad towards a trend. While digital humanities work is sometimes called a discipline this author sees it more akin to a method. It is a process of doing “distant reading” to evaluate human expression. (The phrase “distant reading” is attributed to Franco Moretti who coined it in a book entitles Graphs, Maps, Trees: Abstract Models for a Literary History. Distant reading is complementary to “close reading”, and is used to denote the idea of observing many documents simultaneously.) The digital humanities community has grown significantly in the past ten or fifteen years complete with international academic conferences, graduate school programs, and scholarly publications.
Digital humanities work is a practice where digitized content of the humanist is quantitatively analyzed as if it were the content studied by a scientist. This sort of analysis can be done against any sort of human expression: written and spoken words, music, images, dance, sculpture, etc. Invariably, the process begins with counting and tabulating. This leads to measurement, which in turn provides opportunities for comparison. From here patterns can be observed and anomalies perceived. Finally, predictions, thesis, and judgements can be articulated. Digital humanities work does not replace the more traditional ways of experiencing expressions of the human condition. Instead it supplements the experience.
This author often compares the methods of the digital humanist to the reading of a thermometer. Suppose you observe an outdoor thermometer and it reads 32° (Fahrenheit). This reading, in and of itself, carries little meaning. It is only a measurement. In order to make sense of the reading it is important to put it into context. What is the weather outside? What time of year is it? What time of day is it? How does the reading compare to other readings? If you live in the Northern Hemisphere and the month is July, then the reading is probably an anomaly. On the other hand, if the month is January, then the reading is perfectly normal and not out of the ordinary. The processes of the digital humanist make it possible to make many measurements from a very large body of materials in order to evaluate things like texts, sounds, images, etc. It makes it possible to evaluate the totality of Victorian literature, the use of color in paintings over time, or the rhythmic similarities & difference between various forms of music.
As the more traditional services of academic libraries become more accessible via the Internet, libraries have found the need to necessarily evolve. One manifestation of this evolution is the establishment of digital humanities centers. Probably one of oldest of these centers is located at the University of Virginia, but they now exist in many libraries across the country. These centers provide a myriad of services including combinations of digitization, markup, website creation, textual analysis, speaker series, etc. Sometimes these centers are akin to computing labs. Sometimes they are more like small but campus-wide departments staffed with scholars, researchers, and graduate students.
The Hesburgh Libraries’ Center For Digital Scholarship at the University of Notre Dame was recently established in this vein. The Center supports services around geographic information systems (GIS), data management, statistical analysis of data, and text mining. It is located in a 5,000 square foot space on the Libraries’s first floor and includes a myriad of computers, scanners, printers, a 3D printer, and collaborative work spaces. Below is an annotated list of projects the author has spent time against in regards to text mining and the Center. It is intended to give the reader a flavor of the types of work done in the Hesburgh Libraries:

Text mining, and digital humanities work in general, is simply the application computing techniques applied against the content of human expression. Their use is similar to use of the magnifying glass by Galileo. Instead of turning it down to count the number of fibers in a cloth (or to write an email message), it is being turned up to gaze at the stars (or to analyze the human condition). What he finds there is not so much truth as much as new ways to observe. The same is true of text mining and the digital humanities. They are additional ways to “see”.
Here is a short list of links for further reading:
I have posted to Github the very beginnings of Perl library used to support simple and introductory text mining analysis — tiny text mining tools.
Presently the library is implemented in a set of subroutines stored in a single file supporting:
I use these subroutines and the associated Perl scripts to do quick & dirty analysis against corpuses of journal articles, books, and websites.
I know, I know. It would be better to implement these thing as a set of Perl modules, but I’m practicing what I preach. “Give it away even if it is not ready.” The ultimate idea is to package these things into a single distribution, and enable researchers to have them at their finger tips as opposed to a Web-based application.
2014-04-02T19:57:24+00:00 LiAM: Linked Archival Metadata: Three RDF data models for archival collections http://sites.tufts.edu/liam/2014/03/30/models/Listed and illustrated here are three examples of RDF data models for archival collections. It is interesting to literally see the complexity or thoroughness of each model, depending on your perspective.

This one was designed by Aaron Rubinstein. I don’t know whether or not it was ever put into practice.

This is the model used in Project LOACH by the Archives Hub.

This final model — OAD — is being implemented in a project called ReLoad.
There are other ontologies of interest to cultural heritage institutions, but these three seem to be the most apropos to archivists.
This work is a part of a yet-to-be published book called the LiAM Guidebook, a text intended for archivists and computer technologists interested in the application of linked data to archival description.
I have made available a new draft of the LiAM Guidebook. Many of the lists of things (tools, projects, vocabulary terms, Semantic browsers, etc.) are complete. Once the lists are done I will move back to the narratives. Thanks go to various people I’ve interviewed lately (Gregory Colati, Karen Gracy, Susan Pyzynski, Aaron Rubinstein, Ed Summers, Diane Hillman, Anne Sauer, and Eliot Wilczek) because without them I would to have been able to get this far nor see a path forward.
2014-03-28T02:44:07+00:00 LiAM: Linked Archival Metadata: Linked data projects of interest to archivists (and other cultural heritage personnel) http://sites.tufts.edu/liam/2014/03/27/projects/While the number of linked data websites is less than the worldwide total number, it is really not possible to list every linked data project but only things that will presently useful to the archivist and computer technologist working in cultural heritage institutions. And even then the list of sites will not be complete. Instead, listed below are a number of websites of interest today. This list is a part of the yet-to-be published LiAM Guidebook.
The following introductions are akin to directories or initial guilds filled with pointers to information about RDF especially meaningful to archivists (and other cultural heritage workers).
The data sets and projects range from simple RDF dumps to full-blown discovery systems. In between some simple browsable lists and raw SPARQL endpoints.
This posting lists various tools for archivists and computer technologists wanting to participate in various aspects of linked data. Here you will find pointers to creating, editing, storing, publishing, and searching linked data. It is a part of yet-to-be published LiAM Guidebook.
The sites listed in this section enumerate linked data and RDF tools. They are jumping off places to other sites:
Use these tools to create RDF:
Once RDF is created, use these systems to publish it as linked data:
This is a small set of Semantic Web browsers. Give them URIs and they allow you to follow and describe the links they include.
If you need some URIs to begin with, then try some of these:

This is the tiniest of blog postings describing a fledgling community here on campus called the University of Notre Dame 3-D Printing Working Group.

Working group
A few months ago Paul Turner said to me, “There are an increasing number of people across campus who are interested in 3-D printing. With your new space there in the Center, maybe you could host a few of us and we can share experiences.” Since then a few of us have gotten together a few times to discuss problems and solutions when it comes these relatively new devices. We have discussed things like:
nose
Mike Elwell from Industrial Design hosted one of our meetings. We learned about “fab labs” and “maker spaces”. 3-D printing seems to be latest of gizmos for prototyping. He gave us a tour of his space, and I was most impressed with the laser cutter. At our most recent meeting Matt Leevy of Biology showed us how he is making models of people’s nasal cavities so doctors and practice before surgery. There I learned about the use of multiple plastics to do printing and how these multiple plastics can be used to make a more diverse set of objects. Because of the growing interest in 3-D printing, the Center will be hosting a beginner’s 3-D printing workshop in on March 28 from 1 – 5 o’clock and facilitated by graduate student Kevin Phaup.
With every get together there have been more and more people attending with faculty and staff from Biology, Industrial Design, the Libraries, Engineering, OIT, and Innovation Park. Our next meeting — just as loosely as the previous meetings — is scheduled for Friday, April 4 from noon to 1 o’clock in room 213 Stinson-Remick Hall. (That’s the new engineering building, and I believe it is the Notre Dame Design Deck space.) Everybody is welcome. The more people who attend, the more we can each get accomplished.
‘Hope to see you there!
2014-03-19T00:49:45+00:00 LiAM: Linked Archival Metadata: Semantic Web application http://sites.tufts.edu/liam/2014/03/07/semantic-web/This posting outlines the implementation of a Semantic Web application.
Many people seem to think the ideas behind the Semantic Web (and linked data) are interesting, but many people are also waiting to see some of the benefits before committing resources to the effort. This is what I call the “chicken & egg problem of the linked data”.
While I have not created the application outlined below, I think it is more than feasible. It is a sort of inference engine feed with a URI and integer, both supplied by a person. Its ultimate goal is to find relationships between URIs that were not immediately or readily apparent.* It is a sort of “find more like this one” application. Here’s the algorithm:
I believe many people perceive the ideas behind the Semantic Web to be akin to investigations in artificial intelligence. To some degree this is true, and investigations into artificial intelligence seem to come and go in waves. “Expert systems” and “neural networks” were incarnations of artificial intelligence more than twenty years ago. Maybe the Semantic Web is just another in a long wave of forays.
On the other hand, Semantic Web applications do not need to be so sublime. They can be as simple as discovery systems, browsable interfaces, or even word clouds. The ideas behind the Semantic Web and linked data are implementable. It just a shame that nothing is catching the attention of the wider audiences.
* Remember, URIs are identifiers intended to represent real world objects and/or descriptions of real-world objects. URIs are perfect for cultural heritage institutions because cultural heritage institutions maintain both.
This is the simplest of SPARQL tutorials. The tutorial’s purpose is two-fold: 1) through a set of examples, introduce the reader to the syntax of SPARQL queries, and 2) to enable the reader to initially explore any RDF triple store which is exposed as a SPARQL endpoint.
SPARQL (SPARQL protocol and RDF query language) is a set of commands used to search RDF triple stores. It is modeled after SQL (structured query language), the set of commands used to search relational databases. If you are familiar with SQL, then SPARQL will be familiar. If not, then think of SPARQL queries as formalized sentences used to ask a question and get back a list of answers.
Also, remember, RDF is a data structure of triples: 1) subjects, 2) predicates, and 3) objects. The subjects of the triples are always URIs — identifiers of “things”. Predicates are also URIs, but these URIs are intended to denote relationships between subjects and objects. Objects are preferably URIs but they can also be literals (words or numbers). Finally, RDF objects and predicates are defined in human-created ontologies as a set of classes and properties where classes are abstract concepts and properties are characteristics of the concepts.
Try the following steps with just about any SPARQL endpoint:
SELECT ?s WHERE { ?s a <http://simile.mit.edu/2006/01/ontologies/mods3#Record> } LIMIT 1000
SELECT ?p ?o WHERE { <http://infomotions.com/sandbox/liam/id/shumarc681792> ?p ?o } ORDER BY ?p
SELECT ?s ?o WHERE { ?s <http://purl.org/dc/terms/title> ?o } ORDER BY ?o LIMIT 100
SELECT ?s ?o WHERE { ?s <http://simile.mit.edu/2006/01/roles#creator> ?o } ORDER BY ?o LIMIT 100
SELECT ?s ?o WHERE { ?s <http://xmlns.com/foaf/0.1/name> ?o } ORDER BY ?o LIMIT 100
SELECT ?s ?o WHERE { ?s <http://data.archiveshub.ac.uk/def/note> ?o } ORDER BY ?o LIMIT 100
Finally, don’t be too intimidated about SPARQL. Yes, it is possible to submit SPARQL queries by hand, but in reality, person-friendly front-ends are expected to be created making search much easier.
2014-02-28T03:13:10+00:00 Life of a Librarian: CrossRef’s Prospect API http://sites.nd.edu/emorgan/2014/02/prospect/This is the tiniest of blog postings outlining my experiences with a fledgling API called Prospect.
Prospect is an API being developed by CrossRef. I learned about it through both word-of-mouth as well as a blog posting by Eileen Clancy called “Easy access to data for text mining“. In a nutshell, given a CrossRef DOI via content negotiation, the API will return both the DOI’s bibliographic information as well as URL(s) pointing to the location of full text instances of the article. The purpose of the API is to provide a straight-forward method for acquiring full text content without the need for screen scraping.
I wrote a simple, almost brain-deal Perl subroutine implementing the API. For a good time, I put the subroutine into action in a CGI script. Enter a simple query, and the script will search CrossRef for full text articles, and return a list of no more than five (5) titles and their associated URL’s where you can get them in a number of formats.
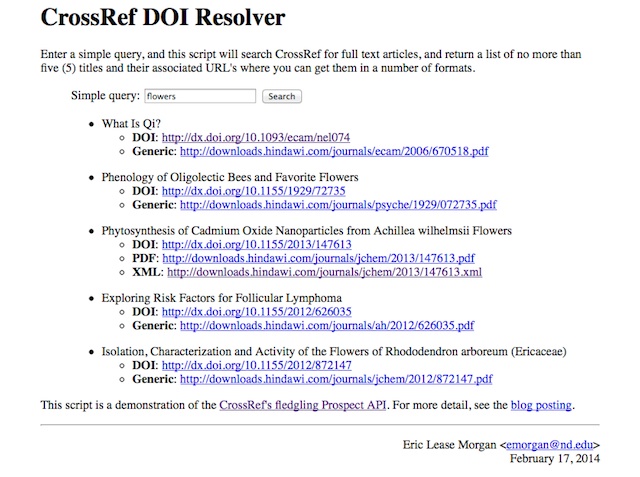
screen shot of CrossRef Prospect API in action
The API is pretty straight-forward, but the URLs pointing to the full text are stuffed into a “Links” HTTP header, and the value of the header is not as easily parseable as one might desire. Still, this can be put to good use in my slowly growing stock of text mining tools. Get DOI. Feed to one of my tools. Get data. Do analysis.
Fun with HTTP.
2014-02-17T23:11:45+00:00 Life of a Librarian: Analyzing search results using JSTOR’s Data For Research http://sites.nd.edu/emorgan/2014/02/dfr/Data For Research (DFR) is an alternative interface to JSTOR enabling the reader to download statistical information describing JSTOR search results. For example, using DFR a person can create a graph illustrating when sets of citations where written, create a word cloud illustrating the most frequently used words in a journal article, or classify sets of JSTOR articles according to a set of broad subject headings. More advanced features enable the reader to extract frequently used phrases in a text as well as list statistically significant keywords. JSTOR’s DFR is a powerful tool enabling the reader to look for trends in large sets of articles as well as drill down into the specifics of individual articles. This hands-on workshop leads the student through a set of exercises demonstrating these techniques.
DFR supports an easy-to-use search interface. Enter one or two words into the search box and submit your query. Alternatively you can do some field searching using the advanced search options. The search results are then displayed and sortable by date, relevance, or a citation rank. More importantly, facets are displayed along side the search results, and searches can be limited by selecting one or more of the facet terms. Limiting by years, language, subjects, and disciplines prove to be the most useful.
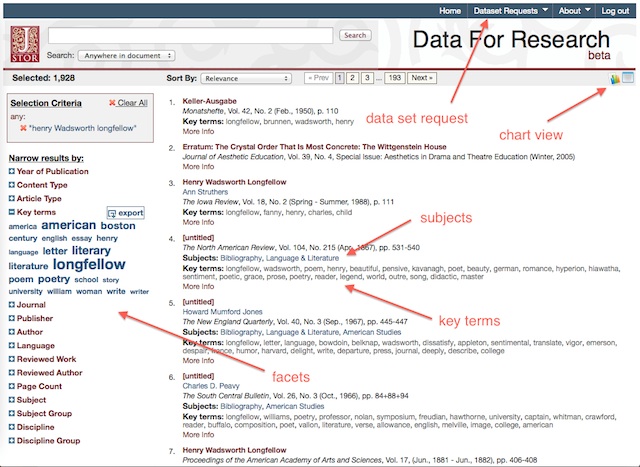
search results screen
By downloading the number of citations from multiple search results, it is possible to illustrate publication trends over time.
In the upper right-hand corner of every search result is a “charts view” link. Once selected it will display a line graph illustrating the number of citations fitting your query over time. It also displays a bar chart illustrating the broad subject areas of your search results. Just as importantly, there is a link at the bottom of the page — “Download data for year chart” — allowing you to download a comma-separated (CSV) file of publication counts and years. This file is easily importable into your favorite spreadsheet program and chartable. If you do multiple searches and download multiple CSV files, then you can compare publication trends. For example, the following chart compares the number of times the phrases “Henry Wadsworth Longfellow”, “Henry David Thoreau”, and “Ralph Waldo Emerson” have appeared in the JSTOR literature between 1950 and 2000. From the chart we can see that Emerson was consistently mentioned more of than both Longfellow and Thoreau. It would be interesting to compare the JSTOR results with the results from Google Books Ngram Viewer, which offers a similar service against their collection of digitized books.
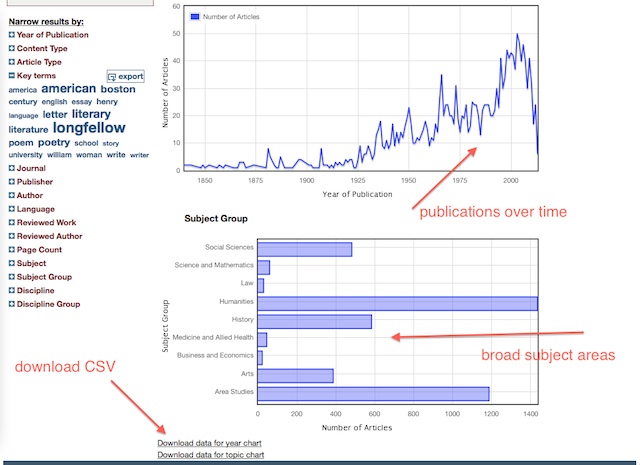
chart view screen shot
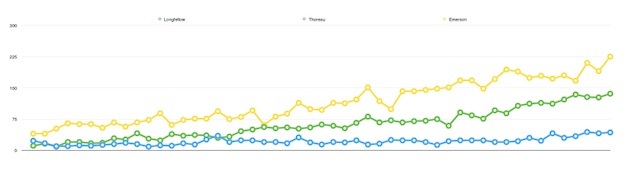
publications trends for Emerson, Thoreau, and Longfellow
DFR counts and tabulates frequently used words and statistically significant key words. These tabulations can be used to illustrate characteristics of search results.
Each search result item comes complete with title, author, citation, subject, and key terms information. The subjects and key terms are computed values — words and phrases determined by frequency and statistical analysis. Each search result item comes with a “More Info” link which returns lists of the item’s most frequently used words, phrases, and keyword terms. Unfortunately, these lists often include stop words like “the”, “of”, “that”, etc. making the results not as meaningful as they could be. Still, these lists are somewhat informative. They allude to the “aboutness” of the selected article.
Key terms are also facets. You can expand the Key terms facets to get a small word cloud illustrating the frequency of each term across the entire search result. Clicking on one of the key terms limits the search results accordingly. You can also click on the Export button to download a CVS file of key terms and their frequency. This information can then be fed to any number of applications for creating word clouds. For example, download the CSV file. Use your text editor to open the CSV file, and find/replace the commas with colons. Copy the entire result, and paste it into Wordle’s advanced interface. This process can be done multiple times for different searches, and the results can be compared & contrasted. Word clouds for Longfellow, Thoreau, and Emerson are depicted below, and from the results you can quickly see both similarities and differences between each writer.
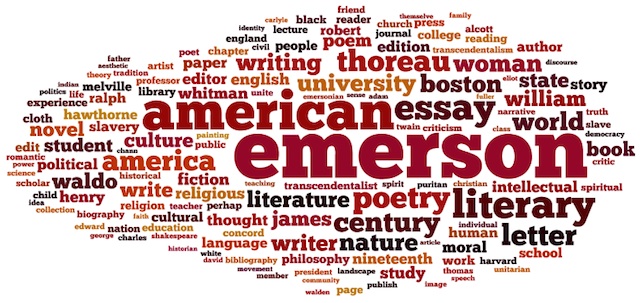
Ralph Waldo Emerson key terms
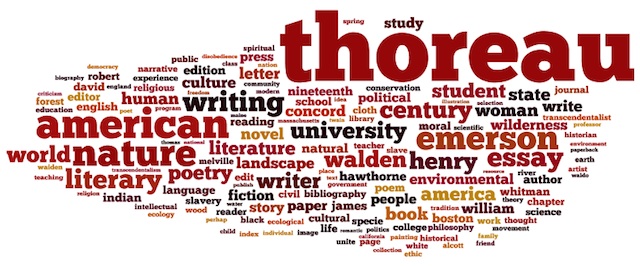
Henry David Thoreau key terms
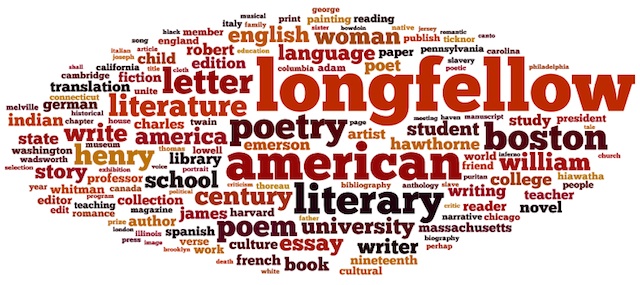
Henry Wadsworth Longfellow key terms
If you create a DFR account, and if you limit your search results to 1,000 items or less, then you can download a data set describing your search results.
In the upper right-hand corner of the search results screen is a pull-down menu option for submitting data set requests. The resulting screen presents you with options for downloading a number of different types of data (citations, word counts, phrases, and key terms) in two different formats (CSV and XML). The CSV format is inherently easier to use, but the XML format seems to be more complete, especially when it comes to citation information. After submitting your data set request you will have to wait for an email message from DFR because it takes a while (anywhere from a few minutes to a couple of hours) for it to be compiled.
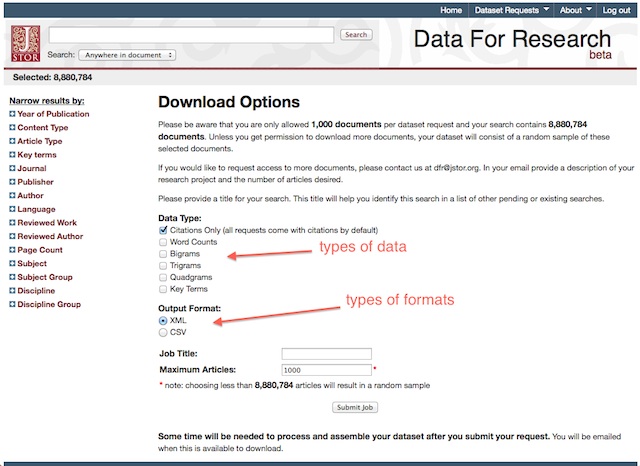
data set request page
After downloading a data set you can do additional analysis against it. For example, it is possible to create a timeline illustrating when individual articles where written. It is not be too difficult to create word clouds from titles or author names. If you have programming experience, then you might be be able to track ideas over time or the originator of specific ideas. Concordances — keyword in context search engines — can be implemented. Some of this functionality, but certainly not all, is being slowly implemented in a Web-based application called JSTOR Tool.
As the written word is increasingly manifested in digital form, so does the ability to evaluate the written word quantifiably. JSTOR’s DFR is one example of how this can be exploited for the purposes of academic research.
A .zip file containing some sample data and well as the briefest of instructions on how to use it is linked from this document.
2014-02-17T20:58:09+00:00 Mini-musings: LiAM source code: Perl poetry http://infomotions.com/blog/2014/02/poetry/#!/usr/bin/perl # Liam Guidebook Source Code; Perl poetry, sort of # Eric Lease Morgan <emorgan@nd.edu> # February 16, 2014 # done exit;
#!/usr/bin/perl # marc2rdf.pl – make MARC records accessible via linked data # Eric Lease Morgan <eric_morgan@infomotions.com> # December 5, 2013 – first cut; # configure use constant ROOT => ‘/disk01/www/html/main/sandbox/liam’; use constant MARC => ROOT . ‘/src/marc/’; use constant DATA => ROOT . ‘/data/’; use constant PAGES => ROOT . ‘/pages/’; use constant MARC2HTML => ROOT . ‘/etc/MARC21slim2HTML.xsl’; use constant MARC2MODS => ROOT . ‘/etc/MARC21slim2MODS3.xsl’; use constant MODS2RDF => ROOT . ‘/etc/mods2rdf.xsl’; use constant MAXINDEX => 100; # require use IO::File; use MARC::Batch; use MARC::File::XML; use strict; use XML::LibXML; use XML::LibXSLT; # initialize my $parser = XML::LibXML->new; my $xslt = XML::LibXSLT->new; # process each record in the MARC directory my @files = glob MARC . “*.marc”; for ( 0 .. $#files ) { # re-initialize my $marc = $files[ $_ ]; my $handle = IO::File->new( $marc ); binmode( STDOUT, ‘:utf8’ ); binmode( $handle, ‘:bytes’ ); my $batch = MARC::Batch->new( ‘USMARC’, $handle ); $batch->warnings_off; $batch->strict_off; my $index = 0; # process each record in the batch while ( my $record = $batch->next ) { # get marcxml my $marcxml = $record->as_xml_record; my $_001 = $record->field( ‘001’ )->as_string; $_001 =~ s/_//; $_001 =~ s/ +//; $_001 =~ s/-+//; print ” marc: $marc\n”; print ” identifier: $_001\n”; print ” URI: http://infomotions.com/sandbox/liam/id/$_001\n”; # re-initialize and sanity check my $output = PAGES . “$_001.html”; if ( ! -e $output or -s $output == 0 ) { # transform marcxml into html print ” HTML: $output\n”; my $source = $parser->parse_string( $marcxml ) or warn $!; my $style = $parser->parse_file( MARC2HTML ) or warn $!; my $stylesheet = $xslt->parse_stylesheet( $style ) or warn $!; my $results = $stylesheet->transform( $source ) or warn $!; my $html = $stylesheet->output_string( $results ); &save( $output, $html ); } else { print ” HTML: skipping\n” } # re-initialize and sanity check my $output = DATA . “$_001.rdf”; if ( ! -e $output or -s $output == 0 ) { # transform marcxml into mods my $source = $parser->parse_string( $marcxml ) or warn $!; my $style = $parser->parse_file( MARC2MODS ) or warn $!; my $stylesheet = $xslt->parse_stylesheet( $style ) or warn $!; my $results = $stylesheet->transform( $source ) or warn $!; my $mods = $stylesheet->output_string( $results ); # transform mods into rdf print ” RDF: $output\n”; $source = $parser->parse_string( $mods ) or warn $!; my $style = $parser->parse_file( MODS2RDF ) or warn $!; my $stylesheet = $xslt->parse_stylesheet( $style ) or warn $!; my $results = $stylesheet->transform( $source ) or warn $!; my $rdf = $stylesheet->output_string( $results ); &save( $output, $rdf ); } else { print ” RDF: skipping\n” } # prettify print “\n”; # increment and check $index++; last if ( $index > MAXINDEX ) } } # done exit; sub save { open F, ‘ > ‘ . shift or die $!; binmode( F, ‘:utf8’ ); print F shift; close F; return; }
#!/usr/bin/perl # ead2rdf.pl – make EAD files accessible via linked data # Eric Lease Morgan <eric_morgan@infomotions.com> # December 6, 2013 – based on marc2linkedata.pl # configure use constant ROOT => ‘/disk01/www/html/main/sandbox/liam’; use constant EAD => ROOT . ‘/src/ead/’; use constant DATA => ROOT . ‘/data/’; use constant PAGES => ROOT . ‘/pages/’; use constant EAD2HTML => ROOT . ‘/etc/ead2html.xsl’; use constant EAD2RDF => ROOT . ‘/etc/ead2rdf.xsl’; use constant SAXON => ‘java -jar /disk01/www/html/main/sandbox/liam/bin/saxon.jar -s:##SOURCE## -xsl:##XSL## -o:##OUTPUT##’; # require use strict; use XML::XPath; use XML::LibXML; use XML::LibXSLT; # initialize my $saxon = ”; my $xsl = ”; my $parser = XML::LibXML->new; my $xslt = XML::LibXSLT->new; # process each record in the EAD directory my @files = glob EAD . “*.xml”; for ( 0 .. $#files ) { # re-initialize my $ead = $files[ $_ ]; print ” EAD: $ead\n”; # get the identifier my $xpath = XML::XPath->new( filename => $ead ); my $identifier = $xpath->findvalue( ‘/ead/eadheader/eadid’ ); $identifier =~ s/[^\w ]//g; print ” identifier: $identifier\n”; print ” URI: http://infomotions.com/sandbox/liam/id/$identifier\n”; # re-initialize and sanity check my $output = PAGES . “$identifier.html”; if ( ! -e $output or -s $output == 0 ) { # transform marcxml into html print ” HTML: $output\n”; my $source = $parser->parse_file( $ead ) or warn $!; my $style = $parser->parse_file( EAD2HTML ) or warn $!; my $stylesheet = $xslt->parse_stylesheet( $style ) or warn $!; my $results = $stylesheet->transform( $source ) or warn $!; my $html = $stylesheet->output_string( $results ); &save( $output, $html ); } else { print ” HTML: skipping\n” } # re-initialize and sanity check my $output = DATA . “$identifier.rdf”; if ( ! -e $output or -s $output == 0 ) { # create saxon command, and save rdf print ” RDF: $output\n”; $saxon = SAXON; $xsl = EAD2RDF; $saxon =~ s/##SOURCE##/$ead/e; $saxon =~ s/##XSL##/$xsl/e; $saxon =~ s/##OUTPUT##/$output/e; system $saxon; } else { print ” RDF: skipping\n” } # prettify print “\n”; } # done exit; sub save { open F, ‘ > ‘ . shift or die $!; binmode( F, ‘:utf8’ ); print F shift; close F; return; }
#!/usr/bin/perl # store-make.pl – simply initialize an RDF triple store # Eric Lease Morgan <eric_morgan@infomotions.com> # # December 14, 2013 – after wrestling with wilson for most of the day # configure use constant ETC => ‘/disk01/www/html/main/sandbox/liam/etc/’; # require use strict; use RDF::Redland; # sanity check my $db = $ARGV[ 0 ]; if ( ! $db ) { print “Usage: $0 <db>\n”; exit; } # do the work; brain-dead my $etc = ETC; my $store = RDF::Redland::Storage->new( ‘hashes’, $db, “new=’yes’, hash-type=’bdb’, dir=’$etc'” ); die “Unable to create store ($!)” unless $store; my $model = RDF::Redland::Model->new( $store, ” ); die “Unable to create model ($!)” unless $model; # “save” $store = undef; $model = undef; # done exit;
#!/user/bin/perl # store-add.pl – add items to an RDF triple store # Eric Lease Morgan <eric_morgan@infomotions.com> # # December 14, 2013 – after wrestling with wilson for most of the day # configure use constant ETC => ‘/disk01/www/html/main/sandbox/liam/etc/’; # require use strict; use RDF::Redland; # sanity check #1 – command line arguments my $db = $ARGV[ 0 ]; my $file = $ARGV[ 1 ]; if ( ! $db or ! $file ) { print “Usage: $0 <db> <file>\n”; exit; } # sanity check #2 – store exists die “Error: po2s file not found. Make a store?\n” if ( ! -e ETC . $db . ‘-po2s.db’ ); die “Error: so2p file not found. Make a store?\n” if ( ! -e ETC . $db . ‘-so2p.db’ ); die “Error: sp2o file not found. Make a store?\n” if ( ! -e ETC . $db . ‘-sp2o.db’ ); # open the store my $etc = ETC; my $store = RDF::Redland::Storage->new( ‘hashes’, $db, “new=’no’, hash-type=’bdb’, dir=’$etc'” ); die “Error: Unable to open store ($!)” unless $store; my $model = RDF::Redland::Model->new( $store, ” ); die “Error: Unable to create model ($!)” unless $model; # sanity check #3 – file exists die “Error: $file not found.\n” if ( ! -e $file ); # parse a file and add it to the store my $uri = RDF::Redland::URI->new( “file:$file” ); my $parser = RDF::Redland::Parser->new( ‘rdfxml’, ‘application/rdf+xml’ ); die “Error: Failed to find parser ($!)\n” if ( ! $parser ); my $stream = $parser->parse_as_stream( $uri, $uri ); my $count = 0; while ( ! $stream->end ) { $model->add_statement( $stream->current ); $count++; $stream->next; } # echo the result warn “Namespaces:\n”; my %namespaces = $parser->namespaces_seen; while ( my ( $prefix, $uri ) = each %namespaces ) { warn ” prefix: $prefix\n”; warn ‘ uri: ‘ . $uri->as_string . “\n”; warn “\n”; } warn “Added $count statements\n”; # “save” $store = undef; $model = undef; # done exit; 10.5 store-search.pl – query a triple store # Eric Lease Morgan <eric_morgan@infomotions.com> # December 14, 2013 – after wrestling with wilson for most of the day # configure use constant ETC => ‘/disk01/www/html/main/sandbox/liam/etc/’; my %namespaces = ( “crm” => “http://erlangen-crm.org/current/”, “dc” => “http://purl.org/dc/elements/1.1/”, “dcterms” => “http://purl.org/dc/terms/”, “event” => “http://purl.org/NET/c4dm/event.owl#”, “foaf” => “http://xmlns.com/foaf/0.1/”, “lode” => “http://linkedevents.org/ontology/”, “lvont” => “http://lexvo.org/ontology#”, “modsrdf” => “http://simile.mit.edu/2006/01/ontologies/mods3#”, “ore” => “http://www.openarchives.org/ore/terms/”, “owl” => “http://www.w3.org/2002/07/owl#”, “rdf” => “http://www.w3.org/1999/02/22-rdf-syntax-ns#”, “rdfs” => “http://www.w3.org/2000/01/rdf-schema#”, “role” => “http://simile.mit.edu/2006/01/roles#”, “skos” => “http://www.w3.org/2004/02/skos/core#”, “time” => “http://www.w3.org/2006/time#”, “timeline” => “http://purl.org/NET/c4dm/timeline.owl#”, “wgs84_pos” => “http://www.w3.org/2003/01/geo/wgs84_pos#” ); # require use strict; use RDF::Redland; # sanity check #1 – command line arguments my $db = $ARGV[ 0 ]; my $query = $ARGV[ 1 ]; if ( ! $db or ! $query ) { print “Usage: $0 <db> <query>\n”; exit; } # sanity check #2 – store exists die “Error: po2s file not found. Make a store?\n” if ( ! -e ETC . $db . ‘-po2s.db’ ); die “Error: so2p file not found. Make a store?\n” if ( ! -e ETC . $db . ‘-so2p.db’ ); die “Error: sp2o file not found. Make a store?\n” if ( ! -e ETC . $db . ‘-sp2o.db’ ); # open the store my $etc = ETC; my $store = RDF::Redland::Storage->new( ‘hashes’, $db, “new=’no’, hash-type=’bdb’, dir=’$etc'” ); die “Error: Unable to open store ($!)” unless $store; my $model = RDF::Redland::Model->new( $store, ” ); die “Error: Unable to create model ($!)” unless $model; # search #my $sparql = RDF::Redland::Query->new( “CONSTRUCT { ?a ?b ?c } WHERE { ?a ?b ?c }”, undef, undef, “sparql” ); my $sparql = RDF::Redland::Query->new( “PREFIX modsrdf: <http://simile.mit.edu/2006/01/ontologies/mods3#>\nSELECT ?a ?b ?c WHERE { ?a modsrdf:$query ?c }”, undef, undef, ‘sparql’ ); my $results = $model->query_execute( $sparql ); print $results->to_string; # done exit;
#!/usr/bin/perl # store-dump.pl – output the content of store as RDF/XML # Eric Lease Morgan <eric_morgan@infomotions.com> # # December 14, 2013 – after wrestling with wilson for most of the day # configure use constant ETC => ‘/disk01/www/html/main/sandbox/liam/etc/’; # require use strict; use RDF::Redland; # sanity check #1 – command line arguments my $db = $ARGV[ 0 ]; my $uri = $ARGV[ 1 ]; if ( ! $db ) { print “Usage: $0 <db> <uri>\n”; exit; } # sanity check #2 – store exists die “Error: po2s file not found. Make a store?\n” if ( ! -e ETC . $db . ‘-po2s.db’ ); die “Error: so2p file not found. Make a store?\n” if ( ! -e ETC . $db . ‘-so2p.db’ ); die “Error: sp2o file not found. Make a store?\n” if ( ! -e ETC . $db . ‘-sp2o.db’ ); # open the store my $etc = ETC; my $store = RDF::Redland::Storage->new( ‘hashes’, $db, “new=’no’, hash-type=’bdb’, dir=’$etc'” ); die “Error: Unable to open store ($!)” unless $store; my $model = RDF::Redland::Model->new( $store, ” ); die “Error: Unable to create model ($!)” unless $model; # do the work my $serializer = RDF::Redland::Serializer->new; print $serializer->serialize_model_to_string( RDF::Redland::URI->new, $model ); # done exit;
#!/usr/bin/perl # sparql.pl – a brain-dead, half-baked SPARQL endpoint # Eric Lease Morgan <eric_morgan@infomotions.com> # December 15, 2013 – first investigations # require use CGI; use CGI::Carp qw( fatalsToBrowser ); use RDF::Redland; use strict; # initialize my $cgi = CGI->new; my $query = $cgi->param( ‘query’ ); if ( ! $query ) { print $cgi->header; print &home } else { # open the store for business my $store = RDF::Redland::Storage->new( ‘hashes’, ‘store’, “new=’no’, hash-type=’bdb’, dir=’/disk01/www/html/main/sandbox/liam/etc'” ); my $model = RDF::Redland::Model->new( $store, ” ); # search my $results = $model->query_execute( RDF::Redland::Query->new( $query, undef, undef, ‘sparql’ ) ); # return the results print $cgi->header( -type => ‘application/xml’ ); print $results->to_string; } # done exit; sub home { # create a list namespaces my $namespaces = &namespaces; my $list = ”; foreach my $prefix ( sort keys $namespaces ) { my $uri = $$namespaces{ $prefix }; $list .= $cgi->li( “$prefix – ” . $cgi->a( { href=> $uri, target => ‘_blank’ }, $uri ) ); } $list = $cgi->ol( $list ); # return a home page return <<EOF <html> <head> <title>LiAM SPARQL Endpoint</title> </head> <body style=’margin: 7%’> <h1>LiAM SPARQL Endpoint</h1> <p>This is a brain-dead and half-baked SPARQL endpoint to a subset of LiAM linked data. Enter a query, but there is the disclaimer. Errors will probably happen because of SPARQL syntax errors. Remember, the interface is brain-dead. Your milage <em>will</em> vary.</p> <form method=’GET’ action=’./’> <textarea style=’font-size: large’ rows=’5′ cols=’65’ name=’query’ /> PREFIX hub:<http://data.archiveshub.ac.uk/def/> SELECT ?uri WHERE { ?uri ?o hub:FindingAid } </textarea><br /> <input type=’submit’ value=’Search’ /> </form> <p>Here are a few sample queries:</p> <ul> <li>Find all triples with RDF Schema labels – <code><a href=”http://infomotions.com/sandbox/liam/sparql/?query=PREFIX+rdf%3A%3Chttp%3A%2F%2Fwww.w3.org%2F2000%2F01%2Frdf-schema%23%3E%0D%0ASELECT+*+WHERE+%7B+%3Fs+rdf%3Alabel+%3Fo+%7D%0D%0A”>PREFIX rdf:<http://www.w3.org/2000/01/rdf-schema#> SELECT * WHERE { ?s rdf:label ?o }</a></code></li> <li>Find all items with MODS subjects – <code><a href=’http://infomotions.com/sandbox/liam/sparql/?query=PREFIX+mods%3A%3Chttp%3A%2F%2Fsimile.mit.edu%2F2006%2F01%2Fontologies%2Fmods3%23%3E%0D%0ASELECT+*+WHERE+%7B+%3Fs+mods%3Asubject+%3Fo+%7D’>PREFIX mods:<http://simile.mit.edu/2006/01/ontologies/mods3#> SELECT * WHERE { ?s mods:subject ?o }</a></code></li> <li>Find every unique predicate – <code><a href=”http://infomotions.com/sandbox/liam/sparql/?query=SELECT+DISTINCT+%3Fp+WHERE+%7B+%3Fs+%3Fp+%3Fo+%7D”>SELECT DISTINCT ?p WHERE { ?s ?p ?o }</a></code></li> <li>Find everything – <code><a href=”http://infomotions.com/sandbox/liam/sparql/?query=SELECT+*+WHERE+%7B+%3Fs+%3Fp+%3Fo+%7D”>SELECT * WHERE { ?s ?p ?o }</a></code></li> <li>Find all classes – <code><a href=”http://infomotions.com/sandbox/liam/sparql/?query=SELECT+DISTINCT+%3Fclass+WHERE+%7B+%5B%5D+a+%3Fclass+%7D+ORDER+BY+%3Fclass”>SELECT DISTINCT ?class WHERE { [] a ?class } ORDER BY ?class</a></code></li> <li>Find all properties – <code><a href=”http://infomotions.com/sandbox/liam/sparql/?query=SELECT+DISTINCT+%3Fproperty%0D%0AWHERE+%7B+%5B%5D+%3Fproperty+%5B%5D+%7D%0D%0AORDER+BY+%3Fproperty”>SELECT DISTINCT ?property WHERE { [] ?property [] } ORDER BY ?property</a></code></li> <li>Find URIs of all finding aids – <code><a href=”http://infomotions.com/sandbox/liam/sparql/?query=PREFIX+hub%3A%3Chttp%3A%2F%2Fdata.archiveshub.ac.uk%2Fdef%2F%3E+SELECT+%3Furi+WHERE+%7B+%3Furi+%3Fo+hub%3AFindingAid+%7D”>PREFIX hub:<http://data.archiveshub.ac.uk/def/> SELECT ?uri WHERE { ?uri ?o hub:FindingAid }</a></code></li> <li>Find URIs of all MARC records – <code><a href=”http://infomotions.com/sandbox/liam/sparql/?query=PREFIX+mods%3A%3Chttp%3A%2F%2Fsimile.mit.edu%2F2006%2F01%2Fontologies%2Fmods3%23%3E+SELECT+%3Furi+WHERE+%7B+%3Furi+%3Fo+mods%3ARecord+%7D%0D%0A%0D%0A%0D%0A”>PREFIX mods:<http://simile.mit.edu/2006/01/ontologies/mods3#> SELECT ?uri WHERE { ?uri ?o mods:Record }</a></code></li> <li>Find all URIs of all collections – <code><a href=”http://infomotions.com/sandbox/liam/sparql/?query=PREFIX+mods%3A%3Chttp%3A%2F%2Fsimile.mit.edu%2F2006%2F01%2Fontologies%2Fmods3%23%3E%0D%0APREFIX+hub%3A%3Chttp%3A%2F%2Fdata.archiveshub.ac.uk%2Fdef%2F%3E%0D%0ASELECT+%3Furi+WHERE+%7B+%7B+%3Furi+%3Fo+hub%3AFindingAid+%7D+UNION+%7B+%3Furi+%3Fo+mods%3ARecord+%7D+%7D%0D%0AORDER+BY+%3Furi%0D%0A”>PREFIX mods:<http://simile.mit.edu/2006/01/ontologies/mods3#> PREFIX hub:<http://data.archiveshub.ac.uk/def/> SELECT ?uri WHERE { { ?uri ?o hub:FindingAid } UNION { ?uri ?o mods:Record } } ORDER BY ?uri</a></code></li> </ul> <p>This is a list of ontologies (namespaces) used in the triple store as predicates:</p> $list <p>For more information about SPARQL, see:</p> <ol> <li><a href=”http://www.w3.org/TR/rdf-sparql-query/” target=”_blank”>SPARQL Query Language for RDF</a> from the W3C</li> <li><a href=”http://en.wikipedia.org/wiki/SPARQL” target=”_blank”>SPARQL</a> from Wikipedia</li> </ol> <p>Source code — <a href=”http://infomotions.com/sandbox/liam/bin/sparql.pl”>sparql.pl</a> — is available online.</p> <hr /> <p> <a href=”mailto:eric_morgan\@infomotions.com”>Eric Lease Morgan <eric_morgan\@infomotions.com></a><br /> January 6, 2014 </p> </body> </html> EOF } sub namespaces { my %namespaces = ( “crm” => “http://erlangen-crm.org/current/”, “dc” => “http://purl.org/dc/elements/1.1/”, “dcterms” => “http://purl.org/dc/terms/”, “event” => “http://purl.org/NET/c4dm/event.owl#”, “foaf” => “http://xmlns.com/foaf/0.1/”, “lode” => “http://linkedevents.org/ontology/”, “lvont” => “http://lexvo.org/ontology#”, “modsrdf” => “http://simile.mit.edu/2006/01/ontologies/mods3#”, “ore” => “http://www.openarchives.org/ore/terms/”, “owl” => “http://www.w3.org/2002/07/owl#”, “rdf” => “http://www.w3.org/1999/02/22-rdf-syntax-ns#”, “rdfs” => “http://www.w3.org/2000/01/rdf-schema#”, “role” => “http://simile.mit.edu/2006/01/roles#”, “skos” => “http://www.w3.org/2004/02/skos/core#”, “time” => “http://www.w3.org/2006/time#”, “timeline” => “http://purl.org/NET/c4dm/timeline.owl#”, “wgs84_pos” => “http://www.w3.org/2003/01/geo/wgs84_pos#” ); return \%namespaces; }
# package Apache2::LiAM::Dereference; # Dereference.pm – Redirect user-agents based on value of URI. # Eric Lease Morgan <eric_morgan@infomotions.com> # December 7, 2013 – first investigations; based on Apache2::Alex::Dereference # configure use constant PAGES => ‘http://infomotions.com/sandbox/liam/pages/’; use constant DATA => ‘http://infomotions.com/sandbox/liam/data/’; # require use Apache2::Const -compile => qw( OK ); use CGI; use strict; # main sub handler { # initialize my $r = shift; my $cgi = CGI->new; my $id = substr( $r->uri, length $r->location ); # wants RDF if ( $cgi->Accept( ‘text/html’ )) { print $cgi->header( -status => ‘303 See Other’, -Location => PAGES . $id . ‘.html’, -Vary => ‘Accept’ ) } # give them RDF else { print $cgi->header( -status => ‘303 See Other’, -Location => DATA . $id . ‘.rdf’, -Vary => ‘Accept’, “Content-Type” => ‘application/rdf+xml’ ) } # done return Apache2::Const::OK; } 1; # return true or die
2014-02-17T04:40:33+00:00 LiAM: Linked Archival Metadata: Linked data and archival practice: Or, There is more than one way to skin a cat. http://sites.tufts.edu/liam/2014/02/08/skin-a-cat/Two recent experiences have taught me that — when creating some sort of information service — linked data will reside and be mixed in with data collected from any number of Internet techniques. Linked data interfaces will coexist with REST-ful interfaces, or even things as rudimentary as FTP. To the archivist, this means linked data is not the be-all and end-all of information publishing. There is no such thing. To the application programmer, this means you will need to have experience with a ever-growing number of Internet protocols. To both it means, “There is more than one way to skin a cat.”

Hamburg, Germany

Philadelphia, United States
In summary, the technologies described in this Guidebook are not the only way to accomplish the goals of archivists wishing to make their content more accessible. [5] Instead, linked data is just one of many protocols in the toolbox. It is open, standards-based, and simpler rather than more complex. On the other hand, other protocols exist which have a different set of strengths and weaknesses. Computer technologists will need to have a larger rather than smaller knowledge of various Internet tools. For archivists, the core of the problem is still the collection and description of content. This — a what of archival practice — continues to remain constant. It is the how of archival practice — the technology — that changes at a much faster pace.
What can you do with archival linked data once it is created? Here are three use cases:
This text is a part of a draft sponsored by LiAM — the Linked Archival Metadata: A Guidebook.
2014-02-07T02:43:25+00:00 LiAM: Linked Archival Metadata: Beginner’s glossary to linked data http://sites.tufts.edu/liam/2014/02/03/glossary/This is a beginner’s glossary to linked data. It is a part of the yet-to-be published LiAM Guidebook on linked data in archives.
For a more complete and exhaustive glossary, see the W3C’s Linked Data Glossary.
2014-02-04T01:47:15+00:00 LiAM: Linked Archival Metadata: RDF serializations http://sites.tufts.edu/liam/2014/01/31/serializations/RDF can be expressed in many different formats, called “serializations”.
RDF (Resource Description Framework) is a conceptual data model made up of “sentences” called triples — subjects, predicates, and objects. Subjects are expected to be URIs. Objects are expected to be URIs or string literals (think words, phrases, or numbers). Predicates are “verbs” establishing relationships between the subjects and the objects. Each triple is intended to denote a specific fact.
When the idea of the Semantic Web was first articulated XML was the predominant data structure of the time. It was seen as a way to encapsulate data that was both readable by humans as well as computers. Like any data structure, XML has both its advantages as well as disadvantages. On one hand it is easy to determine whether or not XML files are well-formed, meaning they are syntactically correct. Given a DTD, or better yet, an XML schema, it is also easy determine whether or not an XML file is valid — meaning does it contain the necessary XML elements, attributes, and are they arranged and used in the agreed upon manner. XML also lends itself to transformations into other plain text documents through the generic, platform-independent XSLT (Extensible Stylesheet Language Transformation) process. Consequently, RDF was originally manifested — made real and “serialized” — though the use of RDF/XML. The example of RDF at the beginning of the Guidebook was an RDF/XML serialization:
<?xml version="1.0"?>
<rdf:RDF xmlns:rdf="http://www.w3.org/1999/02/22-rdf-syntax-ns#"
         xmlns:dcterms="http://purl.org/dc/terms/"
         xmlns:foaf="http://xmlns.com/foaf/0.1/">
  <rdf:Description rdf:about="http://en.wikipedia.org/wiki/Declaration_of_Independence">
    <dcterms:creator>
      <foaf:Person rdf:about="http://id.loc.gov/authorities/names/n79089957">
        <foaf:gender>male</foaf:gender>
      </foaf:Person>
    </dcterms:creator>
  </rdf:Description>
</rdf:RDF>
This RDF can be literally illustrated with the graph, below:

On the other hand, XML, almost by definition, is verbose. Element names are expected to be human-readable and meaningful, not obtuse nor opaque. The judicious use of special characters (&, <, >, “, and ‘) as well as entities only adds to the difficulty of actually reading XML. Consequently, almost from the very beginning people thought RDF/XML was not the best way to express RDF, and since then a number of other syntaxes — data structures — have manifested themselves.
Below is the same RDF serialized in a format called Notation 3 (N3), which is very human readable, but not extraordinarily structured enough for computer processing. It incorporates the use of a line-based data structure called N-Triples used to denote the triples themselves:
@prefix foaf: <http://xmlns.com/foaf/0.1/>.
@prefix rdf: <http://www.w3.org/1999/02/22-rdf-syntax-ns#>.
@prefix dcterms: <http://purl.org/dc/terms/>.
<http://en.wikipedia.org/wiki/Declaration_of_Independence> dcterms:creator <http://id.loc.gov/authorities/names/n79089957>.
<http://id.loc.gov/authorities/names/n79089957> a foaf:Person;
	foaf:gender "male".
JSON (JavaScript Object Notation) is a popular data structure inherent to the use of JavaScript and Web browsers, and RDF can be expressed in a JSON format as well:
{
  "http://en.wikipedia.org/wiki/Declaration_of_Independence": {
    "http://purl.org/dc/terms/creator": [
      {
        "type": "uri",
        "value": "http://id.loc.gov/authorities/names/n79089957"
      }
    ]
  },
  "http://id.loc.gov/authorities/names/n79089957": {
    "http://xmlns.com/foaf/0.1/gender": [
      {
        "type": "literal",
        "value": "male"
      }
    ],
    "http://www.w3.org/1999/02/22-rdf-syntax-ns#type": [
      {
        "type": "uri",
        "value": "http://xmlns.com/foaf/0.1/Person"
      }
    ]
  }
}
Just about the newest RDF serialization is an embellishment of JSON called JSON-LD. Compare & contrasts the serialization below to the one above:
{
  "@graph": [
    {
      "@id": "http://en.wikipedia.org/wiki/Declaration_of_Independence",
      "http://purl.org/dc/terms/creator": {
        "@id": "http://id.loc.gov/authorities/names/n79089957"
      }
    },
    {
      "@id": "http://id.loc.gov/authorities/names/n79089957",
      "@type": "http://xmlns.com/foaf/0.1/Person",
      "http://xmlns.com/foaf/0.1/gender": "male"
    }
  ]
}
RDFa represents a way of expressing RDF embedded in HTML, and here is such an expression:
<div xmlns="http://www.w3.org/1999/xhtml"
  prefix="
    foaf: http://xmlns.com/foaf/0.1/
    rdf: http://www.w3.org/1999/02/22-rdf-syntax-ns#
    dcterms: http://purl.org/dc/terms/
    rdfs: http://www.w3.org/2000/01/rdf-schema#"
  >
  <div typeof="rdfs:Resource" about="http://en.wikipedia.org/wiki/Declaration_of_Independence">
    <div rel="dcterms:creator">
      <div typeof="foaf:Person" about="http://id.loc.gov/authorities/names/n79089957">
        <div property="foaf:gender" content="male"></div>
      </div>
    </div>
  </div>
</div>
The purpose of publishing linked data is to make RDF triples easily accessible. This does not necessarily mean the transformation of EAD or MARC into RDF/XML, but rather making accessible the statements of RDF within the context of the reader. In this case, the reader may be a human or some sort of computer program. Each serialization has its own strengths and weaknesses. Ideally the archive would figure out ways exploit each of these RDF serializations in specific publishing purposes.
For a good time, play with the RDF Translator which will convert one RDF serialization into another.
The RDF serialization process also highlights how data structures are moving away from document-centric models to statement-central models. This too has consequences for way cultural heritage institutions, like archives, think about exposing their metadata, but that is the topic of another essay.
2014-01-31T18:07:50+00:00 LiAM: Linked Archival Metadata: CURL and content-negotiation http://sites.tufts.edu/liam/2014/01/26/cur/This is the tiniest introduction to cURL and content-negotiation. It is a part of the to-be-published-in-April Linked Archival Metadata guidebook.
CURL is a command-line tool making it easier for you to see the Web as data and not presentation. It is a sort of Web browser, but more specifically, it is a thing called a user-agent. Content-negotiation is an essential technique for publishing and making accessible linked data. Please don’t be afraid of the command-line though. Understanding how to use cURL and do content-negotiation by hand will take you a long way in understanding linked data.
The first step is to download and install cURL. If you have a Macintosh or a Linux computer, then it is probably already installed. If not, then give the cURL download wizard a whirl. We’ll wait.
Next, you need to open a terminal. On Macintosh computers a terminal application is located in the Utilities folder of your Applications folder. It is called “Terminal”. People using Windows-based computers can find the “Command” application by searching for it in the Start Menu. Once cURL has been installed and a terminal has been opened, then you can type the following command at the prompt to display a help text:
curl --help
There are many options there, almost too many. It is often useful to view only one page of text at a time, and you can “pipe” the output through to a program called “more” to do this. By pressing the space bar, you can go forward in the display. By pressing “b” you can go backwards, and by pressing “q” you can quit:
curl --help | more
Feed cURL the complete URL of Google’s home page to see how much content actually goes into their “simple” presentation:
curl http://www.google.com/ | more
The communication of the World Wide Web (the hypertext transfer protocol or HTTP) is divided into two parts: 1) a header, and 2) a body. By default cURL displays the body content. To see the header, add the -I (for a mnemonic, think “information”) to the command:
curl -I http://www.google.com/
The result will be a list of characteristics the remote Web server is using to describe this particular interaction between itself and you. The most important things to note are: 1) the status line and 2) the content type. The status line will be the first line in the result, and it will say something like “HTTP/1.1 200 OK”, meaning there were no errors. Another line will begin with “Content-Type:” and denotes the format of the data being transferred. In most cases the content type line will include something like “text/html” meaning the content being sent is in the form of an HTML document.
Now feed cURL a URI for Walt Disney, such as one from DBpedia:
curl http://dbpedia.org/resource/Walt_Disney
The result will be empty, but upon the use of the -I switch you can see how the status line changed to “HTTP/1.1 303 See Other”. This means there is no content at the given URI, and the line starting with “Location:” is a pointer — an instruction — to go to a different document. In the parlance of HTTP this is called redirection. Using cURL going to the recommended location results in a stream of HTML:
curl http://dbpedia.org/page/Walt_Disney | more
Most Web browsers automatically follow HTTP redirection commands, but cURL needs to be told this explicitly through the use of the -L switch. (Think “location”.) Consequently, given the original URI, the following command will display HTML even though the URI has no content:
curl -L http://dbpedia.org/resource/Walt_Disney | more
Now remember, the Semantic Web and linked data depend on the exchange of RDF, and upon closer examination you can see there are “link” elements in the resulting HTML, and these elements point to URLs with the .rdf extension. Feed these URLs to cURL to see an RDF representation of the Walt Disney data:
curl http://dbpedia.org/data/Walt_Disney.rdf | more
Downloading entire HTML streams, parsing them for link elements containing URLs of RDF, and then requesting the RDF is not nearly as efficient as requesting RDF from the remote server in the first place. This can be done by telling the remote server you accept RDF as a format type. This is accomplished through the use of the -H switch. (Think “header”.) For example, feed cURL the URI for Walt Disney and specify your desire for RDF/XML:
curl -H "Accept: application/rdf+xml" http://dbpedia.org/resource/Walt_Disney
Ironically, the result will be empty, and upon examination of the HTTP headers (remember the -I switch) you can see that the RDF is located at a different URL, namely, http://dbpedia.org/data/Walt_Disney.xml:
curl -I -H "Accept: application/rdf+xml" http://dbpedia.org/resource/Walt_Disney
Finally, using the -L switch, you can use the URI for Walt Disney to request the RDF directly:
curl -L -H "Accept: application/rdf+xml" http://dbpedia.org/resource/Walt_Disney
That is cURL and content-negotiation in a nutshell. A user-agent submits a URI to a remote HTTP server and specifies the type of content it desires. The HTTP server responds with URLs denoting the location of desired content. The user-agent then makes a more specific request. It is sort of like the movie. “One URI to rule them all.” In summary, remember:
Use cURL to actually see linked data in action, and here are a few more URIs to explore:
Yesterday I received the following set of questions from a library school student concerting RDF and linked data. They are excellent questions and the sort I am expected to answer in the LiAM Guidebook. I thought I’d post my reply here. Their identity has been hidden to protect the innocent.
I’m writing you to ask you about your thoughts on implementing these kinds of RDF descriptions for institutional collections. Have you worked on a project that incorporated LD technologies like these descriptions? What was that experience like? Also, what kind of strategies have you used to implement these strategies, for instance, was considerable buy-in from your organization necessary, or were you able to spearhead it relatively solo? In essence, what would it “cost” to really do this?
I apologize for the mass of questions, especially over e-mail. My only experience with ontology work has been theoretical, and I haven’t met any professionals in the field yet who have actually used it. When I talk to my mentors about it, they are aware of it from an academic standpoint but are wary of it due these questions of cost and resource allocation, or confusion that it doesn’t provide anything new for users. My final project was to build an ontology to describe some sort of resource and I settled on building a vocabulary to describe digital facsimiles and their physical artifacts, but I have yet to actually implement or use any of it. Nor have I had a chance yet to really use any preexisting vocabularies. So I’ve found myself in a slightly frustrating position where I’ve studied this from an academic perspective and seek to incorporate it in my GLAM work, but I lack the hands-on opportunity to play around with it.
–
MLIS Candidate
Dear MLIS Candidate, no problem, really, but I don’t know how much help I will really be.
The whole RDF / Semantic Web thing started more than ten years ago. The idea was to expose RDF/XML, allow robots to crawl these files, amass the data, and discover new knowledge — relationships — underneath. Many in the library profession thought this was science fiction and/or the sure pathway to professional obsolescence. Needless to say, it didn’t get very far. A few years ago the idea of linked data was articulated, and it a nutshell it outlined how to make various flavors of serialized RDF available via an HTTP technique called content negotiation. This was when things like Turtle, N3, the idea of triple stores, maybe SPARQL, and other things came to fruition. This time the idea of linked data was more real and got a bit more traction, but it is still not main stream.
I have very little experience putting the idea of RDF and linked data into practice. A long time ago I created RDF versions of my Alex Catalogue and implemented a content negotiation tool against it. The Catalogue was not a part of any institution other than myself. When I saw the call for the LiAM Guidebook I applied and got the “job” because of my Alex Catalogue experiences as well as some experience with a thing colloquially called The Catholic Portal which contains content from EAD files.
I knew this previously, but linked data is all about URIs and ontologies. Minting URIs is not difficult, but instead of rolling your own, it is better to use the URIs of others, such as the URIs in DBpedia, GeoNames, VIAF, etc. The ontologies used to create relationships between the URIs are difficult to identify, articulate, and/or use consistently. They are manifestations of human language, and human language is ambiguous. Trying to implement the nuances of human language in computer “sentences” called RDF triples is only an approximation at best. I sometimes wonder if the whole thing can really come to fruition. I look at OAI-PMH. It had the same goals, but it was finally called not a success because it was too difficult to implement. The Semantic Web may follow suit.
That said, it is not too difficult to make the metadata of just about any library or archive available as linked data. The technology is inexpensive and already there. The implementation will not necessarily implement best practices, but it will not expose incorrect nor invalid data, just data that is not the best. Assuming the library has MARC or EAD files, it is possible to use XSL to transform the metadata into RDF/XML. HTML and RDF/XML versions of the metadata can then be saved on an HTTP file system and disseminated either to humans or robots through content negotiation. Once a library or archive gets this far they can then either improve their MARC or EAD files to include more URIs, they can improve their XSLT to take better advantage of shared ontologies, and/or they can dump MARC and EAD all together and learn to expose linked data directly from (relational) databases. It is an iterative process which is never completed.
Nothing new to users? Ah, that is the rub and a sticking point with the linked data / Semantic Web thing. It is a sort of chicken & egg problem. “Show me the cool application that can be created if I expose my metadata as linked data”, say some people. On the other hand, “I can not create the cool application until there is a critical mass of available content.” Despite this issue, things are happening for readers, namely mash-ups. (I don’t like the word “users”.) Do a search in Facebook for the Athens. You will get a cool looking Web page describing Athens, who has been there, etc. This was created by assembling metadata from a host of different places (all puns intended), and one of those places were linked data repositories. Do a search in Google for the same thing. Instead of just bringing back a list of links, Google presents you with real content, again, amassed through various APIs including linked data. Visit VIAF and search for a well-known author. Navigate the result an you will maybe end up at WorldCat identities where all sorts of interesting information about an author, who they wrote with, what they wrote, and where is displayed. All of this is rooted in linked data and Web Services computing techniques. This is where the benefit comes. Library and archival metadata will become part of these mash-up — called “named graphs” — driving readers to library and archival websites. Linked data can become part of Wikipedia. It can be used to enrich descriptions of people in authority lists, gazetteers, etc.
What is the cost? Good question. Time is the biggest expense. If a person knows what they are doing, then a robust set of linked data could be exposed in less than a month, but in order to get that far many people need to contribute. Systems types to get the data out of content management systems as well as set up HTTP servers. Programmers will be needed to do the transformations. Catalogers will be needed to assist in the interpretation of AACR2 cataloging practices, etc. It will take a village to do the work, and that doesn’t even count convincing people this is a good idea.
Your frustration is not uncommon. Often times if there is not a real world problem to solve, learning anything new when it comes to computers is difficult. I took BASIC computer programming three times before anything sunk in, and it only sunk in when I needed to calculate how much money I was earning as a taxi driver.

linked data sets as of 2011
On one hand the process is not difficult. It is a matter of repurposing the already existing skills of people who work in cultural heritage institutions. On the other hand, change in the ways things are done is difficult (but not as difficult in the what of what is done). The change is difficult to balance existing priorities. Exposing library and archival content as linked data represents a different working style, but the end result is the same — making the content of our collections available for use and understanding.
HTH.
2014-01-22T02:59:36+00:00 Life of a Librarian: Paper Machines http://sites.nd.edu/emorgan/2014/01/paper-machines/Today I learned about Paper Machines, a very useful plug-in for Zotero allowing the reader to do visualizations against their collection of citations.
Today Jeffrey Bain-Conkin pointed me towards a website called Lincoln Logarithms where sermons about Abraham Lincoln and slavery were analyzed. To do some of the analysis a Zotero plug-in called Paper Machines was used, and it works pretty well:
I am in the process of writing a book on linked data for archivists. I have am using Zotero to keep track the books citations, etc. I used Paper Machines to generate the following images:
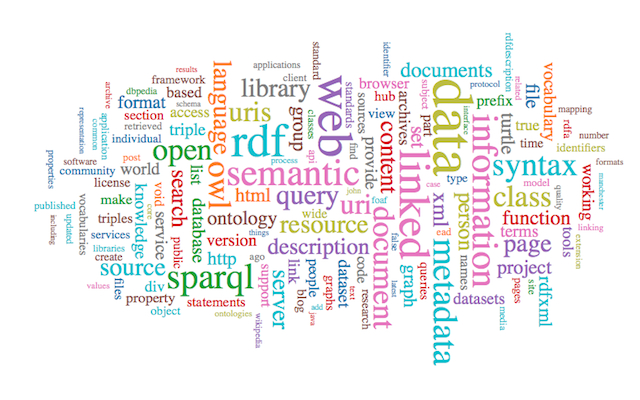
a word cloud where the words are weighted by a TF-IDF score
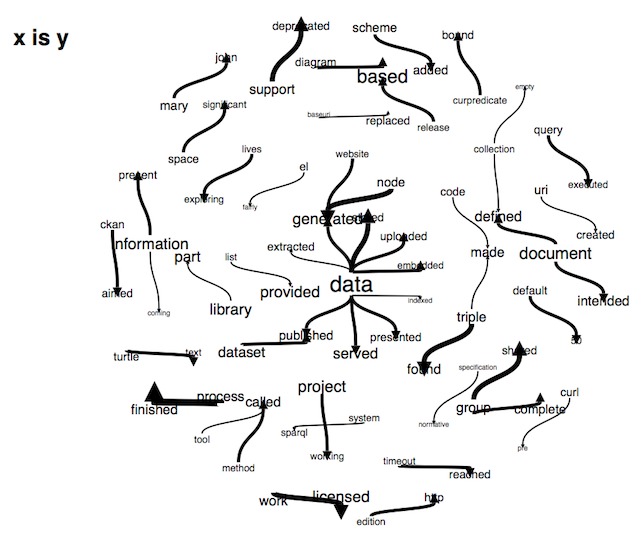
a “phrase net” where the words are joined by the word “is”
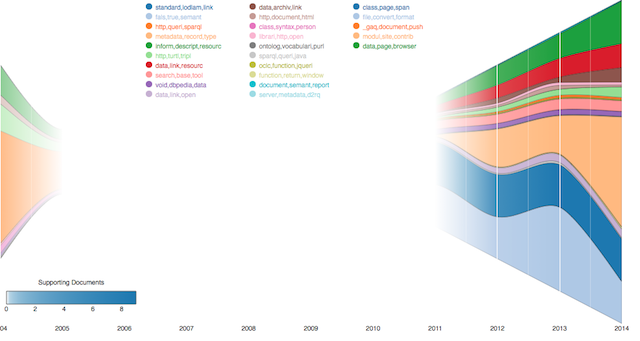
a topic modeling map — illustration of automatically classified documents
From these visualizations I learned:
I have often thought collections of metadata (citations, MARC records, the output from JSTOR’s Data For Research service) could easily be evaluated and visualized. Paper Machines does just that. I wish I had done it. (To some extent, I have, but the work is fledgling and called JSTOR Tool.)
In any event, if you use Zotero, then I suggest you give Paper Machines a try.
2014-01-22T02:36:43+00:00 LiAM: Linked Archival Metadata: Linked Archival Metadata: A Guidebook — a fledgling draft http://sites.tufts.edu/liam/2014/01/18/draft-2014-01-18/For simplicity’s sake, I am making both a PDF and ePub version of the fledgling book called Linked Archival Metadata: A Guidebook available in this blog posting. It includes some text in just about every section of the Guidebook’s prospectus. Feedback is most desired.
2014-01-19T02:51:46+00:00 LiAM: Linked Archival Metadata: RDF ontologies for archival descriptions http://sites.tufts.edu/liam/2014/01/18/ontologies/If you were to select a set of RDF ontologies intended to be used in the linked data of archival descriptions, then what ontologies would you select?
For simplicity’s sake, RDF ontologies are akin to the fields in MARC records or the entities in EAD/XML files. Articulated more accurately, they are the things denoting relationships between subjects and objects in RDF triples. In this light, they are akin to the verbs in all but the most simplistic of sentences. But if they are akin to verbs, then they bring with them all of the nuance and subtlety of human written language. And human written language, in order to be an effective human communications device, comes with two equally important prerequisites: 1) a writer who can speak to an intended audience, and 2) a reader with a certain level of intelligence. A writer who does not use the language of the intended audience speaks to few, and a reader who does not “bring something to the party” goes away with litte understanding. Because the effectiveness of every writer is not perfect, and because not every reader comes to the party with a certain level of understanding, written language is imperfect. Similarly, the ontologies of linked data are imperfect. There are no perfect ontologies nor absolutely correct uses of them. There are only best practices and common usages.
This being the case, ontologies still need to be selected in order for linked data to be manifested. What ontologies would you suggest be used when creating linked data for archival descriptions? Here are a few possibilities, listed in no priority order:
While some or all of these ontologies may be useful for linked data of archival descriptions, what might some other ontologies include? (Remember, it is often “better” to select existing ontologies rather than inventing, unless there is something distinctly unique about a particular domain.) For example, how about an ontology denoting times? Or how about one for places? FOAF is good for people, but what about organizations or institutions?
Inquiring minds would like to know.
2014-01-19T02:34:58+00:00 Life of a Librarian: Simple text analysis with Voyant Tools http://sites.nd.edu/emorgan/2014/01/voyant-tools/Voyant Tools is a Web-based application for doing a number of straight-forward text analysis functions, including but not limited to: word counts, tag cloud creation, concordancing, and word trending. Using Voyant Tools a person is able to read a document “from a distance”. It enables the reader to extract characteristics of a corpus quickly and accurately. Voyant Tools can be used to discover underlying themes in texts or verify propositions against them. This one-hour, hands-on workshop familiarizes the student with Voyant Tools and provides a means for understanding the concepts of text mining. (This document is also available as a PDF document suitable for printing.)
Voyant Tools is located at http://voyant-tools.org, and the easiest way to get started is by pasting into its input box a URL or a blob of text. For learning purposes, enter one of the URL’s found at the end of this document, select from Thoreau’s Walden, Melville’s Moby Dick, or Twain’s Eve’s Diary, or enter a URL of your own choosing. Voyant Tools can read the more popular file formats, so URL’s pointing to PDF, Word, RTF, HTMl, and XML files will work well. Once given a URL, Voyant Tools will retrieve the associated text and do some analysis. Below is what is displayed when Walden is used as an example.
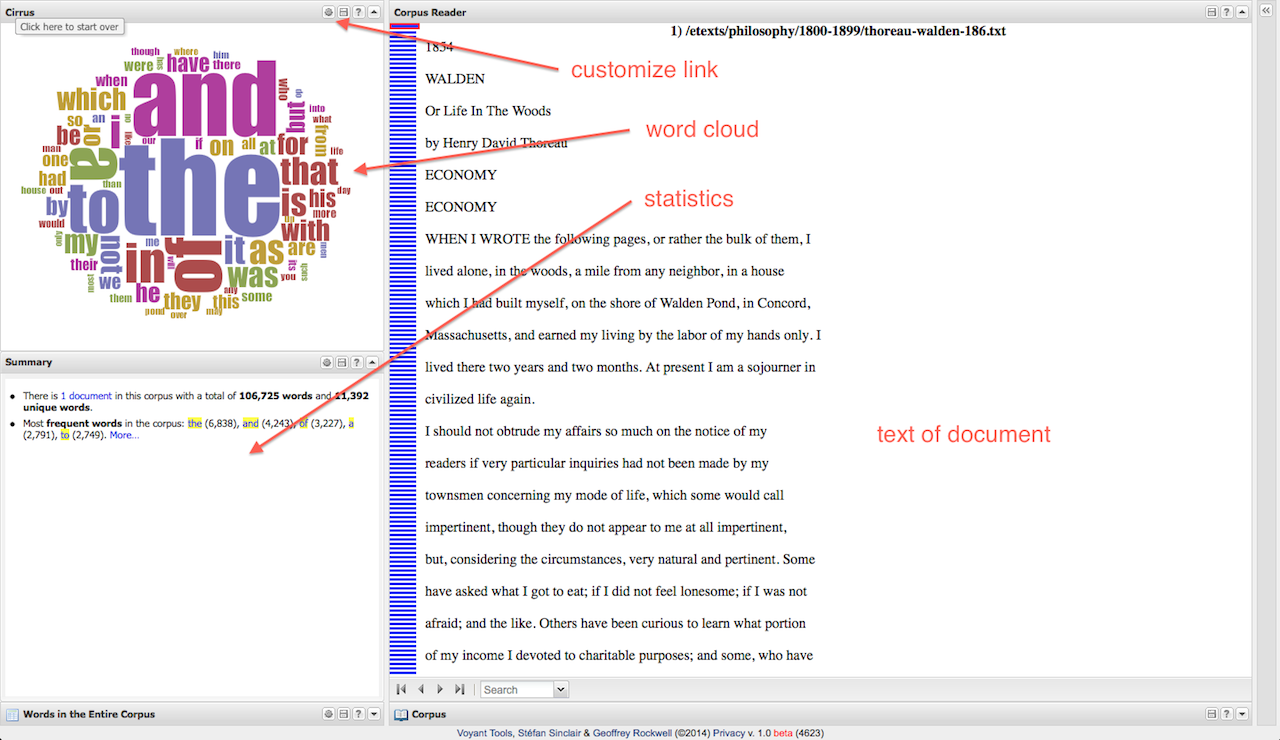 Voyant Tools |
In the upper left-hand corner is a word cloud. In the lower-left hand corner are some statistics. The balance of the screen is made up of the text. The word cloud probably does not provide you with very much useful information because stop words have not been removed from the analysis. By clicking on the word cloud customization link, you can choose from a number of stop word sets, and the result will make much more sense. Figure #2 illustrates the appearance of the word cloud once the English stop words are employed.
By selecting words from the word cloud a word trends graph appears illustrating the relative frequency of the selection compared to its location in the text. You can use this tool to determine the consistency of the theme throughout the text. You can compare the frequency of additional words by entering them into the word trends search box. Figure #3 illustrates the frequency of the words pond and ice.
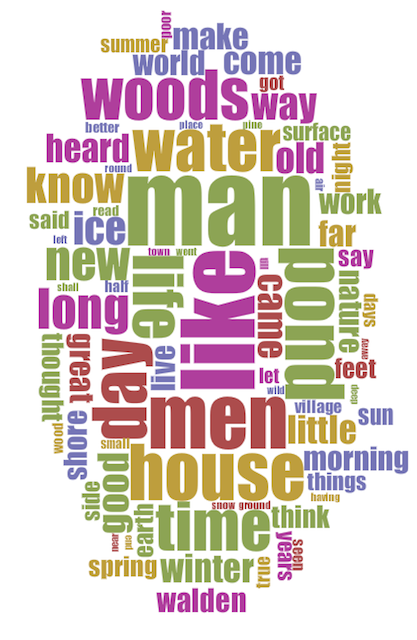 Figure 2 – word cloud |
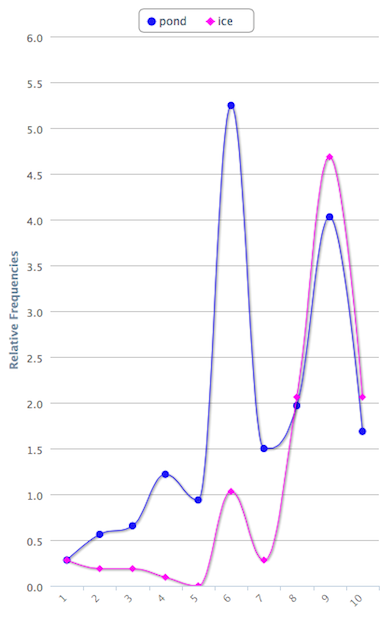 Figure 3 – word trends |
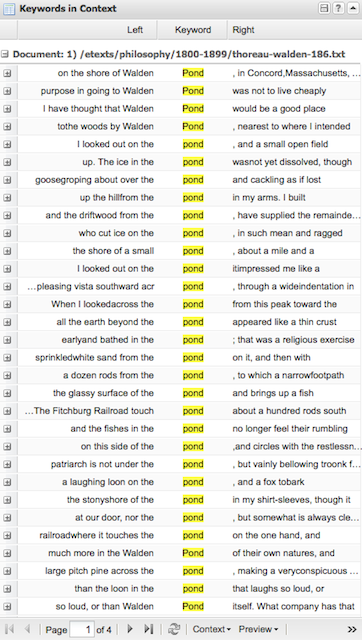 Figure 4 – concordance |
Once you select a word from the word cloud, a concordance appears in the lower right hand corner of the screen. You can use this tool to: 1) see what words surround your selected word, and 2) see how the word is used in the context of the entire work. Figure #4 is an illustration of the concordance. The set of horizontal blue lines in the center of the screen denote where the selected word is located in the text. The darker the blue line is the more times the selected word appears in that area of the text.
On the surface of things you might ask yourself, “What good is this?” The answer lies in your ability to ask different types of questions against a text — questions you may or may not have been able to ask previously but are now able to ask because things like Voyant Tools count and tabulate words. Questions like:
Voyant Tools includes a number of other features. For example, multiple URLs can be entered into the home page’s input box. This enables the reader to examine many documents all at one time. (Try adding all the URLs at the end of the document.) After doing so many of the features of Voyant Tools work in a similar manner, but others become more interesting. For example, the summary pane in the lower left corner allows you to compare words across documents. (Consider applying stop words feature to the pane in order to make things more meaningful.) Each of Voyant Tools’ panes can be exported to HTML files or linked from other documents. This is facilitated by clicking on the small icons in the upper right-hand corner of each pane. Use this feature to embed Voyant illustrations into Web pages or printed documents. By exploring the content of a site called Hermeneuti.ca (http:/hermeneuti.ca) you can discover other features of Voyant Tools as well as other text mining applications.
The use of Voyant Tools represents an additional way of analyzing text(s). By counting and tabulating words, it provides a quick and easy quantitative method for learning what is in a text and what it might have to offer. The use of Voyant Tools does not offer “truth” per se, only new ways at observation.
[1] Walden – http://infomotions.com/etexts/philosophy/1800-1899/thoreau-walden-186.txt
[2] Civil Disobedience – http://infomotions.com/etexts/philosophy/1800-1899/thoreau-life-183.txt
[3] Merrimack River – http://infomotions.com/etexts/gutenberg/dirs/etext03/7cncd10.txt
This is an unfinished and barely refined list of linked data tools — a “webliography” — from the forthcoming LiAM Guidebook. It is presented here simple to give an indication of what appears in the text. These citations are also available as RDF, just for fun.
This is an unfinished and barely refined list of linked data sites — a “webliography” — from the forthcoming LiAM Guidebook. It is presented here simple to give an indication of what appears in the text. These citations are also available as RDF, just for fun.
This is an unfinished and barely refined list of citations — a “webliography” — from the forthcoming LiAM Guidebook. It is presented here simple to give an indication of what appears in the text. These citations are also available as RDF, just for fun.
Publishing linked data through XML transformation is functional but not optimal. Publishing linked data from a database comes closer to the ideal but requires a greater amount of technical computer infrastructure and expertise.
Databases — specifically, relational databases — are the current best practice for organizing data. As you may or may not know, relational databases are made up of many tables of data joined with keys. For example, a book may be assigned a unique identifier. The book has many characteristics such as a title, number of pages, size, descriptive note, etc. Some of the characteristics are shared by other books, like authors and subjects. In a relational database these shared characteristics would be saved in additional tables, and they would be joined to a specific book through the use of unique identifiers (keys). Given this sort of data structure, reports can be created from the database describing its content. Similarly, queries can be applied against the database to uncover relationships that may not be apparent at first glance or buried in reports. The power of relational databases lay in the use of keys to make relationships between rows in one table and rows in other tables.

relational databases and lilnked data
Not coincidently, this is very much the way linked data is expected to be implemented. In the linked data world, the subjects of triples are URIs (think database keys). Each URI is associated with one or more predicates (think the characteristics in the book example). Each triple then has an object, and these objects take the form of literals or other URIs. In the book example, the object could be “Adventures Of Huckleberry Finn” or a URI pointing to Mark Twain. The reports of relational databases are analogous to RDF serializations, and SQL (the relational database query language) is analogous to SPARQL, the query language of RDF triple stores. Because of the close similarity between well-designed relational databases and linked data principles, the publishing of linked data directly from relational databases makes whole lot of sense, but the process requires the combined time and skills of a number of different people: content specialists, database designers, and computer programmers. Consequently, the process of publishing linked data from relational databases may be optimal, but it is more expensive.
Thankfully, most archivists probably use some sort of database to manage their collections and create their finding aids. Moreover, archivists probably use one of three or four tools for this purpose: Archivist’s Toolkit, Archon, ArchivesSpace, or PastPerfect. Each of these systems have a relational database at their heart. Reports could be written against the underlying databases to generate serialized RDF and thus begin the process of publishing linked data. Doing this from scratch would be difficult, as well as inefficient because many people would be starting out with the same database structure but creating a multitude of varying outputs. Consequently, there are two alternatives. The first is to use a generic database application to RDF publishing platform called D2RQ. The second is for the community to join together and create a holistic RDF publishing system based on the database(s) used in archives.
D2RQ is a wonderful software system. It is supported, well-documented, executable on just about any computing platform, open source, focused, functional, and at the same time does not try to be all things to all people. Using D2RQ it is more than possible to quickly and easily publish a well-designed relational database as RDF. The process is relatively simple:
For a limited period of time I have implemented D2RQ against my water collection (original HTML or linked data). Of particular interest is the list of classes (ontologies) and properties (terms) generated from the database by D2RQ. Here is a URI pointing to a particular item in the collection — Atlantic Ocean at Roch in Wales (original HTML or linked data).
The downside of D2RQ is its generic nature. It will create an RDF ontology whose terms correspond to the names of database fields. These field names do not map to widely accepted ontologies and therefore will not interact well with communities outside the ones using a specific database structure. Still, the use of D2RQ is quick, easy, and accurate.
The second alternative to using databases of archival content to published linked data requires community effort and coordination. The databases of Archivist’s Toolkit, Archon, ArchivesSpace, or PastPerfect could be assumed. The community could then get together and create and decide on an RDF ontology to use for archival descriptions. The database structure(s) could then be mapped to this ontology. Next, programs could be written against the database(s) to create serialized RDF thus beginning the process of publishing linked data. Once that was complete, the archival community would need to come together again to ensure it uses as many shared URIs as possible thus creating the most functional sets of linked data. This second alternative requires a significant amount of community involvement and wide-spread education. It represents a never-ending process.
2014-01-06T20:14:41+00:00 LiAM: Linked Archival Metadata: Publishing linked data by way of EAD files http://sites.tufts.edu/liam/2014/01/05/linked-data-via-ead/[This blog posting comes from a draft of the Linked Archival Metadata: A Guidebook --ELM ]
If you have used EAD to describe your collections, then you can easily make your descriptions available as valid linked data, but the result will be less than optimal. This is true not for a lack of technology but rather from the inherent purpose and structure of EAD files.
A few years ago an organisation in the United Kingdom called the Archive’s Hub was funded by a granting agency called JISC to explore the publishing of archival descriptions as linked data. One of the outcomes of this effort was the creation of an XSL stylesheet transforming EAD into RDF/XML. The terms used in the stylesheet originate from quite a number of standardized, widely accepted ontologies, and with only the tiniest bit configuration / customization the stylesheet can transform a generic EAD file into valid RDF/XML. The resulting XML files can then be made available on a Web server or incorporated into a triple store. This goes a long way to publishing archival descriptions as linked data. The only additional things needed are a transformation of EAD into HTML and the configuration of a Web server to do content-negotiation between the XML and HTML.
For the smaller archive with only a few hundred EAD files whose content does not change very quickly, this is a simple, feasible, and practical solution to publishing archival descriptions as linked data. With the exception of doing some content-negotiation, this solution does not require any computer technology that is not already being used in archives, and it only requires a few small tweaks to a given workflow:
On the other hand an EAD file is the combination of a narrative description with a hierarchal inventory list, and this data structure does not lend itself very well to the triples of linked data. For example, EAD headers are full of controlled vocabularies terms but there is no way to link these terms with specific inventory items. This is because the vocabulary terms are expected to describe the collection as a whole, not individual things. This problem could be overcome if each individual component of the EAD were associated with controlled vocabulary terms, but this would significantly increase the amount of work needed to create the EAD files in the first place.
The common practice of using literals (“strings”) to denote the names of people, places, and things in EAD files would also need to be changed in order to fully realize the vision of linked data. Specifically, it would be necessary for archivists to supplement their EAD files with commonly used URIs denoting subject headings and named authorities. These URIs could be inserted into id attributes throughout an EAD file, and the resulting RDF would be more linkable, but the labor to do so would increase, especially since many of the named authorities will not exist in standardized authority lists.
Despite these short comings, transforming EAD files into some sort of serialized RDF goes a long way towards publishing archival descriptions as linked data. This particular process is a good beginning and outputs valid information, just information that is not as accurate as possible. This process lends itself to iterative improvements, and outputting something is better than outputting nothing. But this particular process is not for everybody. The archive whose content changes quickly, the archive with copious numbers of collections, or the archive wishing to publish the most accurate linked data possible will probably not want to use EAD files as the root of their publishing system. Instead some sort of database application is probably the best solution.
2014-01-05T23:08:35+00:00 Life of a Librarian: Semantic Web in Libraries 2013 http://sites.nd.edu/emorgan/2013/12/swib13/I attended the Semantic Web in Libraries 2013 conference in Hamburg (November 25-27), and this posting documents some of my experiences. In short, I definitely believe the linked data community in libraries is maturing, but I still wonder whether or not barrier for participation is really low enough for the vision of the Semantic Web to become a reality.
On the first day I attended a preconference about linked data and provenance led by Kai Eckert (University of Mannheim) and Magnus Pfeffer (Stuttgarat Media University). One of the fundamental ideas behind the Semantic Web and linked data is the collecting of triples denoting facts. These triples are expected to be amassed and then inferenced across in order to bring new knowledge to light. But in the scholarly world it is important cite and attribute scholarly output. Triples are atomistic pieces of information: subjects, predicates, objects. But there is no room in these simple assertions to denote where the information originated. This issue was the topic of the preconference discussion. Various options were outlined but none of them seemed optimal. I’m not sure of the conclusion, but one “solution” may be the use of PROV, “a model, corresponding serializations and other supporting definitions to enable the inter-operable interchange of provenance information in heterogeneous environments such as the Web”.
Both Day #1 and Day #2 were peppered with applications which harvested linked data (and other content) to create new and different views of information. AgriVIVO, presented by John Fereira (Cornell University) was a good example:
AgriVIVO is a search portal built to facilitate connections between all actors in the agricultural field, bridging across separately hosted directories and online communities… AgriVIVO is based on the VIVO open source semantic web application initially developed at Cornell University and now adopted by several cross-institutional research discovery projects.
Richard Wallis (OCLC) advocated the creation of library knowledge maps similar to the increasingly visible “knowledge graphs” created by Google and displayed at the top of search results. These “graphs” are aggregations of images, summaries, maps, and other bit of information providing the reader with answers / summaries describing what may be the topic of search. They are the same sort of thing one sees when searches are done in Facebook as well. And in the true spirit of linked data principles, Wallis advocated the additional use of additional peoples’ Semantic Web ontologies such as the ontology used by Schema.org. If you want to participate and help extend the bibliographic entities of Schema.org, then consider participating in a W3C Community called Schema Bib Extend Community Group.
BIBFRAME was described by Julia Hauser (Reinhold Heuvelmann German National Library). Touted as as a linked data replacement for MARC, its data model consists of works, instances, authorities, and annotations (everything else). According to Hauser, “The big unknown is how can RDA or FRBR be expressed using BIBFRAME.” Personally, I noticed how BIBFRAME contains no holdings information, but such an issue may be resolvable through the use of schema.org.
“Language effects hierarchies and culture comes before language” were the concluding remarks in a presentation by the National Library of Finland. Leaders in the linked data world, the presenters described how they were trying to create a Finnish ontology, and they demonstrated how language does not fit into neat and orderly hierarchies and relationships. Things always get lost in translation. For example, one culture may have a single word for a particular concept, but another culture may have multiple words because the concept has more nuances in its experience. Somewhere along the line the presenters alluded to onki-light, “a REST-style API for machine and Linked Data access to the underlying vocabulary data.” I believe the presenters were using this tool to support access to their newly formed ontology.
Yet another ontology was described by Carsten Klee (Berlin State Library) and Jakob Voẞ (GBV Common Library Network). This was a holdings ontology which seemed unnecessarily complex to me, but then I’m no real expert. See the holding-ontology repository on Github.
I found the presentation — “Decentralization, distribution, disintegration: Towards linked data as a first class citizen in Library Land” — by Martin Malmsten (National Library of Sweden) to be the most inspiring. In the presentation he described why he thinks linked data is the way to describe the content of library catalogs. He also made insightful distinctions between file formats and the essencial characteristics of data, information, knowledge, (and maybe wisdom). Like many at the conference, he advocated interfaces to linked data, not MARC:
Working with RDF has enabled me to see beyond simple formats and observe the bigger picture — “Linked data or die”. Linked data is the way to do it now. I advocate the abstraction of MARC to RDF because RDF is more essencial and fundmental… Mixing data is new problem with the advent of linked data. This represents a huge shift in our thinking of Library Land. It is transformative… Keep the formats (monsters and zombies) outside your house. Formats are for exchange. True and real RDF is not a format.
Some of the work demonstrating the expressed ideas of the presentation is available on Github in a package called librisxl.
Another common theme / application demonstrated at the conference were variations of the venerable library catalog. OpenCat, presented by Agnes Simon (Bibliothéque Nationale de France), was an additional example of this trend. Combining authority data (available as RDF) provided by the National Library of France with works of a second library (Fresnes Public Library), the OpenCat prototype provides quite an interesting interface to library holdings.
Peter Király (Europeana Foundation) described how he is collecting content over many protocols and amalgamating it into the data store of Europenana. I appreciated the efforts he has made to normalize and enrich the data — not an easy task. The presentation also made me think about provenance. While provenance is important, maybe trust of provenance can come from the aggregator. I thought, “If these aggregators believe — trust — the remote sources, then may be I can too.” Finally, the presentation got me imagining how one URI can lead to others, and my goal would be to distill it down again into a single URI all of the interesting information I found a long the way, as in the following image I doodled during the presentation.
Enhancing the access and functionality of manuscripts was the topic of the presentation by Kai Eckert (Universität Mannheim). Specifically, manuscripts are digitized and an interface is placed on top allowing scholars to annotate the content beneath. I think the application supporting this functionality is called Pundit. Along the way he takes heterogeneous (linked) data and homogenizes it with a tool called DM2E.
OAI-PMH was frequently alluded to during the conference, and I have some ideas about that. In “Application of LOD to enrich the collection of digitized medieval manuscripts at the University of Valencia” Jose Manuel Barrueco Cruz (University of Valencia) described how the age of his content inhibited his use of the currently available linked data. I got the feeling there was little linked data closely associated with the subject matter of his manuscripts. Still, an an important thing to note, is how he started his investigations with the use of Datahub:
a data management platform from the Open Knowledge Foundation, based on the CKAN data management system… [providing] free access to many of CKAN’s core features, letting you search for data, register published datasets, create and manage groups of datasets, and get updates from datasets and groups you’re interested in. You can use the web interface or, if you are a programmer needing to connect the Datahub with another app, the CKAN API.
Simeon Warner (Cornell University) described how archives or dumps of RDF triple stores are synchronized across the Internet via HTTP GET, gzip, and a REST-ful interface on top of Google sitemaps. I was impressed because the end result did not necessarily invent something new but rather implemented an elegant solution to a real-world problem using existing technology. See the resync repository on Github.
In “From strings to things: A linked data API for library hackers and Web developers” Fabian Steeg and Pascal Christoph (HBZ) described an interface allowing librarians to determine the URIs of people, places, and things for library catalog records. “How can we benefit from linked data without being linked data experts? We want to pub Web developers into focus using JSON for HTTP.” There are few hacks illustrating some of their work on Github in the lobid repository.
Finally, I hung around for a single lightning talk — Carsten Klee’s (Berlin State Library) presentation of easyM2R, a PHP script converting MARC to any number of RDF serializations.
I am currently in the process of writing a short book on the topic of linked data and archives for an organization called LiAM — “a planning grant project whose deliverables will facilitate the application of linked data approaches to archival description.” One of my goals for attending this conference was to determine my level of understanding when it comes to linked data. At the risk of sounding arrogant, I think I’m on target, but at the same time, I learned a lot at this conference.
For example, I learned that the process of publishing linked data is not “rocket surgery” and what I have done to date is more than functional, but I also learned that creating serialized RDF from MARC or EAD is probably not the best way to create RDF. I learned that publishing linked data is only one half of the problem to be solved. The other half is figuring out ways to collect, organize, and make useful the published content. Fortunately this second half of the problem was much of what the conference was about. Many people are using linked data to either create or enhance “next-generation library catalogs”. In this vein they are not really doing anything new and different; they are being evolutionary. Moreover, many of the developers are aggregating content using quite a variety of techniques, OAI-PMH being one of the more frequent.
When it comes to OAI-PMH and linked data, I see very much the same vision. Expose metadata in an agreed upon format and in an agreed upon method. Allow others to systematically harvest the metadata. Provide information services against the result. OAI-PMH was described as protocol with a low barrier to entry. The publishing of linked data is also seen as low barrier technology. The challenges of both first lie the vocabularies used to describe the things of the metadata. OAI-PMH required Dublin Core but advocated additional “ontologies”. Few people implemented them. Linked data is not much different. The problem with the language of the things is just as prevalent, if not more so. Linked data is not just the purview of Library Land and a few computer scientists. Linked data has caught the attention of a much wider group of people, albiet the subject is still a bit esoteric. I know the technology supporting linked data functions. After all, it is the technology of the Web. I just wonder if: 1) there will ever be a critical mass of linked data available in order to fulfill its promise, and 2) will we — the information community — be able to overcome the “Tower of Babel” we are creating with all the the various ontologies we are sporting. A single ontology won’t work. Just look at Dublin Core. Many ontologies won’t work either. There is too much variation and too many idiosyncrasies in real-world human language. I don’t know what the answer is. I just don’t.
Despite some of my misgivings, I think the following quote by Martin Malmsten pretty much sums up much of the conference — Linked data or die!
2013-12-30T09:48:05+00:00 Mini-musings: LiAM SPARQL Endpoint http://infomotions.com/blog/2013/12/sparql-endpoint/I have implemented a brain-dead and half-baked SPARQL endpoint to a subset of LiAM linked data, but there is the disclaimer. Errors will probably happen because of SPARQL syntax errors. Your milage will vary.
Here are a few sample queries:
PREFIX rdf:<http://www.w3.org/2000/01/rdf-schema#> SELECT * WHERE { ?s rdf:label ?o }PREFIX mods:<http://simile.mit.edu/2006/01/ontologies/mods3#> SELECT * WHERE { ?s mods:subject ?o }SELECT ?p WHERE { ?s ?p ?o }SELECT * WHERE { ?s ?p ?o }Source code — sparql.pl — is online.
2013-12-15T16:30:11+00:00 LiAM: Linked Archival Metadata: Initial pile of RDF http://sites.tufts.edu/liam/2013/12/09/initial-rdf/I have created an initial pile of RDF, mostly.
I am in the process of experimenting with linked data for archives. My goal is to use existing (EAD and MARC) metadata to create RDF/XML, and then to expose this RDF/XML using linked data principles. Once I get that far I hope to slurp up the RDF/XML into a triple store, analyse the data, and learn how the whole process could be improved.
This is what I have done to date:
You can see the fruits of these labors at http://infomotions.com/sandbox/liam/, and there you will find a few directories:
My Perl scripts read the metadata, create HTML and RDF/XML, and save the result in the pages and data directories, respectively. A person can browse these directories, but browsing will be difficult because there is nothing there except cryptic file names. Selecting any of the files should return valid HTML or RDF/XML.
Each cryptic name is the leaf of a URI prefixed with “http://infomotions.com/sandbox/liam/id/”. For example, if the leaf is “mshm510″, then the combined leaf and prefix form a resolvable URI — http://infomotions.com/sandbox/liam/id/mshm510. When user-agent says it can accept text/html, then the HTTP server redirects the user-agent to http://infomotions.com/sandbox/liam/pages/mshm510.html. If the user agent does not request a text/html representation, then the RDF/XML version is returned — http://infomotions.com/sandbox/liam/data/mshm510.rdf. This is rudimentary content-negotiation. For a good time, here are a few actionable URIs:
For a good time, feed them to the W3C RDF Validator.
The next step is to figure out how to handle file not found errors when a URI does not exist. Another thing to figure out is how to make potential robots aware of the data set. The bigger problem is to simply make the dataset more meaningful the the inclusion of more URIs in the RDF/XML as well as the use of a more consistent and standardized set of ontologies.
Fun with linked data?
2013-12-10T03:14:07+00:00 LiAM: Linked Archival Metadata: Illustrating RDF http://sites.tufts.edu/liam/2013/12/06/illustrating-rdf/I have had some success converting EAD and MARC into RDF/XML, and consequently I am able to literally illustrate the resulting RDF triples.
I have acquired sets of EAD files and MARC records of an archival nature. When it comes to EAD files I am able to convert them into RDF/XML with a stylesheet from the Archives Hub. I then fed the resulting RDF/XML to the W3C RDF Validation Service and literally got an illustration of the RDF, below:

hou00096.xml –> hou00096.rdf –> illustration
Transforming MARC into RDF was a bit more complicated. I first convert a raw MARC record into MARCXML with a Perl module called MARC::File::XML. I transformed the result into MODS with MARC21slim2MODS3.xsl, and finally into RDF/XML with mods2rdf.xslt. Again, I validated the results to got the following illustration:

003078076.marc –> 003078076.xml –> 003078076.mods –> 003078076.rdf –> illustration
The resulting images are huge, and the astute/diligent reader will see a preponderance of literals in the results. This is not a good thing, but it all that is available right now.
On the other hand the same astute/diligent reader will see the root of the RDF/XML pointing to a meaningful URI. This URI will be resolvable in the near future via content negotiation. This is a simple first step. The next steps will be to apply this process to an entire collection of EAD files and MARC records. After that the two other things can happen: 1) the original metadata files can begin to include URIs, and 2) the XSL used to process the metadata can employ a more standardized ontology. It is not an easy process, but it is a beginning.
Right now, something is better than nothing.
2013-12-06T21:03:15+00:00 LiAM: Linked Archival Metadata: Transforming MARC to RDF http://sites.tufts.edu/liam/2013/12/04/marc-to-rdf/I hope somebody can give me some advice for transforming MARC to RDF.
I am in the midst of writing a book describing the benefits of linked data for archives. Archival metadata usually comes in two flavors: EAD and MARC. I found a nifty XSL stylesheet from the Archives Hub (that’s in the United Kingdom) transforming EAD to RDF/XML. With a bit of customization I think it could be used quite well for just about anybody with EAD files. I have retained a resulting RDF/XML file online.
Converting MARC to RDF has been more problematic. There are various tools enabling me to convert my original MARC into MARCXML and/or MODS. After that I can reportably use a few tools to convert to RDF:
In short, I have discovered nothing that is “easy-to-use”. Can you provide me with any other links allowing me to convert MARC to serialized RDF?
2013-12-05T03:19:27+00:00 DH @ Notre Dame: Tiny list of part-of-speech taggers http://dh.crc.nd.edu/blog/2013/11/pos/This is a tiny list of part-of-speech (POS) taggers, where taggers are tools used to denote what words in a sentence are nouns, verbs, adjectives, etc. Once parts-of-speech are denoted, a reader can begin to analyze a text on a dimension beyond the simple tabulating of words. The list is posted here for my own edification, and just in case it can be useful to someone else and in the future:
Participating in the Semantic Web and providing content via the principles of linked data is not “rocket surgery”, especially for cultural heritage institutions — libraries, archives, and museums. Here is a simple recipe for their participation:
I am in the process of writing a guidebook on the topic of linked data and archives. In the guidebook I will elaborate on this recipe and provide instructions for its implementation.
2013-11-19T12:55:36+00:00 LiAM: Linked Archival Metadata: OAI2LOD http://sites.tufts.edu/liam/2013/11/14/oai2lod/The other day I discovered a slightly dated application called OAI2LOD, and I think it works quite nicely. It’s purpose? To expose OAI data repositories as linked open data. Installation was all but painless. Download source for GitHub. Build with ant. Done. Getting it up and running was just as easy. Select sample configuration file. Edit some values so OAI2LOD knows about your (or maybe somebody else’s) OAI repository. Run OAI2LOD. The result is an HTTP interface to the OAI data repository in the form of linked data. A reader can browse by items or by sets. OAI2LOD supports “content negotiation” so it will return RDF when requested. It also supports a SPARQL endpoint. The only flaw I found with the tool is its inability to serve more than one data repository at a time. For a limited period of time, I’ve made one of my OAI repositories available for perusing. Enjoy.
2013-11-15T03:03:05+00:00 LiAM: Linked Archival Metadata: RDF triple stores http://sites.tufts.edu/liam/2013/11/14/rdf-triple-stores/Less than a week ago I spent a lot of time trying to install and configure a few RDF triple stores, with varying degrees of success:
What’s the point? Well, quite frankly, I’m not sure yet. All of these “stores” are really databases of RDF triples. Once they are in the store a person can submit queries to find triples. The query language used is SPARQL, and SPARQL sort of feels like Yet Another Kewl Hack. What is the problem trying to be solved here? The only truly forward thinking answer I can figure out is the implementation of an inference engine used to find relationships that weren’t obvious previously. Granted, my work has just begun and I’m more ignorant than anything else.
Please enlighten me?
2013-11-15T02:41:19+00:00 Life of a Librarian: Fun with bibliographic indexes, bibliographic data management software, and Z39.50 http://sites.nd.edu/emorgan/2013/11/fun/It is not suppose to be this hard.
A student came into the Center For Digital Scholarship here at Notre Dame. They wanted to do some text analysis against a mass of bibliographic citations from the New York Times dating from 1934 to the present. His corpus consists of more than 1.6 million records. The student said, “I believe the use of words like ‘trade’ and ‘tariff’ have changed over time, and these changes reflect shifts in our economic development policies.” Sounds interesting to me, really.
To do this analysis I needed to download the 1.6 million records in question. No, I wasn’t going to download them in one whole batch but rather break them up into years. Still this results in individual data sets totaling thousands and thousands of records. Selecting these records through the Web interface of the bibliographic vendor was tedious. No, it was cruel and unusual punishment. There had to be a better way. Moreover, the vendor said, “Four thousand (4,000) records is the most a person can download at any particular time.”
After a bit of back & forth a commercial Z39.50 client seemed to be the answer. At the very least there won’t be a whole lot of clicking going on. I obtained a username/password combination. I figured out the correct host name of the remote Z39.50 server. I got the correct database name. I configured my client. Searches worked perfectly. But upon closer inspection, no date information was being parsed from the records. No pagination. The bibliographic citation management software could not create… bibliographic citations. “Is date information being sent? What about pagination and URLs?” More back & forth and I learned that the bibliographic vendor’s Z39.50 server outputs MARC, and the required data is encoded in the MARC. I went back to tweaking my client’s configuration. Everything was now working, but downloading the citations was very slow — too slow.
So I got to more thinking. “I have all the information I need to use a low-level Z39.50 client.” Yaz-client might be an option, but in the end I wrote my own Perl script. In about twenty-five lines of code I wrote what I needed, and downloads were a factor of 10 faster than the desktop client. (See the Appendix.) The only drawback was the raw MARC that I was saving. I would need to parse it for my student.
Everything was going well, but then I hit the original limit — the record limit. When the bibliographic database vendor said there was a 4,000 record limit, I thought that meant no more than 4,000 records could be downloaded at one time. No, it means that from any given search I can only download the first 4,000 records. Trying to retrieve record 4,001 or greater results in an error. This is true. When I request record 4001 from my commercial client or Perl-based client I get an error. Bummer!
The only thing I can do now is ask the bibliographic vendor for a data dump.
On one hand I can’t blame the bibliographic vendor too much. For decades the library profession has been trying to teach people to do the most specific, highly accurate, precision/recall searches possible. “Why would anybody want more than a few dozen citations anyway? Four thousand ought to be plenty.” One the other hand, text mining is a legitimate and additional method for dealing with information overload. Four thousand records is just a tip of an iceberg.
I learned a few things:
I also got an idea — provide my clientele with a “smart” database search interface. Here’s how:
Wish me luck!?
#!/usr/bin/perl

# nytimes-search.pl - rudimentary z39.50 client to query the NY Times

# Eric Lease Morgan <emorgan@nd.edu>
# November 13, 2013 - first cut; "Happy Birthday, Steve!"

# usage: ./nytimes-search.pl > nytimes.marc


# configure
use constant DB     => 'hnpnewyorktimes';
use constant HOST   => 'fedsearch.proquest.com';
use constant PORT   => 210;
use constant QUERY  => '@attr 1=1016 "trade or tariff"';
use constant SYNTAX => 'usmarc';

# require
use strict;
use ZOOM;

# do the work
eval {

	# connect; configure; search
	my $conn = new ZOOM::Connection( HOST, PORT, databaseName => DB );
	$conn->option( preferredRecordSyntax => SYNTAX );
	my $rs = $conn->search_pqf( QUERY );

	# requests > 4000 return errors
	# print $rs->record( 4001 )->raw;

	# retrieve; will break at record 4,000 because of vendor limitations
	for my $i ( 0 .. $rs->size ) {

		print STDERR "\tRetrieving record #$i\r";
		print $rs->record( $i )->raw;

	}

};

# report errors
if ( $@ ) { print STDERR "Error ", $@->code, ": ", $@->message, "\n" }

# done
exit;This posting describes a quick & dirty way to begin doing website content analysis.
A student here at Notre Dame wants to do computer and text mining analyze a set of websites. After a bit of discussion and investigation, I came up with the following recipe:
This is just a beginning, but it is something one can do on their own and without special programming. Besides, it is elegant.
[1] mirror – wget -r -i urls.txt
[2] convert – find . -name "*.html" -exec textutil -convert txt {} \;
[3] concatenate – find . -name "*.txt" -exec cat {} >> site-01.log \;
[4] tool #1 (Voyant Tools) – http://voyant-tools.org
[5] set of tools – http://taporware.ualberta.ca/~taporware/textTools/
I have played with an XSL stylesheet called EAD2RDF with good success.
Archivists use EAD as their “MARC” records. EAD has its strengths and weakness, just like any metadata standard, but EAD is a flavor of XML. As such it lends itself to XSLT processing. EAD2RDF is a stylesheet written by Pete Johnston. After running it through an XSLT 2.0 processor, it outputs an RDF/XML file. (I have made a resulting RDF/XML file available for you to peruse.) The result validates against the W3C RDF Validator but won’t have a graph created, probably because there are so many triples in the result.
I think archivists as well as computer technologists working in archives ought to take a closer look at EAD2RDF.
2013-11-11T01:30:33+00:00 Mini-musings: OAI2LOD Server http://infomotions.com/blog/2013/11/oai2lod-server/At first glance, a software package called OAI2LOD Server seems to work pretty well, and on a temporary basis, I have made one of my OAI repositories available as Linked Data — http://infomotions.com:2020/
OAI2LOD Server is a software package, written by Bernhard Haslhofer in 2008. Building, configuring, and running the server was all but painless. I think this has a great deal of potential, and I wonder why it has not been more widely exploited. For more information about the server, see “The OAI2LOD Server: Exposing OAI-PMH Metadata as Linked Data“
2013-11-10T17:39:39+00:00 Life of a Librarian: Network Detroit and Great Lakes THATCamp http://sites.nd.edu/emorgan/2013/10/network-detroit/This time last week I was in Detroit (Michigan) where I attended Network Detroit and the Great Lakes THATCamp. This is the briefest of postings describing my experiences.


Network Detroit brought together experienced and fledgling digital humanists from around the region. There were presentations by local libraries, archives, and museums. There were also presentations by scholars and researchers. People were creating websites, doing bits of text mining, and trying to figure out how to improve upon the scholarly communications process. A few useful quotes included:
Day #2 consisted of participation in the Great Lakes THATCamp. I spend the time doing three things. First, I spent time thinking about a program I’m writing called PDF2TXT or maybe “Distant Reader”. The original purpose of the program is/was to simply extract the text from a PDF document. Since then it has succumbed to creeping featuritis to include the reporting of things like: readability scores, rudimentary word clouds of uni- and bi-grams, an extraction of the most frequent verb lemmings and the listing of sentences where they are found, a concordance, and the beginnings of network diagram illustrating what words are used “in the same breath” as other words. The purpose of the program is two-fold: to allow the reader to get more out of their text(s), and 2) to advertise some of the services of the Libraries’s fledgling Center For Digital Scholarship. I presented a “geek short” on the application.
The second and third ways I spent my time were in group sessions. One was on the intersection of digital humanities and the scholarly communications process. The second was on getting digital humanities projects off the ground. In both cases folks discussed ways to promote library services, and it felt as if we were all looking for new ways to be relevant compared to fifty years ago when the great libraries were defined by the sizes of their collections.
I’m glad I attended the meetings. The venue — Lawrence Technical University — is a small but growing institution. Detroit is a city of big road and big cars. The Detroit Art Institute was well-worth the $8 admission fee, even if you do get a $30 parking ticket.
2013-10-05T01:42:40+00:00 Life of a Librarian: Data Information Literacy @ Purdue http://sites.nd.edu/emorgan/2013/10/dil/By this time last week I had come and gone to the Data Information Literacy (DIL) Symposium at Purdue University. It was a very well-organized event, and I learned a number of things.


First of all, I believe the twelve DIL Competencies were well-founded and articulated:
For more detail of what these competencies mean and how they were originally articulated, see: Carlson, Jake R.; Fosmire, Michael; Miller, Chris; and Sapp Nelson, Megan, “Determining Data Information Literacy Needs: A Study of Students and Research Faculty” (2011). Libraries Faculty and Staff Scholarship and Research. Paper 23. http://docs.lib.purdue.edu/lib_fsdocs/23
I also learned about Bloom’s Taxonomy, a classification of learning objectives. At the bottom of this hierarchy/classification is remembering. The next level up is understanding. The third level is application. At the top of the hierarchy/classification is analysis, evaluation, and creation. According to the model, a person needs to move from remembering through to analysis, evaluation, and creation in order to really say they have learned something.
Some of my additional take-aways included: spend time teaching graduate students about data information literacy, and it is almost necessary to be imbedded or directly involved in the data collection process in order to have a real effect — get into the lab.
About 100 people attended the event. It was two days long. Time was not wasted. There were plenty of opportunities for discussion & interaction. Hat’s off to Purdue. From my point of view, y’all did a good job. “Thank you.”
2013-10-04T01:30:43+00:00 Life of a Librarian: 3-D printing in the Center For Digital Scholarship http://sites.nd.edu/emorgan/2013/10/3d-printing/
“my” library
The Libraries purchased a 3-D printer — a MakerBot Replicator 2X — and it arrived here in the Center For Digital Scholarship late last week. It can print things to sizes just smaller than a bread box — not very big. To make it go one feeds it a special file which moves — drives — a horizontal platform as well as a movable nozzle dispensing melted plastic. The “special file” is something only MakerBot understands, I think. But the process is more generalized than that. Ideally one would:
Alternatively, a person can:
Another choice is to:
Yet another choice is to:
The other day I downloaded a modeling program — 3-D Sculpt — for my iPad. Import a generic model. Use the tools to modify it. Save. Convert. Print.
To date I’ve only printed a bust of Michelangelo’s David and a model of a “library”. I’ve tried to print other sculptures but with little success.
How can this be used in a library, or more specifically, in our Center For Digital Scholarship? Frankly, I don’t know, yet, but I will think of something. For example, maybe I could print 3-D statistics. Or I could create a 3-D model representing the use of words in a book. Hmmm… Do you have any ideas?
2013-10-03T00:43:27+00:00 LiAM: Linked Archival Metadata: Initialized a list of tools in the LiAM Guidebook, plus other stuff http://sites.tufts.edu/liam/2013/09/21/tools/Added lists of tools to LiAM Guidebook. [0, 1] Add a Filemaker file to the repository. The file keeps track of my tools. Added tab2text.pl which formats the output of my Filemaker data into plain text. Added a very rudimentary PDF document — a version of the Guidebook designed for human consumption. For a good time, added an RDF output of my Zotero database.
“Librarians love lists.”
[0] About the LiAM Guidebook – http://sites.tufts.edu/liam/
[1] Git repository of Guidebook – https://github.com/liamproject
The Github staging location for the Linked Archival Metadata (LiAM) Guidebook has been moved to liamproject — https://github.com/liamproject/.
We now return you to your regular scheduled programming.
2013-09-15T20:51:27+00:00 Life of a Librarian: HathiTrust Research Center Perl Library http://sites.nd.edu/emorgan/2013/09/htrc-lib/
 This is the README file for a tiny library of Perl subroutines to be used against the HathiTrust Research Center (HTRC) application programmer interfaces (API). The Github distribution ought to contain a number of files, each briefly described below:
The file doing the heavy lifting is htrc-lib.pl. It contains only three subroutines:
The library is configured at the beginning of the file with three constants:
The other .pl files in this distribution are the simplest of scripts demonstrating how to use the library.
Be forewarned. The library does very little error checking, nor is there any more documentation beyond what you are reading here.
Before you will be able to use the obtainOAuth2Token and retrieve subroutines, you will need to acquire a client identifier and secret from the HTRC. These are required in order for the Center to track who is using their services.
The home page for the HTRC is http://www.hathitrust.org/htrc. From there you ought to be able to read more information about the Center and their supported APIs.
This software is distributed under the GNU Public License.
Finally, here is a suggestion of how to use this library:
I’m tired. That is enough for now. Enjoy.
2013-09-12T20:35:55+00:00 LiAM: Linked Archival Metadata: What is Linked Data and why should I care? http://sites.tufts.edu/liam/2013/09/03/what-is-ld/
 Eye candy by Eric |
Linked Data is a process for manifesting the ideas behind the Semantic Web. The Semantic Web is about encoding data, information, and knowledge in computer-readable fashions, making these encodings accessible on the World Wide Web, allowing computers to crawl the encodings, and finally, employing reasoning engines against them for the purpose of discovering and creating new knowledge. The canonical article describing this concept was written by Tim Berners-Lee, James Hendler, and Ora Lassila in 2001.
In 2006 Berners-Lee more concretely described how to make the Semantic Web a reality in a text called “Linked Data — Design Issues“. In it he outlined four often-quoted expectations for implementing the Semantic Web. Each of these expectations are listed below along with some elaborations:
In the same text (“Linked Data — Design Issues”) Berners-Lee also outlined a sort of reward system — sets of stars — for levels of implementation. Unfortunately, nobody seems to have taken up the stars very seriously. A person gets:
The whole idea works like this. Suppose I assert the following statement:
The Declaration Of Independence was authored by Thomas Jefferson.
This statement can be divided into three parts. The first part is a subject (Declaration Of Independence). The second part is a predicate (was authored by). The third part is an object (Thomas Jefferson). In the language of the Semantic Web and Linked Data, these combined parts are called a triple, and they are expected to denote a fact. Triples are the heart of RDF.
Suppose further that the subject and object of the triple are identified using URIs (as in Expectations #1 and #2, above). This would turn our assertion into something like this with carriage returns added for readability:
http://www.archives.gov/exhibits/charters/declaration_transcript.html
was authored by
http://www.worldcat.org/identities/lccn-n79-89957
Unfortunately, this assertion is not easily read by a computer. Believe it or not, something like the XML below is much more amenable, and if it were the sort of content returned by a Web server to a user-agent, then it would satisfy Expectations #3 and #4 because the notation is standardized and because it points to other people’s content:
<rdf:RDF xmlns:rdf="http://www.w3.org/1999/02/22-rdf-syntax-ns#"
         xmlns:dc="http://purl.org/dc/elements/1.1/">
  <rdf:Description rdf:about="http://www.archives.gov/exhibits/charters/declaration_transcript.html">
    <dc:creator>http://www.worldcat.org/identities/lccn-n79-89957</dc:creator>
  </rdf:Description>
</rdf:RDF>
Suppose we had a second assertion:
Thomas Jefferson was a man.
In this case, the subject is “Thomas Jefferson”. The predicate is “was”. The object is “man”. This assertion can be expressed in a more computer-readable fashion like this:
<rdf:RDF xmlns:rdf="http://www.w3.org/1999/02/22-rdf-syntax-ns#"
         xmlns:foaf="http://xmlns.com/foaf/0.1/">
  <rdf:Description rdf:about="http://www.worldcat.org/identities/lccn-n79-89957">
    <foaf:gender>male</foaf:gender>
  </rdf:Description>
</rdf:RDF>
Looking at the two assertions, a reasonable person can deduce a third assertion, namely, the Declaration Of Independence was authored by a man. Which brings us back to the point of the Semantic Web and Linked Data. If everybody uses URIs (read “URLs”) to describe things, if everybody denotes relationships (through the use of predicates) between URIs, if everybody makes their data available on the Web in standardized formats, and if everybody uses similar URIs, then new knowledge can be deduced from the original relationships.
Unfortunately and to-date, too little Linked Data has been made available and/or too few people have earned too few stars to really make the Semantic Web a reality. The purpose of this guidebook is to provide means for archivists to do their part, make their content available on the Semantic Web through Linked Data, all in the hopes of facilitating the discovery of new knowledge. On our mark. Get set. Go!
 Eye candy by Eric |
Just less than a week ago I had a chat with Jane and Ade Stevenson on the topic of the linked open data and archival materials. This blog posting outlines some of my “take aways”. In short, I learned that implementing linked open data (LOD) against archival materials may not be straight-forward, but it does offer significant potential.
Jane Stevenson works for the Archives Hub, and Ade Stevenson works for Mimas. Both of them worked on a pair of projects surrounding LOD and archival materials. The first project was called LOCAH whose purpose was to expose archival metadata as LOD. The second project — Linking Lives — grew out of the first project, and its purpose was to provide an usable researcher interface to discover new knowledge based on LOD from archives. Both of these projects are right on target when it comes to the LiAM project.
We had an easily flowing Skype conversation, and below are some of the things I heard Jane and Ade say about an implementation process:
There are a number of challenges in the process. Some of them are listed below, and some of them have been alluded to above:
I asked about Google and its indexing abilities. Both Jane and Ade expressed appreciation for Google, but they also thought there was room for improvement. If there weren’t then things like schema.org would not have been manifested. I also asked what they thought success might look like in a project like LiAM’s and they said that maybe their XSL stylesheet could be made more applicable to wider sets of EAD files, and thus be taken to another level.
Thanks to go Jane and Ade. Their experience was truly beneficial. “Thank you!”
 Eye candy by Eric |
The 2012 Spring/Summer issue of Information Standards Quarterly includes a number of LODLAM articles, and of particular interest to me was the article authored by Jane Stevenson entitled “Linking Lives: Creating And End-User Interface Using Linked Data”. In short, Stevenson reported on a project called Linking Lives to make archival information about individuals available as linked open data.
As describes in a previous posting, there were a number of issues to address before the project could be called a perfect success. For example, after aggregating data created by a divergent set of people over a long period of time makes for inconsistent data — data of a great “variety” as Dorthea Salo would say. How to create a level of consistency is a problem to solve. This was even a greater problem as DBPedia data was pulled in the environment because some (Wikipedia) articles contain images, and some don’t. One of the biggest problems creating URIs for individuals because the individuals were not always listed in exactly the same manner from finding aid to finding aid, thus there are multiple identifiers for multiple people. Moreover, sometimes individuals are creators and sometimes individuals are index terms — persons versus agents. Because of all of these issues, a lot of data clean up is necessary before finding aids — even if they do come from EAD files — can be made accurately available as linked data.
 Eye candy by Eric |
With great interest I read the Spring/Summer issue of Information Standards Quarterly where there were a number of articles pertaining to linked open data in cultural heritage institutions. Of particular interest to me where the various loosely enumerated challenges of linked open data. Some of them included:
I’m not exactly sure how these things can be resolved. I’m still pondering.
 Eye candy by Eric |
This is the tiniest of blog postings introducing myself as a person who will be writing a text called Linked Archival Metadata: A Guidebook. The Guidebook will be the product of a LiAM, and from the prospectus, the purpose of the Guidebook is to:
provide archivists with an overview of the current linked data landscape, define basic concepts, identify practical strategies for adoption, and emphasize the tangible payoffs for archives implementing linked data. It will focus on clarifying why archives and archival users can benefit from linked data and will identify a graduated approach to applying linked data methods to archival description.
To these ends I plan to write towards three audiences: 1) the layman who knows nothing about linked data, 2) the archivist who wants to make their content available as linked data but does not know how, and 3) the computer technologist who knows how to make linked data accessible but does not know about archival practices.
Personally, I have been dabbling on and off with linked data and the Semantic Web for a number of years. I have also been deeply involved with a project called the Catholic Research Resources Alliance whose content mostly comes from archives. I hope to marry these two sets of experiences into something that will be useful to a cultural heritage institutions, especially archives.
The Guidebook is intended to manifested in both book (PDF) and wiki forms. The work begins now and is expected to be completed by March 2014. On my mark. Get set. Go. Wish me luck, and let’s see if we can build some community.
Last Friday (May 31, 2013) I attended an interesting symposium at Northwestern University called Driven By Shared Data. This blog posting describes my experiences.

Driven By Shared Data was an OCLC-sponsored event with the purpose of bringing together librarians to discuss “opportunities and operational challenges of turning data into powerful analysis and purposeful action”. At first I thought the symposium was going to be about the curation of “research data”, but I was pleasantly surprised otherwise. The symposium was organized into a number of sections / presentations, each enumerated below:
After the meeting I visited the Northwestern main library and experienced the round rooms where books are shelved. It was interesting to see the ranges radiating from each rooms’ center. Along the way I autographed my book and visited the university museum which had on display quite a number of architectural drawings.
Even though the symposium was not about “e-science research data”, I’m very glad I attended. Discussion was lively. The venue was intimate. I met a number of people, and my cognitive side was stimulated. Thank you for the opportunity.
2013-06-08T01:11:18+00:00 DH @ Notre Dame: Beth Plale, Yiming Sun, and the HathiTrust Research Center http://dh.crc.nd.edu/blog/2013/05/htrc/
Beth, Matt, & Yiming
Beth Plale and Yiming Sun, both from the HathiTrust Research Center, came to Notre Dame on Tuesday (May 7) to give the digital humanities group an update of some of the things happening at the Center. This posting documents some of my take-aways.
As you may or may not know, the HathiTrust Research Center is a part of the HathiTrust. And in the words of Plale, “the purpose of the Center is to develop the cyberinfrastructure of the Trust as well as to provide cutting edge software applied against the Trust’s content.” The later was of greatest interest to the presentation’s twenty or so participants.
The Trust is a collection of close to 11 million digitized books. Because close to 70% of these books are not in the public domain, any (digital humanities) computing must be “non-consumptive” in nature. What does this mean? It means the results of any computing process must not be able to reassemble the content of analysis back into a book’s original form. (It is interesting to compare & contrast the definition of non-consumptive research with the “non-expressive” research of Matt Sag. ) What types of research/analysis does this leave? According to Plale, there are a number of different things including but not necessarily limited to: classification, statistical analysis, network graphing, trend tracking, and maybe even information retrieval (search). Again, according to Plale, “We are looking to research that can be fed back into the system, perhaps to enhance the metadata, correct the OCR, remove duplicate items, date items according to when they were written, or possibly do gender detection… We want the Trust to be a community resource.”
After describing the goals behind the Center, Sun demonstrated some of the functionality of the Center’s interactive interface — their portal:
Interaction with the Center in this manner is very much like interaction with JSTOR’s Data For Research. Search content. Run job. Download results. Do further analysis. See a blog posting called JSTOR Tool as an example.
Unlike JSTOR’s Data For Research site, the HathiTrust Research Center has future plans to allow investigators to upload a virtual machine image to the Center. Researchers will then be able to run their own applications through a shell on the virtual machine. (No, hackers will not be enabled to download copyrighted materials through such an interface.) This type of interaction with the Center is a perfect example of moving an application to the data instead of the other way around.
Sun also highlighted the Center’s wiki where there is documentation describing the query and data APIs. The query API is based on Solr allowing you to search the Trust. The data API provides a means for downloading metadata and associated content.
As the presentation was winding down I thought of a number of ways the underlying metadata and reading experience could be improved through a series of relatively easy applications. They include:
This was the last of our sponsored digital humanities presentations for the academic year. Matthew Wilkens and I sincerely appreciate the time and effort Beth Plale and Yiming Sun spent in coming to visit us. It was very interesting to learn about and discuss ways the content of HathiTrust can used to expand our knowledge of the human condition. “Thank you, Beth and Yiming! Fun with the digital humanities”.
2013-05-21T19:37:42+00:00 DH @ Notre Dame: JSTOR Tool — A Programatic sketch http://dh.crc.nd.edu/blog/2013/05/jstor-tool-a-programatic-sketch/JSTOR Tool is a “programatic sketch” — a simple and rudimentary investigation of what might be done with datasets dumped from Data For Research of JSTOR.
More specifically, a search was done against JSTOR for English language articles dealing with Thoreau, Emerson, Hawthorne, Whitman, and transcendentalism. A dataset of citations, n-grams, frequently used words, and statistically significant key words was then downloaded. A Perl script was used to list the articles, provide access to them, but also visualize some of their characteristics. These visualizations include wordclouds, a timeline, and a concordance.
Why do this? Because we suffer from information overload and computers provide a way to read things from a “distance”. Indexes and search engines are great, but no matter how sophisticated your query, the search results are going to be large. Given a corpus of materials, computers can be used to evaluate, analyze, and measure content in ways that are not feasible for humans. This page begins to illustrate how a cosmos can be created from an apparent chaos of content — it is a demonstration of how librarianship can go beyond find & get and move towards use & understand.
Give JSTOR Tool a whirl, and tell me how you think the data from JSTOR could be exploited for use & understanding.
2013-05-17T15:40:31+00:00 DH @ Notre Dame: Matt Sag and copyright http://dh.crc.nd.edu/blog/2013/04/matt-sag/

Eric, Matt, and Matt
The presentation was well-attended, and here a few of my personal take-aways:
Okay. So this particular mini-travelogue may not be one of my greatest, but Sag was a good speaker, and a greater number of people than usual came up to me after the event expressing their appreciation to hear him share his ideas. Matt Sag, thank you!
2013-04-29T15:37:38+00:00 Life of a Librarian: Catholic pamphlets workflow http://sites.nd.edu/emorgan/2013/04/workflow/
Gratuitous eye candy by Matisse
Done, but I’m sure your milage will vary.
2013-04-12T20:15:57+00:00 DH @ Notre Dame: Copyright And The Digital Humanities http://dh.crc.nd.edu/blog/2013/04/copyright/This Friday (April 12) the Notre Dame Digital Humanities group will be sponsoring a lunchtime presentation by Matthew Sag called Copyright And The Digital Humanities:
I will explain how practices such as text mining present a fundamental challenge to our understanding of copyright law and what this means for scholars in the digital humanities.
Matthew Sag is a faculty member at the law school at Loyola University Chicago. [1, 2] If you would like to attend, then please drop me (Eric Lease Morgan <emorgan@nd.edu>) a note so I can better plan. Free food.
[1] Sag’s personal Web page
[2] Sag’s professional Web page
Grilled Cheese Lunch Attendees
For the past few months I have been visiting other centers across campus in order to learn what they do, and how we can work collaboratively with them. These centers included the Center for Social Research, the Center for Creative Computing, the Center for Research Computing, the Kaneb Center, Academic Technologies, as well as a number of computer lab/classroom. Since we all have more things in common than differences, I recently tried to build a bit of community through a grilled cheese lunch. The event was an unqualified success, and pictured are some of the attendees.
Fun with conversation and food.
2013-04-05T01:41:57+00:00 Life of a Librarian: Editors across campus: A reverse travelogue http://sites.nd.edu/emorgan/2013/03/editors-across/

Some attending editors
Professionally, I began to experience changes in the scholarly communications process almost twenty years ago when I learned how the cost of academic journals was increasing by as much as 5%-7% per year every year. With the advent of globally networked computers, the scholarly communications process is now effecting academics more directly.
In an effort to raise the awareness of the issues and provide a forum for discussing them, The Willing first compiled a list of academic journals whose editors were employed by the University. There are/were about sixty journals. Being good librarians, we subdivided these journals into smaller piles based on various characteristics. We then invited subsets of the journal editors to a lunch to discuss common problems and solutions.
The lunch was attended by sixteen people, and they were from all over the campus wearing the widest variety of hats. Humanists, scientists, and social scientists. Undergraduate students, junior faculty, staff, senior faculty. Each of us, including myself, had a lot to say about our individual experiences. We barely got around the room with our introductions in the allotted hour. Despite this fact, a number of common themes — listed below in more or less priority order — became readily apparent:
With such a wide variety of topics it was difficult to have a focused discussion on any one of them in the given time and allow everybody to express their most important concerns. Consequently it was decided by the group to select individual themes and sponsor additional get togethers whose purpose will be to discuss the selected theme and only the selected theme. We will see what we can do.
Appreciation goes to The Willing (Kenneth Kinslow, Parker Ladwig, Collette Mak, Cheryl Smith, Lisa Welty, Marsha Stevenson, and myself) as well as all the attending editors. “Thanks! It could not have happened without you.”
2013-03-08T22:58:09+00:00 DH @ Notre Dame: Digital humanities and the liberal arts http://dh.crc.nd.edu/blog/2013/03/liberal-arts/

Galileo demonstrates the telescope
Much of the knowledge created by humankind is manifest in the arts — literature, music, sculpture, architecture, painting, etc. Once the things of the arts are digitized it is possible to analyse them in the same way physical scientists analyze the natural world. This analysis almost always takes the shape of measurement. Earthquakes have a measurable magnitude and geographic location. Atomic elements have a measurable charge and behave in predicable ways. With the use of computers, Picasso’s paintings can be characterized by color, and Shakespeare’s plays can be classified according to genre. The arts can be analyzed similarly, but this type of analysis is in no way a predeterminer of truth nor meaning. They are only measurements and observations.
Libraries and other cultural heritage institutions — the homes for many of artistic artifacts — can play a central role in the application of the digital humanities. None of it happens without digitization. This is the first step. The next step is the amalgamation and assimilation of basic digital humanities tools so they can be used by students, instructors, and researchers for learning, teaching, and scholarship. This means libraries and cultural heritage institutions will need to go beyond basic services like find and get; they will want to move to other things such as annotate, visualize, compare & contrast, etc.
This proposed presentation elaborates on the ideas outlined above, and demonstrates some of them through the following investigations:
Digital humanities simply applies computing techniques to the liberal arts. Their use is similar to use of the magnifying glass by Galileo. Instead of turning it down to count the number of fibers in a cloth (or to write an email message), it is being turned up to gaze at the stars (or to analyze the human condition). What he finds there is not so much truth as much as new ways to observe. Digital humanities computing techniques hold similar promises for students, instructors, and scholars of the liberal arts.
2013-03-05T16:01:14+00:00 DH @ Notre Dame: Introduction to text mining http://dh.crc.nd.edu/blog/2013/03/text-mining/

Starry Night by Van Gogh
Text mining starts with counting words. Feed a computer program a text document. The program parses the document into words (tokens), and a simple length of the document can be determined. Relatively speaking, is the document a long work or a short work? After the words are counted, they can be tabulated to determine frequencies. One set of words occurs more frequently than others. Some words only occur once. Documents with a relatively high number of unique words are usually considered more difficult to read.
The positions of words in a document can also be calculated. Where in a document are particular words used? Towards the beginning? The middle? The end? In the form of a histogram, plotting frequencies of words against relative positions can highlight the introduction, discussion, and conclusion of themes. Plotting multiple words on the same histogram — whether they be synonyms or antonyms — may literally illustrate ways they are used in conjunction. Or not? If a single word holds some meaning, then do pairs of words hold twice as much meaning? The answer is, “Sometimes”. Phrases (n-grams) are easy to count and tabulate once the postions of words are determined, and since meaning is often not determined solely in single words but multi-word phrases, n-grams are interesting to observe.
Each human language adheres to a set of rules and conventions. If they didn’t, then no body would be able to understand anybody else. A written language has syntax and semantics. Such rules in the English language include: all sentences start with a capital letter and end with a defined set of punctuation marks. Proper nouns begin with capital letters. Gerunds end in “ing”, and adverbs end in “ly”. Furthermore, we know certain words carry gender connotations or connotations regarding singularity or plurality. Given these rules (which are not necessarily hard and fast) it is possible to write computer programs do to some analysis. This is called natural language processing. Is this book more or less male or female? Are there many people in the book? Where does it take place? Over what time periods? Is the text full of action verbs or are things rather passive? What parts-of-speech predominate the text or corpus?
All of the examples from the preceding paragraphs describe the beginnings of text mining in the digital humanities. There are many Web-based applications allowing one to do some of this analysis, and there are many others that are not Web-based, but there are few, if any, doing everything the scholar will want to do. That is the definition of scholarship. Correct? Most digital humanities investigations will require team efforts — the combined skills of many different people: domain experts, computer programmers, graphic designers, etc.
The following links point to directories of digital humanities tools. Browse the content of the links to get and idea of what sorts of things can be done relatively quickly and easily:
In the following is a link to a particular digital humanities tool. Also included are a few links making up a tiny corpus. Use the tool to do some evaluation against the texts. What sort of observations are you able to discern using the tool? Based on those observations, what else might you want to discover? Are you able to make any valid judgments about the texts or about the corpus as a whole?
Use some of your own links — build your own corpus — to do some of analysis from your own domain. What new things did you learn? What things did you know previously that were brought to light quickly? Would a novice in your domain be able to see these things as quickly as you?
Text mining is a perfect blend between the humanities and the sciences. It epitomizes a bridge between the two cultures of C. P. Snow. [1] Science does not explain. Instead it merely observes, describes, and predicts. Moreover, it does this in a way that can be verified and repeated by others. Through the use of a computer, text mining offers the same observation processes to the humanist. In the end text mining — and other digital humanities endeavors — can provide an additional means for accomplishing the goals of the humanities scholar — to describe, predict, and ultimately understand the human condition.
The digital humanities simply apply computing techniques to the liberal arts. Their use is similar to use of the magnifying glass by Galileo. Instead of turning it down to count the number of fibers in a cloth (or to write an email message), it is being turned up to gaze at the stars (or to analyze the human condition). What he finds there is not so much truth as much as new ways to observe.
[1] Snow, C. P., 1963. The two cultures ; and, A second look. New York: New American Library.
2013-03-04T19:45:38+00:00 LiAM: Linked Archival Metadata: Welcome! http://sites.tufts.edu/liam/2013/02/11/project-abstract/The Linked Archival Metadata (LiAM) Project is funded by the Institute of Museum and Library Services’ National Leadership Grants Program as a Planning Grant. Tufts University’s Digital Collections and Archives is the project lead. Work on LiAM began October 1, 2012, and is scheduled to be complete by September 30, 2013.
LiAM is focused on planning for the application of linked data approaches to archival description. Our goal is to better understand the benefits that linked data could bring to the management, discovery, and use of archival collections while also investigating the efforts required to implement these approaches. Central to this effort is identifying graduated approaches that will enable archives to build on existing description as well as mapping out a more ambitious vision for linked data in archives.
![]()
This project is made possible by a grant from the U.S. Institute of Museum and Library Services.
The Institute of Museum and Library Services is the primary source of federal support for the nation’s 123,000 libraries and 17,500 museums. Through grant making, policy development, and research, IMLS helps communities and individuals thrive through broad public access to knowledge, cultural heritage, and lifelong learning.

Leadership of the LiAM Project is provided by Tufts University’s Digital Collections and Archives [DCA]. DCA supports the teaching and research mission of Tufts University by ensuring the enduring preservation and accessibility of the university’s permanently valuable records and collections. The DCA assists departments, faculty, and staff in managing records and other assets. The DCA collaborates with members of the Tufts community and others to develop tools to discover and access collections to support teaching, research, and administrative needs.
I was wondering what percentage of subscribers to the Code4Lib mailing list were male and female, and consequently I wrote a hack. This posting describes it — the hack that is, genderizing names.
I own/moderate a mailing list called Code4Lib. The purpose of the list is provide a forum for the discussion of computers in libraries. It started out as a place to discuss computer programming, but it has evolved into a community surrounding the use of computers in libraries in general. I am also interested in digital humanities computing techniques, and I got to wondering whether or not I could figure out the degree the list is populated by men and women. To answer this question, I:
In my opinion, the results were not conclusive. About a third of the names are “ungenderizable” because no name was supplied by a mailing list subscriber or the Gendered Names service was not able to determine gender. That aside, most of the genderized names are male (41%) and just over a quarter (26%) of the names are female. See the chart:

To illustrate how the names are represented in the subscriber base, I also created a word cloud. The cloud does not include the “no named” people, the unknown genders, nor the names where there was only one occurrence. (The later have been removed to protect the innocent.) Here is the word cloud:

While I do not feel comfortable giving away the original raw data, I am able to make available the script used to do these calculations as well as the script’s output:
What did I learn? My understanding of the power of counting was re-enforced. I learned about a Web Service called Gendered Names. (“Thank you, Misty De Meo!”). And I learned a bit about the make-up of the Code4Lib mailing list, but not much.
2013-01-29T21:24:23+00:00 Life of a Librarian: Editors Across The Campus http://sites.nd.edu/emorgan/2013/01/editor/
gratuitous “eye candy” by Matisse
Here at the University quite a number of journals, magazines, and various other types of serial literature are edited by local faculty, students, and staff; based on our investigations there are more than one hundred editors who have their hands in more than sixty serial titles.
Bringing editors together from across campus will build community. It will foster the creation of a support network. It will also make it easier for people interested in scholarly communication to hear, learn, and prioritize issues and challenges facing editors. Once these issues are identified and possibly prioritized, then plans can be made to address the issues effectively. Thus, the purpose of the lunch/discussion combination is to begin to share “war stories” in the hopes of at least finding some common ground. Issues and challenges might include but are certainly not limited to:
We sincerely believe we all have more things in common than differences. If you are an editor or someone who is keenly interested in the scholarly communications process, then drop us a line (Eric Lease Morgan <emorgan@nd.edu>, 631-8604), come to the lunch, and participate in the discussion. We hope to see you there.
2013-01-18T00:18:06+00:00 DH @ Notre Dame: Visualization and GIS http://dh.crc.nd.edu/blog/2012/12/visualization-and-gis/The latest “digital humanities” lunch presentations were on the topics of visualization and GIS.
Kristina Davis (Center for Research Computing) gave our lunchtime crowd a tour of online resources for visualization. “Visualization is about transforming data into visual representations in order to analyze and understand… It is about seeing the invisible, and it facilitates communication… Visualization has changed from a luxury to a necessity because of the volume of available information… And the process requires the skills of many people, at least: content specialists, graphic designers, computer programmers, and cognitive psychologists… The later is important because different people and cultures bring along different perceptions and assumptions. Red and green may mean stop and go to one group of people, but they mean something completely different to a different group of people. Color choice is not random.” Davis then proceded to use her website as well as others to show examples of visualization:

A stacked diagram from Information Zoo
“Visualization is not eye-candy but rather a way to convey information.”
Rumana Reaz Arifin (Center for Research Computing) then shared with the audience an overview of geographic information systems (GIS) for the humanities. She described it as a process of mapping data with reference to some spatial location. It therefore consists of two parts: a spatial part denoting place, and attributes — information of the spatial features. Often times the spatial parts are in vector (shapefiles) or raster formats (images), and the attributes are contained in text files or database application files. The two file types are joined together to illustrate characteristics of a place using latitudes and longitudes, addresses or relational key. One of the things I found most interesting was the problem of projection. In other words, considering the fact that the Earth is round, maps of large areas of the world need to be bent in order to compensate for the flat surface of paper or a computer screen. Arifin then gave an overview of various GIS applications, both commercial (ArcGIS, Mapinfo, etc.) and open source (GRASS, GeoDA, etc.), as well as some of the functionality of each. Finally, she demonstrated some real world GIS solutions.

Hospitals around Dallas (Texas)
“GIS is not just mapping, [the] map is the end product of analysis.”
2012-12-19T19:08:27+00:00 DH @ Notre Dame: Ted Underwood and “Learning what we don’t know about literary history” http://dh.crc.nd.edu/blog/2012/12/literary-history/This is a much belated reverse travelogue summarizing a presentation given by Ted Underwood called “Learning what we don’t know about literary history”.

Matthew Wilkens and Ted Underwood
On Thursday, November 15, Ted Underwood (University of Illinois at Urbana-Champaign) gave a presentation to a group of about thirty people here at Notre Dame. The title of the presentation was “Learning what we don’t know about literary history“. In a sentence, the presentation described how and why the digital humanities represent a significant emerging scholarly activity.
Underwood is a scholar of 18th and 19th century literature, and he has been using digital humanities computing techniques for a few years to stumble upon and explore “blind spots” — interesting ideas he did not see. He says, “It is a process driven by ignorance.”
Underwood advocates simple word counts (tabulation) as a way to get started with the digital humanities, but as an example of ways to go further he described work — specifically through application of Latent Dirichlet Allocation (LDA) — to classify documents such as Shakespeare’s plays. In the case of Shakespeare’s works, the use of LDA has more or less (mostly more) been able to correctly classify the plays into comedies, tragedies, and histories.
Much of Underwood’s work surrounds the comparison of genre and diction. He describes genre as a recurring rhetorical process (business letters, Gothic novels, etc.). He describes diction as “word choice”. Beginning with specialized word tabulation — the Wilcoxon Signed-Rank Test — Underwood was able to enumerate sets of “fictive diction” for different types of literature over different centuries. For example, compare some of the more frequently used words in 18th century fiction with the more frequently used words in 19th century fiction:
(I will let you draw your own conclusions regarding the similarities and differences between the two lists of words.)
“We might be able to assume that all genres have their own diction. And we might ask ourselves, how have those dictions changed over time?”, said Underwood. To begin to answer this question Underwood first created lists of words frequently used in poetry, prose fiction, and non-fiction. He then compared the use of these words over time and discovered the diction of poetry increased while the diction of non-fiction was relatively stable, as illustrated by the following figure.

To conclude the presentation, Underwood outlined a number of implications of the digital humanities for scholarship, including:
Now here is the point, as outlined by me, the author of this posting. Digital humanities computing techniques allow scholars to ask and address questions like Underwood’s. These techniques do not so much answer questions as much as they provide an additional means of analysis. If the content of the humanities — whether it be text, images, sounds, etc. — is treated like scientific data, then it can be measured, graphed, and evaluated in new and different ways. Such analysis does not replace traditional humanities scholarship as much as it supplements the ways it can be applied.
The “digital humanities” group here at Notre Dame sincerely appreciates the time and energy Ted Underwood spent describing how the computing techniques can be applied to the humanities. Thank you, Ted.
2012-12-07T16:03:17+00:00 DH @ Notre Dame: Visualizations and geographic information systems http://dh.crc.nd.edu/blog/2012/11/visualizations-and-gis/The next meeting of our “digital humanities” group will take place on Friday, December 7 from 11:45 to 1 o’clock in the the Video Grid Room of OIT. (That’s on the first floor of the OIT building, Room 121). Lunch will be served.
There will be two short, introductory presentations:
Both of these techniques provide meaningful ways of making sense of of any large corpora of text (or data). Matthew and I thought they make a good pair, and we also thought it would be a good idea to get out of our normal venue to see other things out and about.
Can we plan on your attendance? The more the merrier. Invite your friends. Everybody and anybody is welcome. Call or write us so we may plan accordingly:
A couple of Open Access Week events were sponsored here at Notre Dame on October 31, and this posting summarizes my experiences.

Many of The Willing plus Nick Shockey and José E. Limón
In the morning there was a presentation to library faculty by Nick Shockey (SPARC), specifically on the process of increasing open access publishing, and he outlined five different tactics:
Finally, Shockey insisted on engaging authors on very real world problems instead of the philosophical issues such as expanding the sphere of knowledge. “Look for and point out tangible benefits of open access including higher citation counts, wider distribution, and the possibility of massive textual analysis.”
The afternoon session was co-presented by Nick Shockey and José E. Limón. The topic was authors’ rights.
Shockey began by outlining the origination of scholarly journals and how they were originally non-profit enterprises. But as time went on and the publishing increasingly became profit-based, a question needed to be asked, “How well does this new model really serve the people for whom it is needed?” When the prices of some chemistry journals approach $4,200/year, there has got to be a better way.
Knowing author’s rights can help. For example, knowing, understanding, and acting upon the self-archiving rights associated with many journals now-a-days, it is possible to make available versions of published materials in a much wider fashion than ever before, but it does require some extra work — systematic extra work that could be done by libraries.
Shockey also advocated contractual amendments like the one called the Scholar’s Copyright Addendum Engine [1]. Complete the form with our name, title, and journal. Click the button. Print the form. Sign and send away to the publisher while retaining many of one’s rights automatically.
Finally, Shockey advocated university-wide institutional policies for retaining authors’ rights. “These policies create a broader and wider audiences which are not limited and offer greater visibility.”
José E. Limón (American Studies at the University of Notre Dame) began by confessing the idea of authors’ right has been rather foreign to him, and at the same time the ante is going up in terms of tenure and promotion. No longer is is about publishing a single book. Consequently he believes his knowledge regarding authors’ rights needs to be increased.
Limón went on to regale a personal story about authors’ rights. It began when he discovered an unpublished manuscript at Texas A&M University. It was a novel coauthored by Jovita González and Margaret Eimer which he edited and eventually published under the title of Caballero. Written in the 1930s, this historical novel is set during the Mexican American War and is sometimes called Texas’s Gone with the Wind. After the book was published Limón was approached by Steven Spielberg’s company about movie rights, but after a bit of investigation he discovered he had no rights to the book, but rather the rights remained with Texas A&M. To many in the audience, the story was a bit alarming.
In the end, he had one thing to say, “Academics just do not know.”
Kudos to Nick Shockey and José E. Limón for sharing some of their experiences. “Thank you!” Thanks also go to the ad hoc group in the Hesburgh Libraries who call themselves “The Willing” (Kenneth Kinslow, Parker Ladwig, Collette Mak, Cheryl Smith, Marsha Stevenson, Lisa Welty, and Eric Lease Morgan). Without their help none of this would have happend.
2012-11-17T02:39:32+00:00 Life of a Librarian: New Media From the Middle Ages To The Digital Age http://sites.nd.edu/emorgan/2012/11/new-media-from-the-middle-ages-to-the-digital-age/
 I attended an interesting lecture yesterday from a series called New Media From the Middle Ages to the Digital Age, and here are a few of my take-aways.
Peter Holland (Film, Television, and Theatre) began by giving an overview of his academic career. He noted how his technology of the time was a portable typewriter. He then went on to compare and contrast scholarship then and now. From what I could tell, he did not think there was a significant difference, with the exception of one thing — the role and definition of community. In the past community meant going to conferences and writing letters every once in a while. Now-a-days, conferences are still important, letters have been replaced by email, but things like mailing lists play a much larger role in community. This sort of technology has made it possible to communicate with a much wider audience much faster than in previously times. The SHAKSPER mailing was his best example.
The next presentation was by Elliott Visconsi (English). While the foundation of his presentation surrounded his The Tempest for iPad project, he was really focused on how technology can be used to enhance learning, teaching, and research. He believed portable Web apps represent a convergence of new and old technologies. I believe he called them “magic books”. One of his best examples is how the application can support dynamic and multiple commentaries on particular passages as well as dynamic and different ways speeches can be vocalized. This, combined with social media, give Web applications some distinct advantages over traditional pedagogical approaches.
From my point of view, both approaches have their distinct advantages and disadvantages. Traditional teaching and learning tolls are less fragile — less mutable. But at the same time they rely very much on the work of a single individual. On the the other hand, the use of new technology is expensive to create and keep up-to-date while offering a richer learning experience that is easier to use in groups. “Two heads are better than one.”
2012-11-07T01:41:47+00:00 DH @ Notre Dame: Ted Underwood http://dh.crc.nd.edu/blog/2012/11/underwood/The next Digital Humanities Lunch (or whatever we are calling this) will take place on Thursday, November 15 from 11:30 to 1 o’clock in the Gold Room (Room 306) of LaFortune. Will you be attending?
Our featured speaker will be Ted Underwood from the English Department of UIUC. The title and abstract of his presentation follows:
Learning What We Don’t Know About Literary History
In applying computational methods to the humanities, the primary challenge is to identify new and useful questions. On the one hand, we don’t want our research programs to be shaped simply by the capacities of new technology. But it may be equally unprofitable to cling to familiar questions that we’re already good at answering (say, interpretive questions about a single text).
To slice through that dilemma, I’ll present quantification as a way of uncovering our own ignorance. Research should be driven, not by what computers can do, or by what we already know, but by surprising blind spots we discover. I would argue that literary scholars are now discovering that our ignorance is deeper and more exciting than we’ve allowed ourselves to imagine. As we back up and take a broader view of the discipline, basic concepts like “genre,” “theme,” diction” — perhaps even “literature” itself — are refusing to behave as predicted.
I’ll focus on eighteenth- and nineteenth-century literature in English, and especially on the intersection of genre and diction (e.g., what is “poetic diction”?) But in exploring these topics I’ll emphasize general questions of method that might also be relevant to the social or natural sciences. For instance, at what point in a research workflow does it make sense to use “supervised” or “unsupervised” learning? I hope the talk will be followed by broadly interdisciplinary discussion.
‘Hope to see you there. Tell your friends and colleagues, and don’t hesitate drop us a line if you plan to attend so we may better plan.
2012-11-06T15:35:28+00:00 DH @ Notre Dame: DH Lunch #2 http://dh.crc.nd.edu/blog/2012/10/dh-lunch-02/The second “Digital Humanities” Lunch took place last Friday (October 5), and this posting outlines some of my take-aways.

Attendees of the DH Lunch #2
As planned we hosted a number of “lightning talks” — a set of very short and very informal presentations. The first up was Martin Bloomer (Classics). He has been collecting information and researching on the use of Cato’s seminal work for a long time, and now he wants to create something going beyond the traditional critical addition. We learned from Martin how Cato’s work has been used to teach reading, writing, and ethics across the Western world for a millenium, at least. Cato has been translated into a myriad of different languages, commented upon through the ages, and been manifested in hundreds of different editions. Martin sees a website bringing together all of these various characteristics of Cato’s legacy and allow students as well as researchers to use the site for learning and scholarship.
Susy Sanchez (Kellogg Institute) volunteered to go second. Her goal is to trace and illustrate the network of fascism in Latin America since World War II. Apparently the Hesburgh Libraries holds a significant — if not complete — collection of pertinent microfilmed documents in this area. She sees the scanning of the microfilm as a first step. The second step would be do textual analysis against the result including named entity extraction. The proximity of names in these texts would help form a history and “network” that could literally be illustrated to help understand who was associated with whom and when.
Next up was Charles Pence (Philosophy) who has been doing collocation and frequency analysis against science journals over time. He and Grant Ramsey (Philosophy) have been collecting full text journal articles from titles like Science and Nature. They are examining the use of words such as “evolution” and “fitness” to determine how use and meaning has changed. Charles noted how the writing software and optical character recognition have been challenges, but the biggest challenge may be copyright. Acquiring the full text journal articles is not only laborious but fraught with legal and contractual impediments. He noted how some publishers seem amenable to text mining activities but others were not.
Doug Thain (Computer Science) described his two primary research interests. The first is scalable computing — the process of efficiently distributing a computing problem over thousand’s of computers. As it turns out, such a thing may not be as difficult as it first appears, and is entirely feasible with the proper set of networked and idle computers. He and a few of his graduate students will be facilitating a workshop on the topic in a few weeks. He introduced his second research interest as a “good news, bad news” sort of problem. With scalable computing also comes plenty of data output, and his second research interest is discovering ways to efficiently manage this data on a the scale of terabytes. He gave examples from biometrics here on campus and physics from the folks of CERN (Switzerland).
The last lightning talk was given by Douglas Duhaime (English). Douglas desires to have a better understanding of how the philosophy of the Hermetics was manifested during the 18th century, specifically in regards to the Illuminati. He already uses a “workflow” running on top of a suite of textual analysis software called SEASR. He feels this software works very well for him. His problem, like Charles’s and Grant’s, is content. Acquiring a comprehensive collection full text content from the 18th century has proven difficult. ECCO (Eighteenth Century Collections Online) has much of the desired content, but getting at in a way that is amenable to textual analysis has proven to be difficult.
During and after each talk there was discussion by the group as a whole. Names of other people doing similar work were mentioned. Similar projects were described. Possible solutions were proposed. In short, the process worked. By bringing people together and allowing them to share their ideas, new ideas were generated and connections made. Maybe we are making progress?
The next event will probably happen on Thursday, November 15 with a presentation by an outside speaker. Stay tuned?
2012-10-10T15:49:54+00:00 Life of a Librarian: So many editors! http://sites.nd.edu/emorgan/2012/09/editors/There are so many editors of serial content here at the University of Notre Dame!
In a previous posting I listed the titles of serials content with editors here at Notre Dame. I identified about fifty-nine titles. I then read more about each serial title and created a sub-list of editors which resulted in about 113 names. The original idea was to gather as many of the editors together as possible and facilitate a discussion on scholarly communication, but alas, the number of 113 people is far too many for a chat.
Being a good librarian, I commenced to classify my list of serials hoping to create smaller, more cohesive groups of people. I used facets such as student-run, peer-reviewed, open access, journal (as opposed to blog), and subjects. This being done I was able to create subsets of the titles with much more manageable numbers of editors. For example:
One of our goals here in the Libraries to play a role in the local scholarly communication process. Exactly what that role entails is yet to be determined. Bringing together editors from across campus could build community. It could also make it easier for us to hear, learn, and prioritize issues facing editors. Once we know what those issues are, we might be able to figure out a role for ourselves. Maybe there isn’t a role. On the other hand, maybe there is something significant we can do.
The next step is to figure out whether or not to bring subsets of these editors together, and if so, then how. We’ll see what happens.
2012-09-22T01:26:16+00:00 DH @ Notre Dame: Digital humanities centers http://dh.crc.nd.edu/blog/2012/09/centers/This is a list of two directories of digital humanities centers from across the globe:
Saved for future reference, and because librarians love lists.
2012-09-19T15:42:44+00:00 DH @ Notre Dame: Lunch and lightning talks http://dh.crc.nd.edu/blog/2012/09/lightning-talks/The next Notre Dame “Digital Humanities” Lunch will take place on Friday, October 5, and it will feature sets of “lightning talks” from people across our Initiative. Will you attend?
Lighting talks are very short and very informal presentations — definitely less than ten minutes. For our purposes, they are intended to share research problems and possible solutions. For example, “I needed to polish my widgets more quickly and efficiently, and my secret formula really did the job. The next step is to collaborate with somebody from Innovation Park.” More seriously, I might share some of my work surrounding the Great Books, and Matt might share some of his geotagging work.
I know quite a number of you have interesting things to share, even if they are only tentative. Please drop me or Matthew Wilkens a line by this Monday if you would like to share some of your ideas, no matter how big or small.
Anybody and everybody is invited. Please share the invitation. ‘See you there?
2012-09-19T13:49:56+00:00 DH @ Notre Dame: Inaugural Digital Humanities Working Group lunch: Meeting notes http://dh.crc.nd.edu/blog/2012/09/notes-01/ These are the briefest of meeting notes from the inaugural “Digital Humanities Working Group” lunch.*
The inaugural Digital Humanities Working Group lunch was held today in the LaFortune building, and it was attended by approximately twenty people from a quite diverse set of academic disciplines.
The purpose of the meeting was to garner desires and expectations for future topics of discussion. In the end the following things to do, have presentations on, or learn about were brainstormed:
At the very end of the meeting the items on the list were voted upon, and consequently the list is more or less in a priority order.
Since a primary purpose of the Initiative is to build community and share expertise, Matthew Wilkens and I will try to have the October meeting in the same venue but use it to facilitate “lightning talks” on research problems. In November and tentatively, we will try to schedule an outside speaker who will share their experiences with textual analysis/mining.
Thank you for your participation, and please don’t hesitate to share your ideas on the mailing list.
* This Initiative is not necessarily about the digital humanities, so if we could come up with a more descriptive name, then some of us would be grateful.
2012-09-14T20:42:59+00:00 Life of a Librarian: Yet more about HathiTrust items http://sites.nd.edu/emorgan/2012/09/more-hathitrust/This directory includes the files necessary to determine what downloadable public domain items in the HathiTrust are also in the Notre Dame collection.
In previous postings I described some investigations regarding HathiTrust and Notre Dame collections. [1, 2, 3] Just yesterday I got back from a HathiTrust meeting and learned that even the Google digitized items in the public domain are not really downloadable without signing some sort of contract.
Consequently, I downloaded a very large list of 100% downloadable public domain items from the HathiTrust (pd.xml). I then extracted the identifiers from the list using a stylesheet (pd.xsl). The result is pd.txt. Starting with my local MARC records created from the blog postings (nd.marc), I wrote a Perl script (nd.pl) to extract all the identifiers (nd.txt). Lastly, I computed the intersection of the two lists using a second Perl script (compare.pl) resulting in a third text file (both.txt). The result is a list of public domain items in the HathiTrust as well as in the collection here at Notre Dame as well as require no disambiguation because the item has not been digitized more than once. (“Confused yet?”)
It is now possible to download the entire digitized book through the HathiTrust Data API via a Web form. [4] Or you can use something like the following URL:
http://babel.hathitrust.org/cgi/htd/aggregate/<ID>
where <ID> is a HathiTrust identifier. For example:
http://babel.hathitrust.org/cgi/htd/aggregate/mdp.39015003700393
Of the about 20,000 items previously “freely” available, it seems that there are now just more than 2,000. In other words, about 18,000 of the items I previously thought were freely available for our catalog are not really “free” but instead permissions still need to be garnered in order to get these free items.
I swear we are presently creating a Digital Dark Age!
The inaugural Computational Methods In The Humanities and Sciences (“digital humanities”) lunch will take place on Friday, September 14 from 11:45 to 1 o’clock in the Dooley Room of LaFortune. Free food. Will you be attending?
Matthew Wilkens (English) and I have begun an initiative whose purpose is foster the sharing of research techniques between humanists and scientists here at Notre Dame. It is a funded Provost’s Initiative called Computational Methods In The Humanities and Sciences.
The inaugural meeting will be a lunch and discussion. The primary goals will be to introduce ourselves to each other and to brainstorm a list of names of people (from both inside and outside the University) who may be good speakers for upcoming events. Specifically the agenda includes:
In an effort to plan accordingly, Matthew and I need to know how many people will be attending. Please let me (Eric Morgan) know by Friday, September 7.
Remember, anybody and everybody is welcome. If you know of others who may be interested, then please don’t hesitate to pass the invitation along.
2012-09-04T15:52:40+00:00 DH @ Notre Dame: Granting opportunity http://dh.crc.nd.edu/blog/2012/09/granting-opportunity/If a person were to look at sets of digitized text as “data sets” — even though they are not traditionally seen this way — then the following granting opportunity from the Sloan Foundation may be of interest to some of us doing digital humanities:
Data and computational Research
From the natural sciences to the social sciences to the humanities to the arts, the availability of more data and cheaper computing is transforming research. As costs for sensors, sequencing, and other forms of data collection decline, researchers can generate data at greater and greater scale, relying on parallel increases in computational power to make sense of it all and allowing the investigation of phenomena too large or complex for conventional observation.
Grants in this sub-program aim to help researchers develop tools, establish norms, and build the institutional and social infrastructure needed to take full advantage of these important developments in data-driven, computation-intensive research. Emphasis is placed on projects that encourage access to and sharing of scholarly data, that promote the development of standards and taxonomies necessary for the interoperability of datasets, that enable the replication of computational research, and that investigate models of how researchers might deal with the increasingly central role played by data management and curation.
Thank you to Patrick J. Flynn (Computer Science) for bringing this to my attention.
2012-09-04T13:58:40+00:00 DH @ Notre Dame: Visualization tools http://dh.crc.nd.edu/blog/2012/09/visualization-tools/Through the grapevine I learned of the following two directories of visualization tools that may be of interest to any number of our communities, digital humanities or not:
This is the home page for a mailing list called Notre Dame Digital Humanities (ND-DH).
The purpose of the list is to facilitate discussion of the digital humanities — broadly defined — here at the University of Notre Dame. Discussion topics might include but are not limited to: text mining, computational models applied to images, the role of the digital humanities in traditional scholarship, funding opportunities, collaborations, announcements, ways digital humanities may be applied in a classroom setting, etc.
To subscribe to the list send an email message to listserv@listserv.nd.edu, and in the body of the message enter:
Where <your-name> is… your name.
To unsubscribe, send a message to listserv@listserv.nd.edu, and in the body of the message enter:
Send postings to nd-dh@listserv.nd.edu.
You can do other sorts of list management things as well as read an archive of the list at:
Questions? Drop me (Eric Lease Morgan, Hesburgh Libraries) a note. See you on the list.
2012-08-27T18:47:52+00:00 Life of a Librarian: Serial publications with editors at Notre Dame http://sites.nd.edu/emorgan/2012/08/serials/This is a list of serial publications (journals, yearbooks, magazines, newsletters, etc.) whose editorial board includes at least one person from the University of Notre Dame. This is not a complete list, and if you know of other titles, then please drop me a line:
This is a list titles that may or may not have had an editor from Notre Dame at one time, but to the best of my ability I could not find one.
Again, is not necessarily a complete list, and if know of other titles, then please drop me a line.
Last updated: October 1, 2012
2012-08-22T00:56:07+00:00 Life of a Librarian: Exploiting the content of the HathiTrust, epilogue http://sites.nd.edu/emorgan/2012/08/hathi-epilogue/This blog posting simply points to a browsable and downloadable set of MARC records describing a set of books in both in the HathiTrust as well as the Hesburgh Libraries at the University of Notre Dame.
In a previous blog posting I described how I downloaded about 25,000 MARC records that:
This list of MARC records is not nor was not intended to be a comprehensive list of overlapping materials between the Hesburgh Libraries collection and the HathiTrust. Instead, this list is intended to be a set of unambiguous sample data allowing us to import and assimilate HathiTrust records into our library catalog and/or “discovery system” on an experimental basis.
The browsable interface is rudimentary. Simply point your browser to the interface and a list of ten randomly selected titles from the MARC record set will be displayed. Each title will be associated with the date of publication and three links. The first link points to the HathiTrust catalog record where you will be able to read/view the item’s bibliographic data. The second link points to the digitized version of the item complete with its searching/browsing interface. Third and final link queries OCLC for libraries owning the print version of the item. This last link is here to prove that the item is owned by the Hesburgh Libraries.

Screen shot of browsable interface
For a good time, you can also download the MARC records as a batch.
Finally, why did I create this interface? Because people will want to get a feel for the items in question before the items’ descriptions and/or URLs become integrated into our local system(s). Creating a browsable interface seemed to be one of the easier ways I could accomplish that goal.
Fun with MARC records, the HathiTrust, and application programmer interfaces.
2012-08-14T23:49:33+00:00 Life of a Librarian: Exploiting the content of the HathiTrust, continued http://sites.nd.edu/emorgan/2012/08/hathitrust-continued/This blog posting describes how I created a set of MARC records representing public domain content that is in both the University of Notre Dame’s collection as well as in the HathiTrust.
In a previous posting I described how I learned about the amount of overlap between my library’s collection and the ‘Trust. There is about a 33% overlap. In other words, about one out of every three books owned by the Hesburgh Libraries has also been digitized and in the ‘Trust. I wondered how our collections and services could be improved if hypertext links between our catalog and the ‘Trust could be created.
In order to create links between our catalog and the ‘Trust, I need to identify overlapping titles and remote ‘Trust URLs. Because they originally wrote the report which started the whole thing, OCLC had to have the necessary information. Consequently I got in touch with the author of the original OCLC report (Constance Malpas) who in turn sent me a list of Notre Dame holdings complete with the most rudimentary of bibliographic data. We then had a conference call between ourselves and two others — Roy Tennant from OCLC and Lisa Stienbarger from the Notre Dame. As a group we discussed the challenges of creating an authoritative overlap list. While we all agreed the creation of links would be beneficial to my local readers, we also agreed to limit what gets linked, specifically public domain items associated with single digitized items. Links to copyrighted materials were deemed more useless than useful. One can’t download the content, and searching the content is limited. Similarly, any OCLC number — the key I planned to use to identify overlapping materials — can be associated with more than one digitized item. “To which digitized item should I link?” Trying to programmatically disambiguate between one digitized item and another was seen as too difficult to handle at the present time.
I then read the HathiTrust Bib API, and I learned it was simple. Construct a URL denoting the type of control number one wants to use to search as well as denote full or brief output. (Full output is just like brief output except full output includes a stream of MARCXML.) Send the URL off to the ‘Trust and get back a JSON stream of text. The programmer is then expected to read, parse, and analyze the result.
Energized with a self-imposed goal, I ran off to my text editor to hack a program. Given the list of OCLC numbers provided by OCLC, I wrote a Perl program that queries the ‘Trust for a single record. I then made sure the resulting record was: 1) denoted as in the public domain, 2) published prior to 1924, and 3) was associated with a single digitized item. When records matched this criteria I wrote the OCLC number, the title, and the ‘Trust URL pointing to the digitized item to a tab-delimited file. After looping through all the records I identified about 25,000 fitting my criteria. I then wrote another program which looped through the 25,000 items and created a local MARC file describing each item complete with remote HathiTrust URL. (Both of my scripts — filter-pd.pl and get-marcxml.pl — can be used by just about any library. All you need is a list of OCLC numbers.) It is now possible for us here at Notre Dame to pour these MARC records into our catalog or “discovery system”. Doing so is not always straight-forward, and if the so desire, I’ll let that work to others.
This process has been interesting. I learned that a lot of our library’s content exists in digital form, and copyright is getting in the way of making it as useful as it could be. I learned the feasibility of improving our library collections and services by linking between our catalog and remote repositories. The feasibility is high, but the process of implementation is not straight-forward. I learned how to programmatically query the HathiTrust. It is simple and easy-to-use. And I learned how the process of mass digitization has been boon as well as a bit of a bust — the result is sometimes ambiguous.
It is now our job as librarians to figure out how to exploit this environment and fulfill our mission at the same time. Hopefully, this posting will help somebody else take the next step.
2012-08-11T00:47:38+00:00 Life of a Librarian: Exploiting the content of the HathiTrust http://sites.nd.edu/emorgan/2012/08/hathitrust/I have been exploring possibilities of exploiting to a greater degree the content in the HathiTrust. This blog posting outlines some of my initial ideas.
The OCLC Research Library Partnership program recently sent us here at the University of Notre Dame a report describing and illustrating the number and types of materials held by both the University of Notre Dame and the HathiTrust — an overlap report.
As illustrated by the pie chart from the report, approximately 1/3 of our collection is in the HathiTrust. It might be interesting to link our local library catalog records to the records in the ‘Trust. I suppose the people who wrote the original report would be able supply us with a list our overlapping titles. Links could be added to our local records facilitating enhanced services to our readers. “Service excellence.”

Percentage of University of Notre Dame and HathiTrust overlap
According to the second chart, of our approximately 1,000,000 overlapping titles, about 121,000 (5%) are in the public domain. The majority of the public domain documents are government documents. On the other hand about 55,000 of our overlapping titles are both in the public domain and a part of our collection’s strengths (literature, philosophy, and history). It might be interesting to mirror any or all of these public domain documents locally. This would enable us to enhance our local collections and possibly provide services (text mining, printing, etc.) against them. “Lots of copies keep stuff safe.”

Subject coverage of the overlapping materials
According to the HathiTrust website, about 250,000 items in the ‘Trust are freely available via the public domain. For example, somebody has created a collection of public domain titles called English Short Title Catalog, which is apparently the basis of EBBO and in the public domain. [2] Maybe we could query the ‘Trust for public domain items of interest, and mirror them locally too? Maybe we could “simply” add those public domain records to our catalog? The same process could be applied collections from the Internet Archive.
The primary purpose of the HathiTrust is to archive digitized items for its membership. A secondary purpose it to provide some public access to the materials. After a bit of creative thinking on our parts, I believe it is possible to extend the definition of public access and provide enhanced services against some of the content in the archive as well as fulfill our mission as a research library.
I think will spend some time trying to get a better idea of exactly what public domain titles are in our collection as well as in the HathiTrust. Wish me luck.
2012-08-10T22:14:49+00:00 DH @ Notre Dame: Computational methods in the humanities and sciences http://dh.crc.nd.edu/blog/2012/08/initiative/This past Spring Matthew Wilkens, Pamela Tamez, and I applied for funding from the Provost to support the building of community between local humanists and scientists — a proposal we called “Computational methods in the humanities and sciences”. Our request was funded, and below is the text of our proposal. Our task now is to do the things in the proposal. If you want to participate, then please don’t hesitate to get in touch.
The goals of our initiative are threefold:
To accomplish these goals, we propose to host regular meetings throughout the upcoming academic year, culminating in a one-day symposium tentatively titled “Data Visualization / Digital Humanities Day,” modeled on the Center for Research Computing’s highly successful GIS Day.
Researchers in engineering and the natural sciences routinely generate terabytes of data in the course of their simulations and experiments. Social scientists have for decades generated huge datasets via longitudinal studies. With the mass digitization of library collections, humanists now have resources such as the entire corpus of Victorian literature at their fingertips. Thus despite their differences in aim and methodology, these disciplines share a common problem — how to make sense of massive collections of data. To address this problem, researchers are increasingly turning to the use of computers for statistical analysis, visualizations, information retrieval, and natural language processing.
There are productive overlaps between these broad research areas in matters of computational analysis, as evinced by the growing international interest in digital humanities and the widespread support for interdisciplinary computational research centers. Here on campus, there are proposed initiatives in several departments and colleges to foster interdisciplinary computational work and digital humanities. But these programs remain far from full implementation and we remain well behind our peer institutions in this area, a fact that in turn limits our ability to compete for grant funding, recruit faculty and graduate students, and serve our undergraduates.
By bringing workers in these disciplines together in formal and informal settings and by providing a means for them to learn what the others are doing, we expect there will be three important outcomes: 1) a greater appreciation of shared research methodologies, 2) a greater appreciation of the unique characteristics of each discipline, and 3) new interdisciplinary research and teaching collaborations.
We propose to host nine regularly scheduled formal and informal meetings throughout the upcoming academic year, culminating in a “Data Visualization / Digital Humanities Day.”
More specifically, we propose to host monthly lunch meetings from September through May of the 2012-2013 academic year. These meetings will be built around the work of our group members, but will be open to all interested University faculty, staff, graduate students, and undergraduates. Roughly half of these meetings will include presentations from members of the Notre Dame community. These presentations will introduce computational research methods, tools, and results from the presenter’s own work. The other half of the meetings will be built around similar presentations (either in person or virtual) by experts at institutions in the region. All of these meetings will be summarized by participants and made available via the newly created Digital Humanities Blog at Notre Dame.
In April, 2013 we will host a one-day symposium on computational research methods featuring four to six speakers, a poster session, and brief presentations by members of the larger Notre Dame community. Two or three of the plenary speakers will be internationally recognized experts from other institutions (candidates include Franco Moretti from Stanford and Lev Manovich from UCSD). The remainder of the speakers will be attached to Notre Dame. Both sets of speakers will represent the physical sciences, the social sciences, and the humanities. The symposium will be open to all without charge; the content of the colloquium will, like the working group meetings, be reported via participant blogs.
Through this process we expect to build an intellectual community of researchers on campus beyond the significant core group already attached to this proposal. We will foster intellectual exchange, document relevant experiences, and identify best practices in computationally assisted cross-disciplinary research. Members of the group will use their collective experience to articulate a set of common research problems shared among the local scientists and humanists. This set of problems will then be evaluated in order to develop research agendas for this newly defined, heterogeneous yet cohesive intellectual community.
You might say this is a reverse travelogue because it documents what I learned at a symposium that took place here at the University of Notre Dame (May 21, 2012) on the topic of patron-driven acquisitions (PDA). In a sentence, I learned that an acquisitions process partially driven by direct requests from library readers is not new, and it is a pragmatic way to supplement the building of library collections.
Symposium speakers and the PDC
Suzanne Ward, Robert Freeman, and Judith Nixon (Purdue University) began the symposium with a presentation called “Silent Partners In Collection Development: Patron-Driven Acquisitions at Purdue“. The folks at Purdue have been doing PDA for about a decade, but they advocate that libraries have been doing PDA for longer than that when you consider patron suggestion forms, books-on-demand services, etc. Their PDA program began in interlibrary-loan. When requested materials fit a particular criteria (in English, scholarly, non-fiction, cost between $50-150, ship in less than a week, and were published in the last five years), it was decided to purchase the material instead of try to borrow it. The project continued for a number of years, and after gathering sufficient data, they asked themselves a number of questions in order to summarize their experience. Who were the people who were driving the process? Sixty percent (60%) of the requests fitting the criteria were from graduate students — the “silent partners”. How much did it cost? Through the process they added about 10,000 books to the collection at a cost of about $350,000. Were these books useful? These same books seemed to circulate four times when the books purchased through other means circulated about two and half times. What were the subjects of the books being purchased? This was one of the more interesting questions because the subjects turned out to be cross-disciplinary and requestors were asking to borrow materials that generally fell outside the call number range of their particular discipline. Consequently, the PDA functions were fulfilling collection development functions in ways traditional approval profiles could not. E-book purchases are the next wave of PDA, and they have begun exploring these options, but not enough data has yet to be gathered in order for any conclusions to have been made.
Lynn Wiley (University of Illinois at Urbana-Champaign) was second and presented “Patron Driven Acquisitions: One Piece On A Continuum Of Evolving Services”. Starting in early 2010 UIUC and in conjunction with the state-wide consortium named CARLI began the first of four pilot projects exploring the feasibility of PDA. In it they loaded 16,000 MARC records into their catalog. These records represented items from their Yankee Book Peddler approval plan. Each record included a note stating that the book can be acquired upon request. The implementation was popular because they ran out of money in five weeks when they expected the money to last a lot longer. In a similar project about 6,000 ebook titles where added to the library catalog, and after 10 “activities” (uses) were done against one of the items the ebook was purchased. After about four months about 240 titles were purchased but as many as 450 examined but not triggered. Each ebook cost about $100. A third pilot expanded on the second. It included core approval items from bibliographers — about 150 items every two weeks. Requested items got a two-day turn-around time at an average cost of $60/book. Finally, a forth project is currently underway at it expands the user population to the whole of CARLI. Some of the more interesting conclusions from Wiley’s presentation include: 1) build it and they will come, 2) innovation comes out of risk taking, 3) PDA supplements collection building, 4) change circulation periods for high access books, and 5) PDA is a way to build partnerships with vendors, other librarians, and consortia.
“The Long Tail of PDA” was given by Dracine Hodges (The Ohio State University) and third in the line up. At Ohio State approximately 16,000 records representing on-demand titles were loaded into their catalog. No items were older than 2007, in a foreign language, computer manuals, or cost more than $300. They allowed patrons to select materials have have them purchased automatically. The university library allocated approximately $35,000 to the project, and it had to be cut short after a month because of the project’s popularity. Based on Hodges’s experience a number of things were learned. PDA benefits the researcher in cross-disciplines because titles get missed when they are in one or the other discipline. Second, comparing and contrasting print-based titles and ebooks is like comparing apples and oranges. The issues with print-based titles surround audience and things like courtesy cards. Whereas the issues surrounding ebooks include things like views, printing, downloads, and copying. In the future she believes she can see publishers selling things more directly to the patron as opposed to going through a library. She noted the difficulty of integrating the MARC records into the catalog. “They are free for a reason.” Hodges summarized her presentation this way, “We are doing a graduate shift from just-in-case selection to just-in-time selection, and the just-in-time selection process is a combination of activities… Print is not dead yet.”
The final presentation was by Natasha Lyandres and Laura Sill (University of Notre Dame), and it was called “Why PDA… Why Now?” In order to understand the necessary workflows, the Hesburgh Libraries experimented with patron-driven acquisitions. Fifty thousand ($50,000) was allocated and a total of 6,333 records from one ebook vendor were loaded into the Aleph catalog. The URLs in the catalog pointed to activated titles available on the vendor’s platform. Platform advantages and disadvantages became quickly apparent as patron began to make use of titles. Their questions prompted the library to draw up an FAQ page to explain features and advise patrons. Other platform issues to be further investigated are restrictions because of digital rights management, easier downloads, and printing quality. To monitor the speed of spend and to analyze the mix of content being collected, usage reports were reviewed weekly. While the work with PDA at Notre Dame is still in its infancy, and number of things have been learned. PDA is a useful way of acquiring ebooks. Print materials can be acquired in similar ways. The differences between vendor platforms should be explored some more. Ongoing funding for PDA and its place and structure in the materials budget will require further discussion and thought. Integrating PDA into formal collection development practices should be considered.
The symposium was attended by as many as seventy-five people from across the three or four states. These folks helped turn the event into a real discussion. The symposium was sponsored by the Professional Development Committee (PDC) of the Hesburgh Libraries (University of Notre Dame). I want to thank Collette Mak and Jenn Matthews — PDC co-members — for their generous support in both time and energy. Thanks also go to our speakers with whom none of this would have been possible. “Thank you to one and all.”
2012-07-18T00:04:17+00:00 Water collection: Lourdes, France http://infomotions.com/water/index.xml?cmd=getwater&id=110 Map it |
On Saturday, March 31 I presented and attended a colloquium (E-Reading: A Colloquium at the University of Toronto) on the topic of e-reading, and I am documenting the experience because writing — the other half of reading — literally transcends space and time. In a sentence, my Toronto experience feed my body, my heart, and my mind.
Sponsored by a number of groups (The Collaborative Program in Book History and Print Culture, the Toronto Centre for the Book, the Toronto Review of Books, and Massey College) the event was divided into three sections: 1) E-Reader Response, 2) The Space of E-Texts, and 3) a keynote address.
Kim Martin (Western University) was honored with the privilege of giving the first presentation. It was originally entitled “Primary Versus Secondary Sources: The Use of Ebooks by Historians”, but sometime before the colloquium she changed the topic of her presentation to the process of serendipity. She advocated a process of serendipity articulated by Jacquelyn Burkell that includes a prepared mind, prior concern, previous experience or expertise, fortuitous outcome, and an act of noticing. [1] All of these elements are a part of the process of serendipitous find. She compared these ideas with the possibilities ebooks, and she asked a set of historians about serendipity. She discovered that there was some apprehension surrounding ebook reading, elements of traditional reading are seen as lost in ebooks, but despite this there was some degree ebook adoption by the historians.
I (Eric Lease Morgan, University of Notre Dame) gave a presentation originally entitled “Close and Distant Reading at Once and at the Same time: Using E-Readers in the Classroom”, but my title changed as well. It changed to “Summarizing the State of the Catholic Youth Literature Project“. In short, I summarized the project, described some of its features, and emphasized that “distant” reading is not a replacement — but rather a supplement — to the traditional close reading process.
Alex Willis (University of Toronto and Skeining Writing Solutions) then shared with the audience a presentation called “Fan Fiction and the Changing Landscape of Self-Publication”. Fan fiction is a type of writing that fills in gaps in popular literature. For example, it describes how the “warp core” of Star Trek space ships might be designed and work. Fan fiction may be the creation of story behind a online multi-player game. These things are usually written by very enthusiastic — “spirited” — players of the games. Sites like fanfiction.net and the works of Amanda Hocking are included as good examples of the genre. With the advent of this type of literature questions of copyright are raised, the economics of publishing are examined, and the underlying conventional notions of authority are scrutinized. Fan fiction is a product of a world where just about anybody and everybody can be a publisher. I was curious to know how fan fiction compares to open access publishing.
After a short break the second round of presentations began. It started with Andrea Stuart (University of Toronto) and “Read-Along Records: The Rise of Multimedia Modeling Reading”. Stuart presented on the history of read-along books, how they have changed over the years, and what they are becoming with the advent of e-readers. Apparently they began sometime after phonograph player were inexpensively produced and sold because this is when records started to be included in children’s books. They were marketed as time-savers to parents who were unable to read to their children as well as do household duties. She did a bit of compare & contrast of these read-along books and noticed how the stories narrated by men included all sorts of sound effects, but the narrations by woman did not. She then described how the current crop of ebooks are increasingly becoming like the read-along books of yesterday but with significant enhancements — buttons to push, questions to answer, and pages to turn. She then asked the question, “Are these enhancements liberating or limiting?” In the end I believe she thought they were a little bit of both.
“Commuter Reading and E-Reading” was the title of Emily Thompson‘s (University of Toronto) paper. This was a short history of a particular type of reading — reading that happens when people are commuting to and from their place of work. Apparently it began in France or England with the advent of commuting by train, “railway literature”, and “yellow backs” sold by a man named W.H. Smith. This literature was marketed as easy, comfortable, and enjoyable. They were sold in stalls and offered “limitless” choice. Later on the Penguin Books publisher started using the Penguinator — a vending machine — as a way of selling this same sort of literature. Thompson went on to compare the form & function of railway literature to the form & function of current cell phone and ebook readers. It was interesting to me to see how the form of the literature fit its function. Short, easy-to-ready chapters. Something that could be picked up, left off, and picked up again quickly. Something that wasn’t too studious and yet engaging. For example, the very short chapters books designed for cell phone sold in Japan. In the end Thompson described the advent of ebook readers as a moment in time for reading, not the death of the book. It was a refreshing perspective.
Brian Greenspan (Carlton University) then shared “Travel/Literature: Reading Locative Narrative”. While most of the presentations looked back in history, Greenspan’s was the only one that looked forward. In it he described a type of book designed to be read while walking around. “Books surpress optical input,” he said. By including geo-spacial technology into an ebook reader, different things happened in his narrative (a technology he called “StoryTrek”) depending on where a person was located. Readers of the narrative commented on the new type of reality they experienced through its use, specifically, they used the word “stimulating”. They felt less isolated during the reading process because when the saw things in their immediate location they brought them into the narrative.
The keynote address was given by Assistant Professor of Library & Information Science, Bonnie Mak (University of Illinois), and it was entitled “Reading the ‘E’ in E-Reading”. The presentation was a reflection on e-reading, specifically a reflection of the definition of a words on a page, and how different types of pages create different types of experiences. For example, think of the history for writing from marks in clay, to the use of was tablets, to the codex, to the e-reader. Think of the scroll of milleniums past, and think of scrolling on our electronic devices. Think of the annotation of mediaeval manuscripts, and compare that to the annotations we make on PDF documents. “What is old is new again… The material of books engender certain types of reading.” Even the catalogs and services of libraries are effected by this phenomenon. She used the example of Early English Books Online (EEBO), and how it is based on the two Short Title Catalogs (STC) — “seminal works of bibliographic scholarship that set out to define the printed record of the English-speaking world from the very beginnings of British printing in the late fifteenth century through to 1700.” Apparently the STC is incomplete in and of itself, and yet EEBO is touted as a complete collection of early English literature. And because EEBO is incomplete as well as rendered online in a particular format, it too lends itself to only a particular typer of reading. To paraphrase, “Reader, beware and be aware.”
As I mentioned above, my trip to Toronto fed my body, my heart, and my mind.
The day I arrived I visited with Michael Bramah, Noel Mcferran, Sian Meikle all of the University of Toronto. I got a 50¢ and private tour of the St. Michael’s College special collections including the entire library of the school when it was founded (the Soulerin Collection) as well as their entire collection of G.K. Chesterton and Cardinal John Henry Newman materials. It was then fun trying to find a popular reading item from their Ninetieth Century French Collection. More importantly, we all talked about the “Catholic Portal” and ways we could help make it go forward. That evening had a nice meal in a nice restaurant. All these things fed my body.
My heart was fed the next morning — the day of the colloquium — when I first went to one of the university’s libraries and autographed my WAIS And Gopher Servers book for the fourth or fifth time in the past dozen years. I went to the Art Gallery Of Ontario. There I saw a wall of Dufy’s paintings. I also experienced a curation of some paintings in the style of a Paris salon. This was echoed in the museum’s Canadian collection were similar paintings of similar classic styles were hung as in a salon. My heart soared as I was inspired. The Gallery’s collection and presentation style is to be applauded.
Finally, I fed my mind through the colloquium. Located in an academic atmosphere, we shared and discussed. We were all equals. Everybody had something to offer. There was no goal other than to stimulate our minds. Through the process I learned of my new and different types of reading:
My conception of reading was expanded. After the event many of us retired to a nearby pub where I met the author of a piece of iPad software called iAnnotate. He described the fluctuating and weaving way features to the PDF “standard” were created. Again, my ideas about reading were expanded. I need and require more of this type of stimulation. This trip was well worth the nine hour drive to Toronto and the twelve hour drive back.
2012-04-26T23:58:34+00:00 Life of a Librarian: Summarizing the state of the Catholic Youth Literature Project http://sites.nd.edu/emorgan/2012/03/cyl/This posting summarizes the purpose, process, and technical infrastructure behind the Catholic Youth Literature Project. In a few sentences, the purpose was two-fold: 1) to enable students to learn what it meant to be Catholic during the 19th century, and 2) to teach students the value of reading “closely” as well as from a “distance”. The process of implementing the Project required the time and skills of a diverse set of individuals. The technical infrastructure is built on a large set of open source software, and the interface is far from perfect.
The purpose of the project was two-fold: 1) to enable students to learn what it meant to be Catholic during the 19th century, and 2) to teach students the value of reading “closely” as well as from a “distance”. To accomplish this goal a faculty member here at the University of Notre Dame (Sean O’Brien) sought to amass a corpus of materials written for Catholic youth during the 19th century. This corpus was expected to be accessible via tablet-based devices and provide a means for “reading” the texts in the traditional manner as well as through various text mining interfaces.
During the Spring Semester students in a survey class were lent Android-based tablet computers. For a few weeks of the semester these same students were expected to select one or two texts from the amassed corpus for study. Specifically, they were expected to read the texts in the traditional manner (but on the tablet computer), and they were expected to “read” the texts through a set of text mining interfaces. In the end the the students were to outline three things: 1) what did you learn by reading the text in the traditional way, 2) what did you learn by reading the text through text mining, and 3) what did you learn by using both interfaces at once and at the same time.
Alas, the Spring semester has yet to be completed, and consequently what the students learned has yet to be determined.
The process of implementing the Project required the time and skills of a diverse set of individuals. These individuals included the instructor (Sean O’Brien), two collection development librarians (Aedin Clements and Jean McManus), and librarian who could write computer programs (myself, Eric Lease Morgan).
As outlined above, O’Brien outlined the overall scope of the Project.
Clements and McManus provided the means of amassing the Project’s corpus. A couple of bibliographies of Catholic youth literature were identified. Searches were done against the University of Notre Dame’s library catalog. O’Brien suggested a few titles. From these lists items were selected for inclusion for purchase, from the University library’s collection, as well as from the Internet Archive. The items for purchase were acquired. The items from the local collection were retrieved. And both sets of these items were sent off for digitization and optical character recognition. The results of the digitization process were then saved on a local Web server. At the same time, the items identified from the Internet Archive were mirrored locally and saved in the same Web space. About one hundred items items were selected in all, and they can be seen as a set of PDF files. This process took about two months to complete.
The Project’s technical infrastructure enables “close” and “distant” reading, but the interface is far from perfect.
From the reader’s (I don’t use the word “user” anymore) point of view, the Project is implemented through a set of Web pages. Behind the scenes, the Project is implemented with an almost dizzying array of free and open source software. The most significant processes implementing the Project are listed and briefly described below:
The result — the Catholic Youth Literature Project — is a system that enables the reader to view the texts online as well as do some analysis against them. The system functions in that it does not output invalid data, and it does provide enhanced access to the texts.
The home page is simply a list of covers and associated titles.
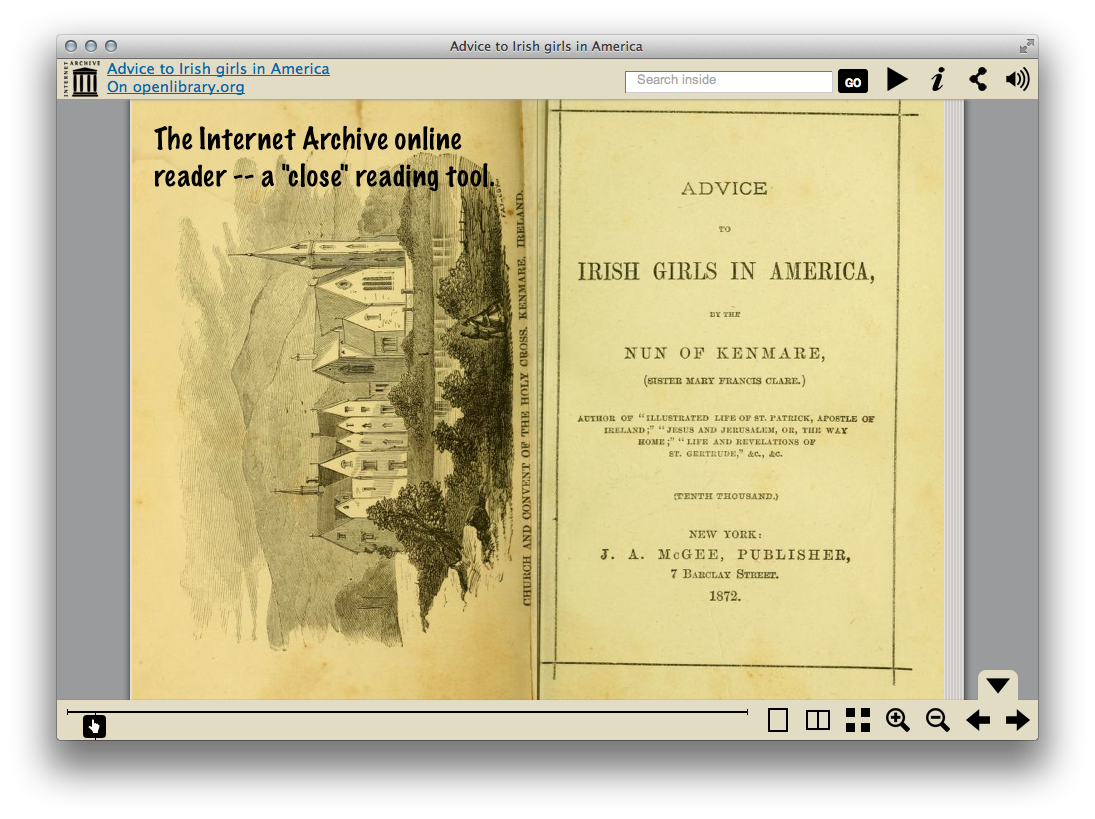
The Internet Archive online reader is one option for “close” reading.

The list of parts-of-speech provides the reader with some context. Notice how the word “good” is the most frequently used adjective.
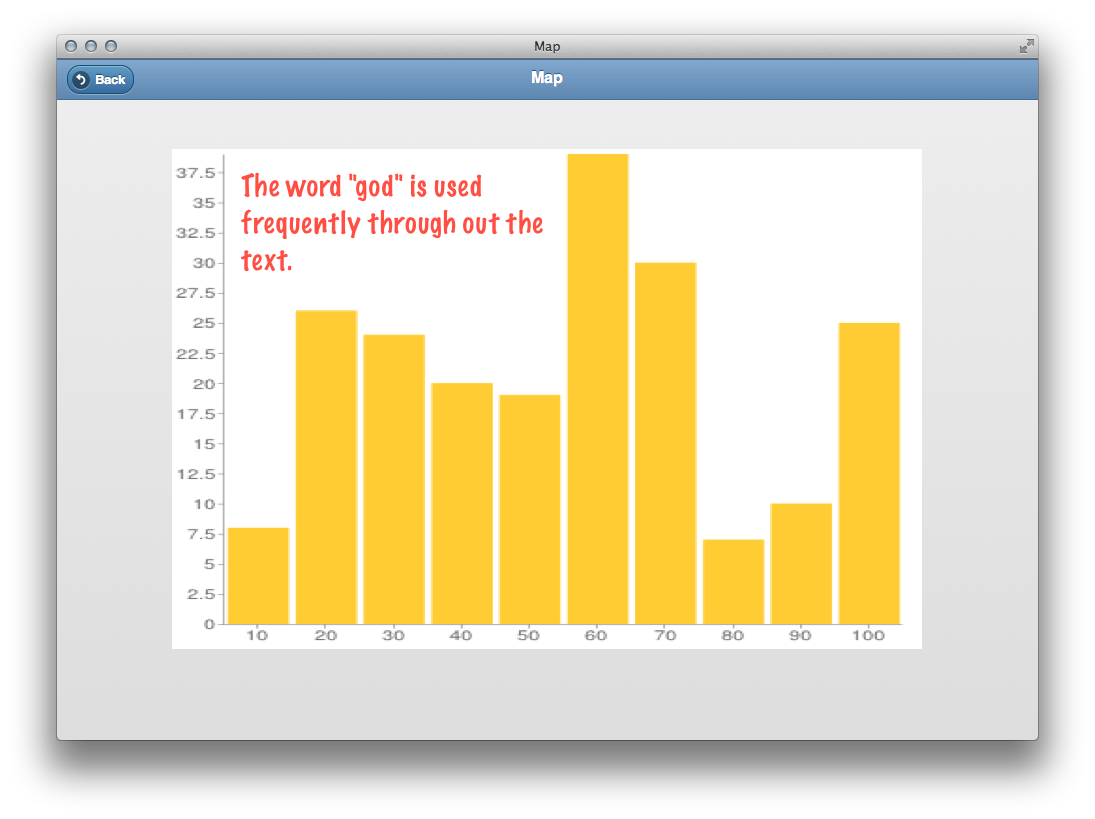
The histogram feature of the concordance allows the reader to see where selected words appear in the text. For example, in this text the word “god” is used rather consistently.
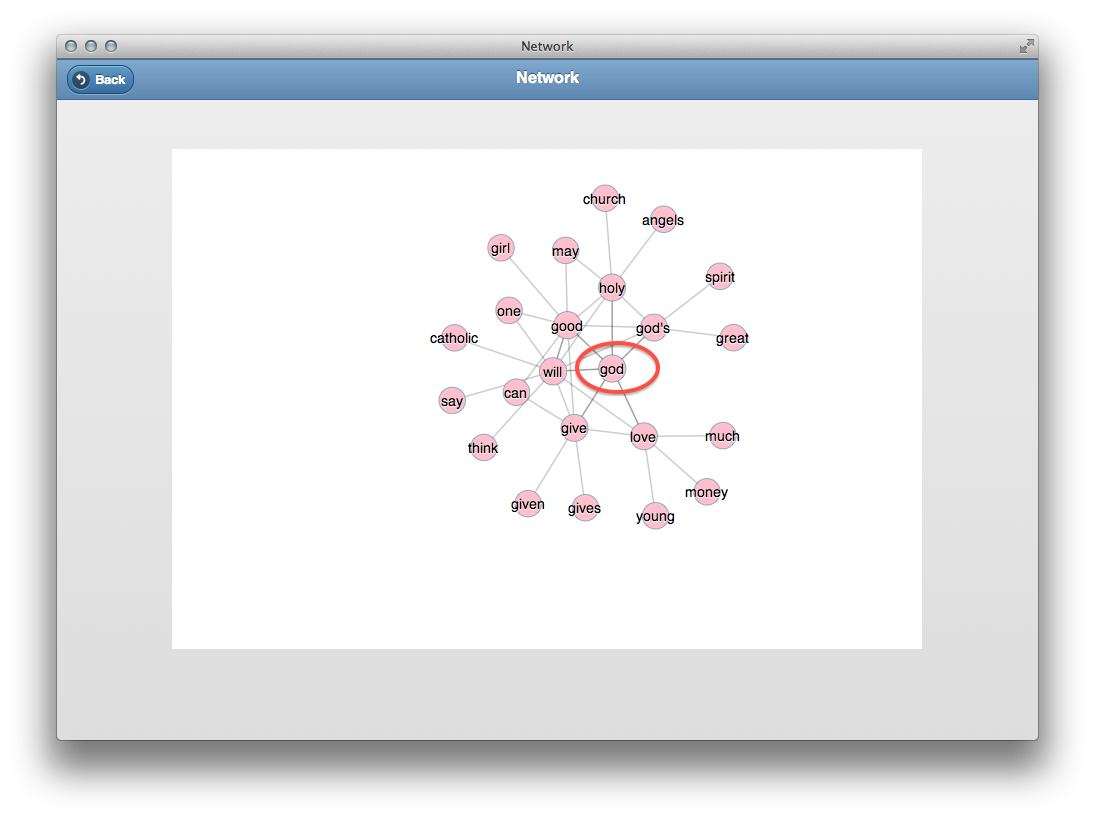
A network diagram allows the reader to see what words are used “in the same breath” as a given word. Here the word “god” is frequently used in conjunction with “good”, “holy”, “give”, and “love”.
To summarize, the Catholic Youth Literature Project is far from complete. For example, it has yet to be determined whether or not the implementation has enabled students to accomplish the Project’s stated goals. Does it really enhance the use and understanding of a text? Second, the process of selecting, acquiring, digitizing, and integrating the texts into the library’s collection is not streamlined. Finally, usability of the implementation is still in question. On the other hand, the implementation is more than a prototype and does exemplify how the process of reading is evolving over time.
2012-03-30T01:43:18+00:00 Life of a Librarian: Summary of the Catholic Pamphlets Project http://sites.nd.edu/emorgan/2012/03/pamphlets/This posting summarizes the Catholic Pamphlets Project — a process to digitize sets of materials from the Hesburgh Libraries collection, add the result to a repository, provide access to the materials through the catalog and “discovery system” as well as provide enhanced access to the materials through a set of text mining interfaces. In a sentence, the Project has accomplished most of its initial goals both on time and under budget.
The Catholic Pamphlets Project began early in 2011 with the writing of a President’s Circle Award proposal. The proposal detailed how sets of Catholic Americana would be digitized in conjunction with the University Archives. The Libraries was to digitize the 5,000 Catholic pamphlets located in Special Collections, and the Archives was to digitize its set of Orestes Brownson papers. In addition, a graduate student was to be hired to evaluate both collections, write introductory essays describing why they are significant research opportunities, and do an environmental scan regarding the use of digital humanities computing techniques applied against digitized content. In the end, both the Libraries and the Archives would have provided digital access to the materials through things like the library catalog, its “discovery” system, and the “Catholic Portal”, as well as laid the groundwork for further digitization efforts.
By late Spring a Project leader was identified, and their responsibilities were to coordinate the Libraries’s side of the Project in conjunction with a number of library departments including Special Collections, Cataloging, Electronic Resources, Preservation, and Systems. By this time it was also decided not to digitize the entire collection of 5,000 items, but instead hire someone for the summer to digitize as many items as possible and process them accordingly – a workflow test. In the meantime, a comparison of in-house and vendor-supplied digitization costs would be evaluated.
By this time a list of specific people had also been identified to work on the Project, and these people became affectionately known as Team Catholic Pamphlets:
Aaron Bales • Eric Lease Morgan (leader) • Jean McManus • Julie Arnott • Lisa Stienbarger • Louis Jordan • Mark Dehmlow • Mary McKeown • Natasha Lyandres • Rajesh Balekai • Rick Johnson • Robert Fox • Sherri Jones
Through out the summer a lot of manual labor was applied against the Project. A recent graduate from St. Mary’s (Eileen Laskowski) was hired to scan pamphlets. After a one or two weeks of work, she was relocated from the Hesburgh Library to the Art Slide Library where others were doing similar work. She used equipment borrowed from Desktop Computing and Network Services (DCNS) and the Slide Library. Both DCNS and the Slide Library were gracious about offering their resources. By the end of the summer Ms. Laskowski had digitized just less than 400 pamphlets. The covers were digitized in 24-bit color. The inside pages were gray-scale. Everything was digitized at 600 dots per inch. These pamphlets generated close to 92 GB of data in the form of TIFF and PDF files.
Because the Pamphlets Project was going to include links to concordance (text mining) interfaces from within the library’s catalog, Sherri Jones facilitated two hour-long workshops to interested library faculty and staff in order to explain and describe the interfaces. The first of these workshops took place in the early summer. The second took place in late summer.
In the meantime efforts were spent by two summer students of Jean McManus‘s. The students determined the copyright status of each of the 5,000 pamphlets. They used a decision-making flowchart as the basis of their work. This flowchart has since been reviewed by the University’s General Counsel and deemed a valid tool for determining copyright. Of the sum of pamphlets, approximately 4,000 (80%) have been determined to be in the public domain.
Starting around June Team Catholic Pamphlets decided to practice with the technical services aspect of the Project. Mary McKeown, Natasha Lyandres, and Lisa Stienbarger wrote a cataloging policy for the soon-to-be created MARC records representing the digital versions of the pamphlets. Aaron Bales exported MARC records representing the print versions of the pamphlets. PDF versions of approximately thirty-five pamphlets were placed on a Libraries’s Web server by Rajesh Balekai and Rob Fox. Plain text versions of the same pamphlets were placed on a different Web server, and a concordance application was configured against them. Using the content of the copyright database being maintained by Jean McManus’s students, Eric Lease Morgan updated the MARC records representing the print records to include links to the PDF and concordance versions of the pamphlets. The records were passed along to Lisa Stienbarger who updated them according to the newly created policy. The records were then loaded into a pre-production version of the catalog for verification. Upon examination the Team learned that users of Internet Explorer were not able to consistently view the PDF versions. After some troubleshooting, Rob Fox wrote a work-around to the problem, and the MARC records were changed to reflect new URLs of the PDF versions. Once this work was done the thirty-five records were loaded into the production version of the catalog, and from there they seamlessly flowed into the library’s “discovery system” – Primo. Throughout this time Julie Arnott and Dorothy Snyder applied quality control measures against the digitized content and wrote a report documenting their findings. Team Catholic Portal had successfully digitized and processed thirty-five pamphlets.
With these successes under our belts, and with the academic year commencing, Team Catholic Pamphlets celebrated with a pot-luck lunch and rested for a few weeks.
In early October the Team got together again and unanimously decided to process the balance of the digitized pamphlets in order to put them into production. Everybody wanted to continue practicing with their established workflows. The PDF and plain text versions of the pamphlets were saved on their respective Web servers. The TIFF versions of the pamphlets were saved to the same file system as the library’s digital repository. URLs were generated. The MARC records were updated and saved to pre-production. After verification, they were moved to production and flowed to Primo. What took at least three months earlier in the year now took only a few weeks. By Halloween Team Catholic Pamphlets finished its workflow test processing the totality of the digitized pamphlets.
There is no single home page for the collection of digitized pamphlets. Instead, each of the pamphlets have been cataloged, and through the use of command-line search strategy one can pull up all the pamphlets in the library’s catalog — http://bit.ly/sw1JH8
From the results list it is best to view the records’ detail in order to see all of the options associated with the pamphlet.

command-line search results page
From the details page one can download and read the pamphlet in the form of a PDF document or the reader can use a concordance to apply “distant reading” techniques against the content.
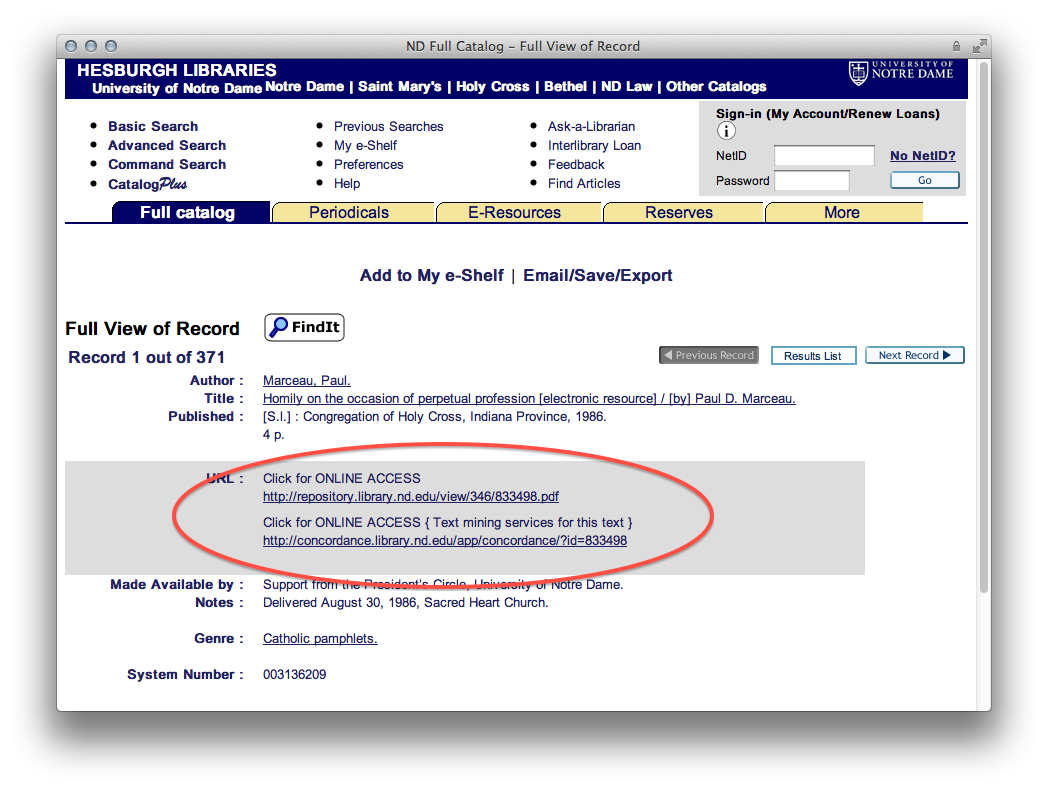
details of a specific Catholic pamphlets record
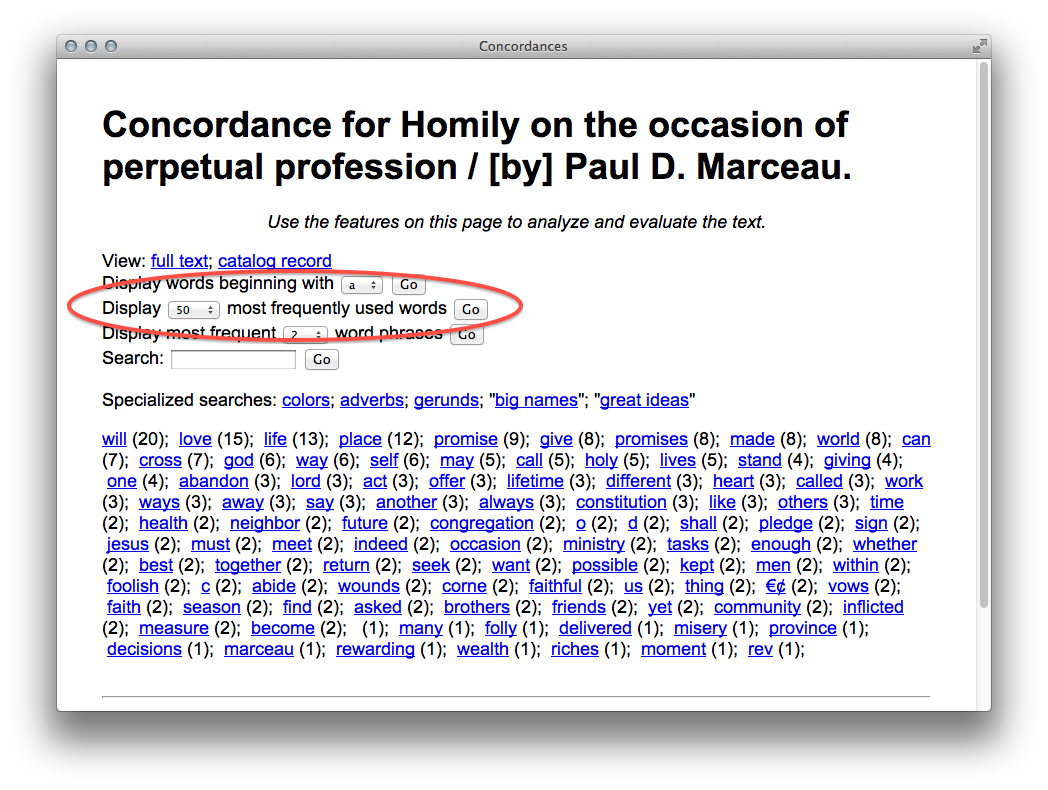
50 most frequently used words in a selected pamphlet
The Team accomplished most of its goals, and we learned many things, but not everything was accomplished. No graduate student was hired, and therefore no overarching description of the pamphlets (nor content from the Archives) was evaluated. Similarly, no environmental scan regarding use of digital humanities against the collections was done. While 400 of our pamphlets are accessible from the catalog as well as the “discovery system”, no testing has been done to determine their ultimate usability.
The fledgling workflow can still be refined. For example, the process of identifying content to digitize, removing it from Special Collections, digitizing it, returning it to Special Collections, doing quality control, adding the content to the institutional repository, establishing the text mining interfaces, updating the MARC records (with copyright information, URLs, etc.), and ultimately putting the lot into the catalog is a bit disjointed. Each part works well unto itself, but the process as a whole does not run like a well-oiled machine, yet. Like any new workflow, more practice is required.
This Project provided Team members with the opportunity to apply traditional library skills against a new initiative, and it was relished by everybody involved. The Project required the expertise of faculty and staff. It required the expertise of people in Collection Management, Preservation, Technical Services, Public Services, and Systems. Everybody applied their highly developed professional knowledge to a new and challenging problem. The Project was a cross-departmental holistic process, and it even generated interest in participation from people outside the Team. There are many people across the Libraries who would like to get involved with wider digitization efforts because they thought this Project was exciting and had the potential for future growth. They too see it as an opportunity for professional development.
While there are 5,000 pamphlets in the collection, only 4,000 of them are deemed in the public domain (legally digitizable). Four-hundred (400) pamphlets were scanned by a single person at a resolution of 600 dots/inch over a period of three months for a total cost of approximately $3,400. This is a digitization rate of approximately 1,200 pamphlets per year at a cost of $13,600. At this pace it would take the Libraries close to 3 1/3 years to digitized the 4,000 pamphlets for an approximate out-of-pocket labor cost of $44,880. If the dots/inch qualification were reduced by half – which still exceeds the needs for quality printing purposes – then it would take a single person approximately 1.7 years to do the digitization at a total cost of approximately $22,440. The time spent doing digitization could be reduced even further if the dots/inch qualification were reduced some more. One hundred fifty dots/inch is usually good enough for printing purposes. Based on our knowledge, it would cost less than $3,000 to purchase three or four computer/scanning set-ups similar to the ones used during the Project. If the Libraries were to hire as many as four students to do digitization, then we estimate the public domain pamphlets could be digitized in less than two years at a cost of approximately $25,000.
There are approximately 184,996 pages of Catholic pamphlet content, but approximately 80% of these pages (4,000 pamphlets of the total 5,000) are legally digitizable – 147,997 pages. A reputable digitization vendor will charge around $.25/page to do digitization. Consequently, the total out-of-pocket cost of using the vendor is close to $37,000.
Team Catholic Pamphlets recommends going forward with the Project using an in-house digitization process. Despite the administrative overhead associated with hiring and managing sets of digitizers, the in-house process affords the Libraries a means to learn and practice with digitization. The results will make the Libraries more informed and better educated and thus empower us to make higher quality decisions in the future.
2012-03-27T01:24:29+00:00 Life of a Librarian: Patron-Driven Acquisitions: A Symposium at the University of Notre Dame http://sites.nd.edu/emorgan/2012/03/pda/The Professional Development Committee at the Hesburgh Libraries of the University of Notre Dame is sponsoring a symposium on the topic of patron-driven acquisitions:
After lunch and given enough interest, we will also be facilitating roundtable discussions on the topic of the day. To register, simply send your name to Eric Lease Morgan, and you will be registered. Easy!
Need a map? Download a campus map highlighting where to park and the location of the library.
Here is a list of the presentations to get the discussion going:
Here is a list of the speakers, their titles, and the briefest of bios:
 Robert S. Freeman (Associate Professor of Library Science, Reference, Languages and Literatures Librarian) – Robert S. Freeman has worked at Purdue University since 1997, where he is a reference librarian and the liaison to the Department of English as well as the School of Languages and Cultures. He has an M.A. in German from UNC-Chapel Hill and an M.S. in Library and Information Science from University of Illinois at Urbana-Champaign. Interested in the history of libraries, he co-edited and contributed to Libraries to the People: Histories of Outreach (McFarland, 2003). More recently, he co-edited a special issue of Collection Management on PDA.
  Dracine Hodges (Head, Acquisitions Department) – Dracine Hodges is Head of the Acquisitions Department at The Ohio State University Libraries. Previously, she was the Monographs Librarian and the Mary P. Key Resident Librarian. She received her BA from Wesleyan College and MLIS from Florida State University. She manages the procurement of print and electronic resources for the OSU Libraries. Most of her career has focused on acquisitions, but she has also worked as a reference librarian and in access services. Dracine is active in ALCTS serving on the Membership Committee and as past chair of the Tech Services Workflow Efficiency Interest Group. She is also an editorial assistant for College & Research Libraries and a graduate of the Minnesota Institute.
 Judith M. Nixon (Professor of Library Science and Education Librarian) – Judith M. Nixon holds degrees from Valparaiso University and University of Iowa. She has worked at Purdue University since 1984 as head of the Consumer & Family Sciences Library, the Management & Economics Library, and the Humanities & Social Science Library. Currently, as Education Librarian, she develops the education collections. Her publishing record includes over 35 articles and books. Her interest in patron-driven acquisitions lead to co-editing a special issue of Collection Management that focuses on this topic and a presentation at La Biblioteca Del Futuro in Mexico City in October of 2001.
 Suzanne M. Ward (Professor of Library Science and Head, Collection Management) – Suzanne (Sue) Ward holds degrees from UCLA, the University of Michigan, and Memphis State University. She has worked at the Purdue University Libraries since 1987 in several different positions. Her current role is Head, Collection Management. Professional interests include patron-driven acquisitions (PDA) and print retention issues. Sue has published one book and over 25 articles on various aspects of librarianship. She recently co-edited a special issue of Collection Management that focuses on PDA, and her book Guide to Patron-Driven Acquisitions is in press at the American Library Association.
  Lynn Wiley (Head of Acquisitions and Associate professor of Library Administration) – Lynn Wiley has been a librarian for over thirty years working for academic libraries in the east coast and since 1995 at the University of Illinois. Lynn has worked in public service roles until 2005 when she switched to acquisitions. She has written and presented widely on meeting user needs and provided analysis on how library partnerships can best achieve this. She is active in state, regional and national professional associations and is also on the editorial board of LRTS. Her overall goal is to meet the needs of users easily and seamlessly.
A report entitled “The Value and Benefits of Text Mining” was published today by the folks at JISC, and some items of interest from the conclusion include:
The full report is available at http://bit.ly/jisc-textm.
2012-03-14T12:53:51+00:00 DH @ Notre Dame: Hello, World http://dh.crc.nd.edu/blog/2012/03/hello/It is nice to meet you.
2012-03-13T17:48:30+00:00 Readings: Users, narcissism and control – tracking the impact of scholarly publications in the 21st century http://www.surffoundation.nl/nl/publicaties/Documents/Users%20narcissism%20and%20control.pdf Lists and evaluates a number of tools for measuring the quality of journal articles, but in the end says none of them are very good yet. "The report concludes that web based academic publishing is producing a variety of novel information filters. These allow the researcher to make some sort of limited self-assessment with respect to the response to his/her work. However, this does not mean that these technologies and databases can also legitimately be used in research assessments. For this application, they need to adhere to a far stricter protocol of data quality and indicator reliability and validity. Most new tools do not (yet) comply with these more strict quality criteria....Bearing all these problems in mind, it is important that the developers of these new tools realise that being mainly providers of indicators for individuals could ‘trivialise’ their image among scholars and managers as only providing ‘technologies of narcissism’, thus jeopardising their real potential value as strong and standardised assessment tools. For all this, their evolution and transformation from ‘technologies of narcissism’ to ‘technologies of control’ may contribute to their broader acceptance among the scientific community."This is sort of like a travelogue — a description of what I learned by attending a workshop here at Notre Dame on the topic of emotional intelligence. In a sentence, emotional intelligence begins with self-awareness, moves through self-management to control impulses, continues with social awareness and the ability to sense the emotions of others, and matures with relationship management used to inspire and manage conflict.
The purpose of the workshop — attended by approximately thirty people and sponsored by the University’s Human Resources Department — was to make attendees more aware of how they can build workplace relationships by being more emotionally intelligent.
The workshop’s facilitator began by outlining The Rule Of 24. Meaning, when a person is in an emotionally charged situation, then wait twenty-four hours before attempting resolution. If, after twenty-four hours ask yourself, “How do I feel?” If the answer is anxious, then repeat. If not, approach the other person with a structured script. In other words, practice what you hope to communicate. If an immediate solution is necessary or when actually having the difficult conversation, then remember a few points:
When having a difficult conversation, try prefacing it with some like this. “I am going to tell you something, and it is not my intent to make you feel poorly. It is difficult for me as well.” Clarify this in the beginning as well as at the end of the conversation.
The facilitator also outlined a process for learning emotional intelligence:
There were quite a number of interesting quotes I garnered from the facilitator:
There were a number of other people from the Libraries who attended the workshop, and most of us gathered around a table afterwards to discuss what we learned. I think it would behoove the balance of the Libraries be more aware of emotional intelligence issues.
Much of the workshop was about controlling and managing emotions as if they were things to be tamed. In the end I wanted to know when and how emotions could be encouraged or even indulged for the purposes of experiencing beauty, love, or spirituality. But alas, the workshop was about the workplace and relationship building.
This is posting about TriLUG, open source software, and satisfaction for doing a job well-done.
A long time ago, in a galaxy far far away, I lived in Raleigh (North Carolina), and a fledgling community was growing called the Triangle Linux User’s Group (TriLUG). I participated in a few of their meetings. While I was interested in open source software, I was not so interested in Linux. My interests were more along the lines of the application stack, not necessarily systems administration nor Internet networking.
I gave a presentation to the User’s Group on the combined use of PHP and MySQL — “Smart HTML pages with PHP“. Because of this I was recruited to write a Web-based membership application. Since flattery will get you everywhere with me, I was happy to do it. After a couple of weeks, the application was put into place and seemed to function correctly. That was a bit more than ten years ago, probably during the Spring of 2001.
The other day I got an automated email message from the User’s Group. The author of the message wanted to know if I wanted to continue my membership? I replied how that was not necessary since I had long since moved away to northern Indiana.
I then got to wondering whether or not the message I received had been sent by my application. It was a long shot, but I enquired anyway. Sure enough, I got a response from Jeff Schornick, a TriLUG board member, who told me “Yes, your application was the tool that had been used.” How satisfying! How wonderful to know that something I wrote more than ten years ago was still working.
Just as importantly, Jeff wanted to know about open source licensing. I had not explicitly licensed the software, something that I only learned was necessary from Dan Chudnov later. After a bit of back and forth, the original source code was supplemented with the GNU Public License, packaged up, and distributed from a Git repository. Over the years the User’s Group had modified it to overcome a few usability issues, and they wanted to distribute the source code using the most legitimate means possible.
This experience was extremely enriching. I originally offered my skills, and they returned benefits to the community greater than the expense of my time. The community then came back to me because they wanted to express their appreciation and give credit where credit was due.
Open source software not necessarily about computer technology. It is just as much, if not more, about people and the communities they form.
2011-12-09T15:46:47+00:00 Readings: Institutional Repositories, Open Access, and Scholarly Communication: A Study of Conflicting Paradigms http://www.sciencedirect.com/science/article/pii/S009913331100156X A scholarly and well-written article describing the current state of institutional repositories. Includes an extensive literature review, and statistical survey used to determine how and why scholars of New Zealand deposit content or not. The conclusion is open access institutional repositories and traditional scholarly communications process will live hand in hand. They are complementary because the provide similar but different services/functions.Team Catholic Pamphlets has finished digitizing, processing, and making available close to 400 pieces of material available in the Aleph as well as Primo — http://bit.ly/sw1JH8
More specifically, we had a a set of Catholic pamphlets located in Special Collections converted into TIFF and PDF files. We then had OCR (optical character recognition) done against them, and the result was saved on a few local computers — parts of our repository. We then copied and enhanced the existing MARC records describing the pamphlets, and we ingested them into Aleph. From there they flowed to Primo.
When search results are returned for Catholic Pamphlet items, the reader is given the opportunity to download the PDF version and/or apply text mining services against them in order to enhance the process of understanding. For example, here are links to a specific catalog record, the pamphlet’s PDF version, and text mining interface:
Our next step is two-fold. First, we will document our experience and what we learned. Second, we will share this documentation with the wider audience. We hope to complete these last two tasks before we go home for the Christmas Holiday. Wish us luck.
2011-11-11T21:57:02+00:00 Life of a Librarian: Field trip to the Mansueto Library at the University of Chicago http://sites.nd.edu/emorgan/2011/11/mansueto/On Wednesday, October 19, 2011 the Hesburgh Libraries Professional Development Committee organized a field trip to the Mansueto Library at the University of Chicago. This posting documents some of my things seen, heard, and learned. If I had one take-away, it was the fact that the initiatives of the libraries at the University of Chicago are driven by clearly articulated needs/desires of their university faculty.
The adventure began early in the morning as a bunch of us from the Hesburgh Libraries (Collette Mak, David Sullivan, Julie Arnott, Kenneth Kinslow, Mandy Havert, Marsha Stevenson, Rick Johnson, and myself) boarded the South Shore train bound for Chicago. Getting off at 57th Street, we walked a few short blocks to the University, and arrived at 10:45. The process was painless, if not easy and inexpensive.
David Larsen (our host) greeted us at the door, gave us the opportunity to put our things down, and immediately introduced us to David Borycz who gave us a tour of the Mansueto Library. If my memory serves me correctly, a need for an additional university library was articulated about ten years ago. Plans were drafted and money allocated. As time went on the need for more money — almost double — was projected. That was when Mr. & Mrs. Mansueto stepped up to the plate and offered the balance. With its dome made of uniquely shaped glass parts and eyeball shape, the Library looks like a cross between the Louvre Pyramid (Paris) and the Hemisfèric in Valencia (Spain). The library itself serves three functions: 1) reading room, 2) book storage, and 3) combination digitization & conservation lab. For such a beautiful and interesting space, I was surprised the later function was included in the mix which occupied almost half of the above ground space.


The reading room was certainly an inviting space. Long tables complete with lights. Quiet. Peaceful. Inviting. Contemplative.
The back half of the ground-level was occupied by both a digitization and conservation lab. Lots of scanners including big, small, and huge. Their scanning space is not a public space. There were no students, staff, nor faculty digitizing things there. Instead, their scanning lab began as a preservation service, grew from there, and now digitizes things after being vetted through a committee prioritizing projects. The conservation lab was complete with large tables, de-acidification baths, and hydration chambers. Spacious. Well-equipped. Located in a wonderful place.
Borycz then took us down to see the storage area. Five stories deep, this space is similar to the storage space at Valparaiso University. Each book is assigned a unique identifier. Books are sorted by size and put into large metal bins (also assigned a unique number). The identifiers are then saved in a database denoting the location in the cavernous space below. One of the three elevators/lifts then transport the big metal boxes to their permanent locations. The whole space will hold about 3.5 million volumes (the entire collection of the Hesburgh Libraries), but at the present time there are only 900,000 volumes currently stored there. How did they decide what would go to the storage area? Things that need not be browsed (like runs of bound serial volumes), things that are well-indexed, things that have been digitized, and “elephant” folios.
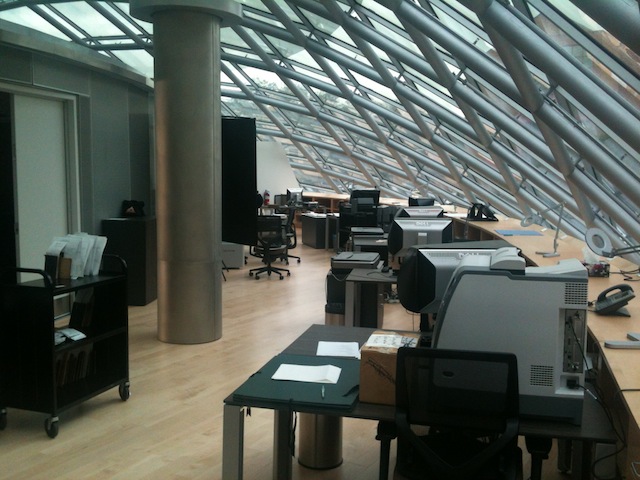
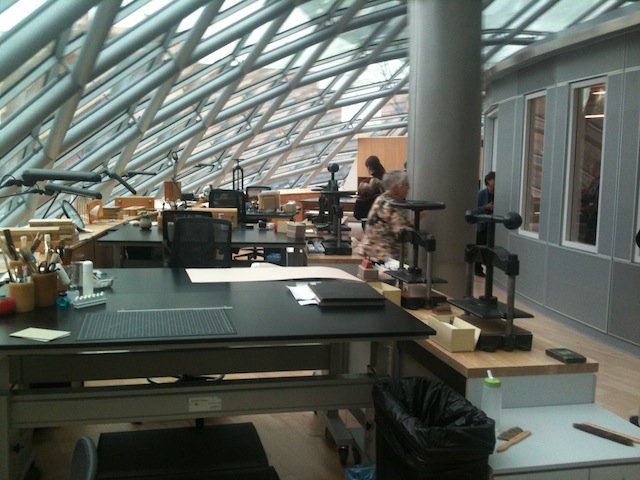
When we returned from lunch our respective libraries did bits of show & tell. I shared about the Hesburgh Libraries efforts to digitize Catholic pamphlets and provide text mining interfaces against the result. Rick Johnson demonstrated the state of the Seaside Project. We were then shown the process the University of Chicago librarians were using to evaluate the EBSCOhost “discovery service”. An interface was implemented, but the library is not sure exactly what content is being indexed, and the indexed items’ metadata seems applied inconsistently. Moreover, it is difficult (if not impossible) to customize the way search results are ranked and prioritized. All is not lost. The index does include the totality of JSTOR, which is seen as a plus. Librarians have also discovered that the index does meet the needs of many library patrons. The library staff have also enhanced other library interfaces pointing them to the EBSCO service if patrons browse past two or three pages of search results. When show & tell was finished we broke into smaller groups for specific discussions, and I visited the folks in the digitization unit. We then congregated in the lobby, made our way back to the train, and returned to South Bend by 7:30 in the evening.
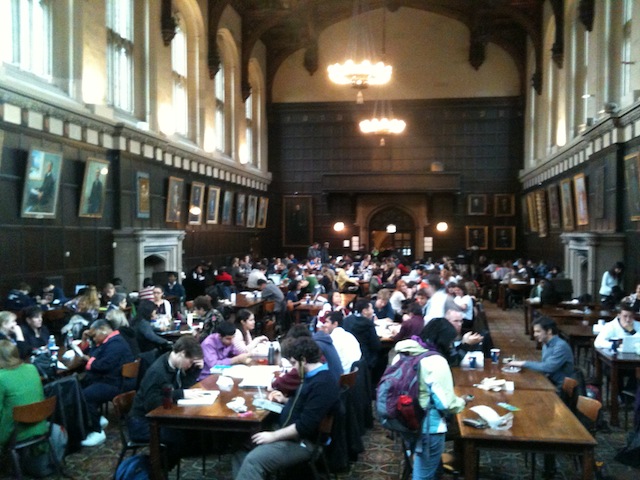
The field trip was an unqualified success. It was fun, easy, educational, team-building, inexpensive, collegial, and enlightening. Throughout the experience we heard over and over again how directives were taken by University of Chicago faculty on new directions. These faculty then advocated for the library, priorities were set, and goals were fulfilled. The Hesburgh Libraries at the University of Notre Dame is geographically isolated. In my opinion we must make more concerted efforts to both visit other libraries and bring other librarians to Notre Dame. Such experiences enrich us all.
2011-11-02T00:05:29+00:00 Life of a Librarian: Scholarly publishing presentations http://sites.nd.edu/emorgan/2011/11/scholarly-publishing-presentations/As a part of Open Access Week, a number of us (Cheri Smith, Collette Mak, Parker Ladwig, and myself) organized a set of presentations on the topic of scholarly publishing with the goal of increasing awareness of the issues across the Hesburgh Libraries. This posting outlines the event which took place on Thursday, October 27, 2011.
The first presentation was given by Kasturi Halder (Julius Nieuwland Professor of Biological Sciences and Founding Director of the Center for Rare and Neglected Diseases) who described her experience working with the Public Library of Science (PLoS). Specifically, Halder is the editor-in-chief of PLoS Pathogens with a total editorial staff of close to 140 persons. The journal receives about 200 submissions per month, and her efforts require approximately one hour of time per day. She describes the journal as if it were a community, and she says one of the biggest problems they have right now is internationalization. Halder was a strong advocate for open access publishing. “It is important to make the content available because the research is useful all over the world… When the content is free it can be used in any number of additional ways including text mining and course packs… Besides, the research is government funded and ought to be given back to the public… Patients should have access to articles.” Halder lauded PLoS One, a journal which accepts anything as long as it has been peer-reviewed, and she cited an article co-written by as many as sixty-four students here at Notre Dame as an example. Finally, Halder advocated article-level impact as opposed to journal-level impact as a measure of success.
Anthony Holter (Assistant Professional Specialist in the Mary Ann Remick Leadership Program, Institute for Educational Initiatives) outlined how Catholic Education has migrated from a more traditional scholarly publication to something that stretches the definition of a journal. Started in 1997 as a print journal, Catholic Education was sponsored and supported by four institutions of higher education, each paying an annual fee. The purpose of the journal was (and still is) to “promote and disseminate scholarship about the purposes, practices, and issues in Catholic education at all levels.” Over time the number of sponsors grew and eventually faced two problems. First, they realized that libraries were paying twice for the content. Once for the membership fee and again for a subscription. Second, many practitioners appreciated the journal when they were in school, but as they graduated they no longer had access to it. What to do? The solution was to go open access. The journal is now hosted at Boston College. In this new venue Holter has more access to usage statistics than he has ever had before making it easier for him to track trends. For example, he saw many searches on topics of leadership, and consequently, he anticipates a special issue on leadership in the near future. Finally, Holter also sees the journal akin to a community, and the editorial board plans to exploit social networks to a greater degree in an effort to make the community more interactive. “We are trying to create a rich tapestry of a journal.” For the time being, Project Euclid fits the bill.
Finally Peter Cholak (Professor of Mathematics, College of Science) put words to characteristics of useful scholarly journals and used the Notre Dame Journal of Formal Logic as an example. Cholak looks to journals to add value to scholarly research. He does not want to pay any sort of page or image charges (which are sometimes the case in open access publications). Cholak looks for author-friendly copyright agreements from publishers. This is the case because his community is expected (more or less) to submit their soon-to-be-published articles in a repository called MathSciNet. He uses MathSciNet as both a dissemination and access tool. A few years ago the Notre Dame Journal of Formal Logic needed a new home, and Cholak visited many people across the Notre Dame campus looking for ways to make is sustainable. (I remember him coming to the libraries, for example.) He found little, if any, support. Sustainability is a major issue. “Who is going to pay? Creation, peer-review, and dissemination all require time and money?” Project Euclid fits the bill.
The presentations were well-received by the audience of about twenty people. Most were from the Libraries but others were from across the University. It was interesting to compare & contrast the disciplines. One was theoretical. Another was empirical. The third was both academic and practical at once and at the same time. There was lively discussion after the formal presentations. Such was the goal. I sincerely believe each of the presenters have more things in common than differences when it comes to scholarly communication. At the same time they represented a wide spectrum of publishing models. This spectrum is the result of the current economic and technological environment, and the challenge is to see the forest from the trees. The challenge for libraries is to understand the wider perspectives and implement solutions satisfying the needs of most people given limited amounts of resources. In few places is this more acute than in the realm of scholarly communication.
A number of us got together today, and we had nice time doing show & tell as well as discussing “tablet-based ‘reading'”. We included:
Elliot demonstrated iPad Shakespeare while Charles and Markus filled in the gaps when it came to the technology. Sean and I did the same thing when it came to the Catholic Youth Literature Project. Some points during the discussion included but were not limited to:
Fun in academia and the digital humanities.
2011-10-15T01:52:09+00:00 Life of a Librarian: Big Tent Digital Humanities Meeting http://sites.nd.edu/emorgan/2011/10/big-tent-digital-humanities-meeting/Well, it wasn’t really a “Big Tent Digital Meeting”, but more like a grilled cheese lunch. No matter what it was, a number of “digital humanists” fro across campus got together, learned a few new faces, and shared our experiences. We are building community.
The Catholic Pamphlets Project has past its first milestone, specifically, practicing with its workflow which included digitizing and making accessible thirty-ish pamphlets in the Libraries’s catalog, “discovery system”, and implementing a text mining interface. This blog posting describes this success in greater detail.
For the past four months or so a growing number of us have been working on a thing affectionately called the Catholic Pamphlets Project. To one degree or another, these people have included:
Aaron Bales • Adam Heet • Denise Massa • Eileen Laskowski • Jean McManus • Julie Arnott • Lisa Stienbarger • Lou Jordan • Mark Dehmlow • Mary McKeown • Natalia Lyandres • Pat Lawton • Rejesh Balekai • Rick Johnson • Robert Fox • Sherri Jones
Our long-term goal is to digitize the set of 5,000 locally held Catholic pamphlets, save them in the library’s repository, update the catalog and “discovery system” (Primo) to include links to digital versions of the content, and provide rudimentary text mining services against the lot. The short-term goal is/was to apply these processes to 30 of the 5,000 pamphlets. And I am happy to say that as of Wednesday (September 21) we completed our short-term goal.
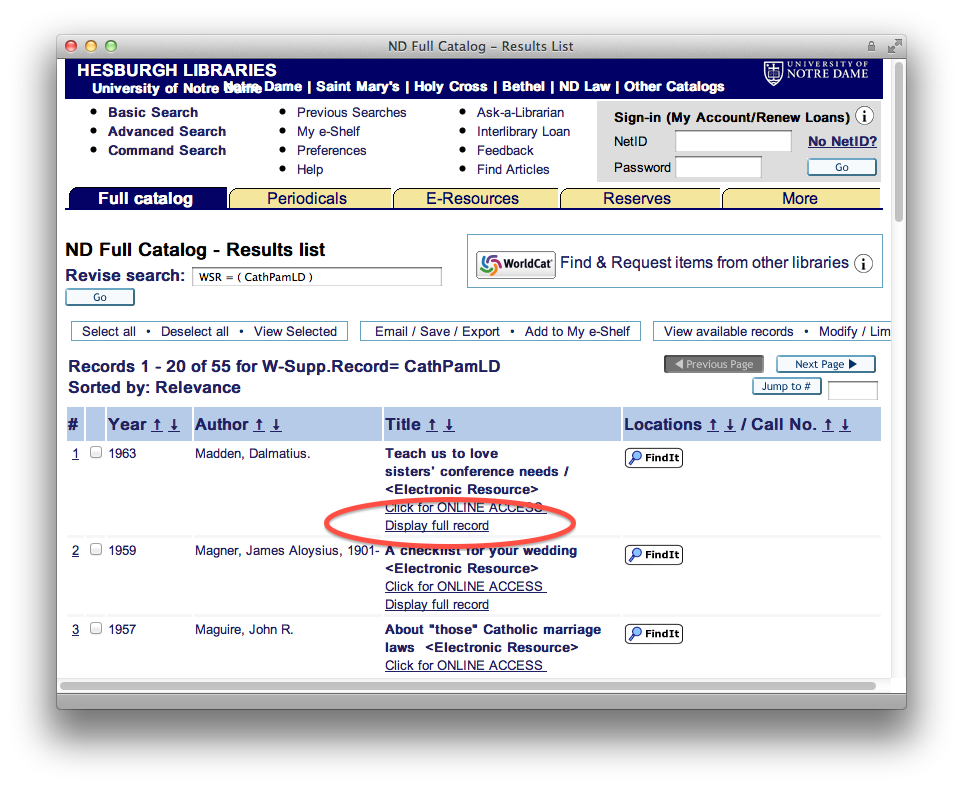
catalog display
The Hesburgh Libraries owns approximately 5,000 Catholic pamphlets — a set of physically smaller rather than larger publications dating from the early 1800s to the present day. All of these items are located in the Libraries’s Special Collection Department, and all of them have been individually cataloged.
As a part of a university (President’s Circle) grant, we endeavored to scan these documents, convert them into PDF files, save them to our institutional repository, enhance their bibliographic records, make them accessible through our catalog and “discovery system”, and provide text mining services against them. To date we have digitized just less than 400 pamphlets. Each page of each pamphlet has been scanned and saved as a TIFF file. The TIFF files were concatenated, converted into PDF files, and OCR’ed. The sum total of disk space consumed by this content is close to 92GB.
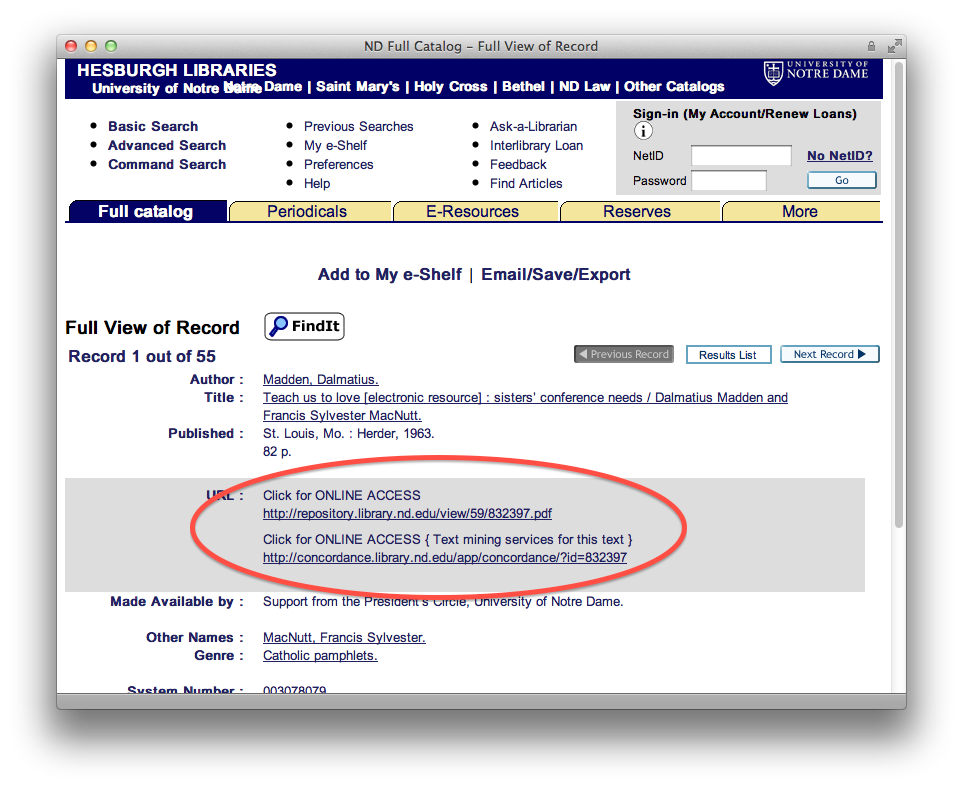
detail display
In order to practice with workflow, we selected about 30 of these pamphlets and enhanced their bibliographic records to denote their digital nature. These enhancements included URLs pointing to PDF versions of the pamphlets as well as URLs pointing to the text mining interfaces. When the enhancements were done we added them to the catalog. Once there they “flowed” to the “discovery system” (Primo). You can see these records from the following URL — http://bit.ly/qcnGNB. At the same time we extracted the plain text from the PDFs and made them accessible via a text mining interface allowing the reader to see what words/phrases are most commonly used in individual pamphlets. The text mining interface also includes a concordance — http://concordance.library.nd.edu/app/. These later services are implemented as a means of demonstrating how library catalogs can evolve from inventory lists to tools for use & understanding.
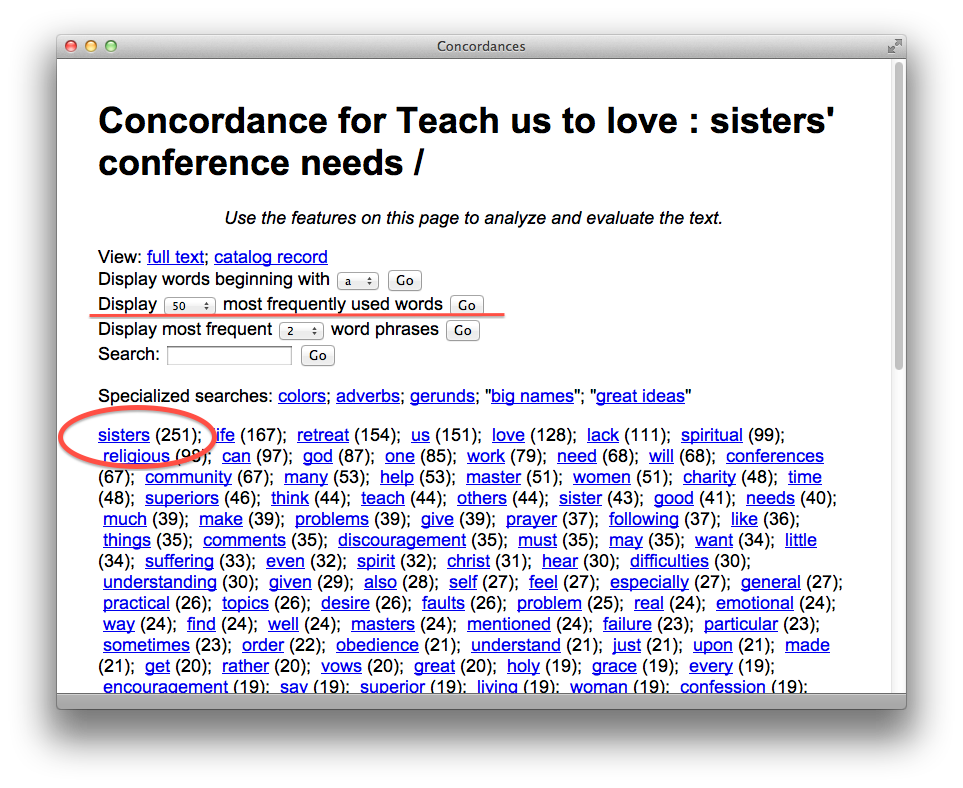
most frequently used words
While the practice may seem all but trivial, it required about three months of time. Between vacations, conferences, other priorities, and minor glitches the process took more time than originally planned. The biggest glitch was with Internet Explorer. We saved our PDF files in Fedora. Easy. Each PDF file had a URL coming from Fedora which we put into the cataloging records. But alas, Internet Explorer was not able to process the Fedora URLs because: 1) Fedora was not pointing to files but data streams, and/or 2) Fedora was not including an HTTP header called “filename disposition” which includes a file name extension. No other browsers we tested had these limitations. Consequently we (Rob Fox) wrote a bit of middleware taking a URL as input, getting the content from Fedora, and passing it back to the browser. Problem solved. This was a hack for sure. “Thank you, Rob!”
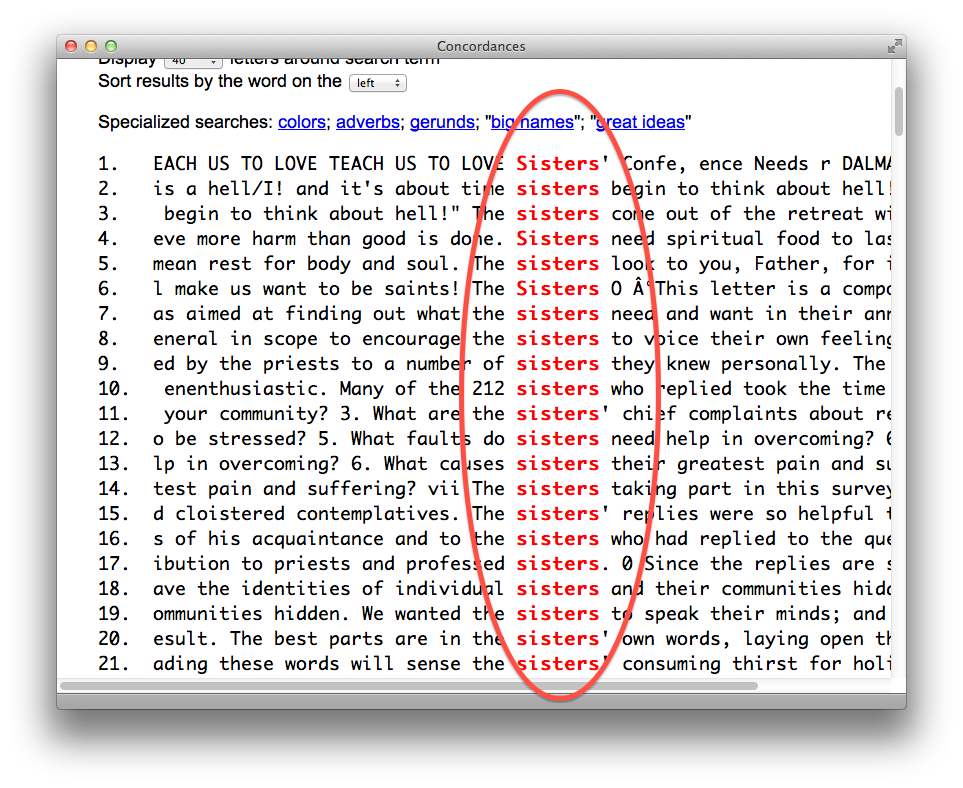
concordance display
We presently have no plans (resources) to digitize the balance of the pamphlets, but it is my personal hope we process (catalog, store, and make accessible via text mining) the remaining 325 pamphlets before Christmas. Wish us luck.
2011-09-27T23:36:00+00:00 Water collection: River Jordan at Yardenit (Israel) http://infomotions.com/water/index.xml?cmd=getwater&id=109 Map it |
This essay describes, illustrates, and demonstrates how the Digital Public Library of America (DPLA) can build on the good work of others who support the creation and maintenance of collections and provide value-added services against texts — a concept we call “use & understand”.
This document is available in a three of formats: 1) HTML – for viewing on a desktop Web browser, 2) PDF – for printing, the suggested format, and 3) ePub – for reading on your portable device.
Eric Lease Morgan <emorgan@nd.edu>
University of Notre Dame
September 1, 2011
This Digital Public Library of America (DPLA) beta-sprint proposal “stands on the shoulders of giants” who have successfully implemented the processes of find & get — the traditional functions of libraries. We are sure the DPLA will implement the services of find & get very well. To supplement, enhance, and distinguish the DPLA from other digital libraries, we propose the implementation of “services against text” in an effort to support use & understand.
Globally networked computers combined with an abundance of full text, born-digital materials has made the search engines of Google, Yahoo, and Microsoft a reality. Advances in information retrieval have made relevancy ranking the norm as opposed to the exception. All of these things have made the problems of find & get less acute than they used to be. The problems of find & get will never be completely resolved, but they seem adequately addressed for the majority of people. Enter a few words into a search box. Click go. And select items of interest.
Use & understand is an evolutionary step in the processes and functions of a library. These processes and functions enable the reader to ask and answer questions of large and small sets of documents relatively easily. Through the use of various text mining techniques, the reader can grasp quickly the content of documents, extract some of their meaning, and evaluate them more thoroughly when compared to the traditional application of metadata. Some of these processes and functions include: word/phrase frequency lists, concordances, histograms illustrating the location of words/phrases in a text, network diagrams illustrating what author say “in the same breath” when they mention a given word, plotting publication dates on a timeline, measuring the weight of a concept in a text, evaluating texts based on parts-of-speech, supplementing texts with Wikipedia articles, and plotting place names on a world maps.
We do not advocate the use of these services as replacements for “close” reading. Instead we advocate them as tools to supplement learning, teaching, and scholarship – functions of any library.
Use & understand: A video introduction |
Libraries are almost always a part of a larger organization, and their main functions can be divided into collection building, conservation & preservation, organization & classification, and public service. These functions are very much analogous to the elements of the DPLA articulated by John Palfrey: community, content, metadata, code, and tools & services.
This beta-Sprint proposal is mostly about tools & services, but in order to provide the proposed tools & services, we make some assumptions about and build upon the good work of people working on community, content, metadata, and code. These assumptions follow.
First, the community the DPLA encompasses is just about everybody in the United States. It is not only about the K-12 population. It is not only about students, teachers, and scholars in academia. It is not only about life-long learners, the businessperson, or municipal employees. It is about all of these communities at once and at the same time because we believe all of these communities have more things in common than they have differences. The tools & services described in this proposal can be useful to anybody who is able to read.
Second, the content of the DPLA is not licensed, much of it is accessible in full-text, and freely available for downloading and manipulation. More specifically, this proposal assumes the collections of the DPLA include things like but not necessarily limited to: digitized versions of public domain works, the full-text of open access scholarly journals and/or trade magazines, scholarly and governmental data sets, theses & dissertations, a substantial portion of the existing United States government documents, the archives of selected mailing lists, and maybe even the archives of blog postings and Twitter feeds. Moreover, we assume the DPLA is not merely a metadata repository, but also makes immediately available plain text versions of much of its collection.
Third, this proposal does not assume very many things regarding metadata beyond the need for the most basic of bibliographic information such as unique identifiers, titles, authors, subject/keyword terms, and location codes such as URLs. It does not matter to this proposal how the bibliographic metadata is encoded (MARC, XML, linked data, etc.). On the other hand, this proposal will advocate for additional bibliographic metadata, specifically, metadata that is quantitative in nature. These additions are not necessary for the fulfillment of the proposal, but rather side benefits because of it.
Finally, this proposal assumes the code & infrastructure of the DPLA supports the traditional characteristics of a library. In other words, it is assumed the code & infrastructure of the DPLA provide the means for the creation of collections and the discovery of said items. As described later, this proposal is not centered on the processes of find & get. Instead this proposal assumes the services of find & get are already well-established. This proposal is designed to build on the good work of others who have already spent time and effort in this area. We hope to “stand on the shoulders of giants” in this regard.
Given these assumptions about community, content, metadata, and infrastructure, we will now describe how the DPLA can exploit the current technological environment to provide increasingly useful services to its clientele. Through the process we hope to demonstrate how libraries could evolve and continue to play a meaningful role in our society.
While it comes across as trite, with the advent of ubiquitous and globally networked computers, the characteristics of data and information have fundamentally changed. More specifically, since things like books and journals — the traditional meat and potatoes of libraries — no longer need to be manifested in analog forms, their digital manifestations lend themselves to new functionality. For example, digital versions of books and journals can be duplicated exactly, and they are much less limited to distinct locations in space and time. Similarly, advances in information retrieval have made strict Boolean logic applied to against relational databases less desirable to the reader than relevancy ranking algorithms and the application of term frequency/inverse document frequency models against indexes. Combined together these things have made the search engines of Google, Yahoo, and Microsoft a reality. Compared to twenty years ago, this has made the problem of find & get much less acute.
While the problem of find & get will never completely be resolved, many readers (not necessarily librarians) feel the problem is addressed simply enough. Enter a few words into a search box, click Go, and select items of interest. We don’t know about you, but we can find plenty of data & information. The problem now is what to do with it once it is identified.
We are sure any implementation of the DPLA will include superb functionality for find & get. In fact, our proposal assumes such functionality will exist. Some infrastructure will be created allowing for the identification of relevant content. At the very least this content will be described using metadata and/or the full-text will be mirrored locally. This metadata and/or full-text will be indexed and a search interface applied against it. Search results will probably be returned in any number of ordered lists: relevancy, date, author, title, etc. The interface may very well support functionality based on facets. The results of these searches will never be perfect, but in the eyes of most readers, the results will probably be good enough. This being the case, our proposal is intended to build on this good work and enable the reader to do things with content they identify. Thus we propose to build on the process of find & get to support a process we call use & understand.
The problem of find & get is always a means to an end, and very rarely the end itself. People want to do things with the content they find. We call these things “services against texts”, and they are denoted by action verbs including but not limited to:
* analyze * annotate * cite * compare & contrast * confirm * count & tabulate words, phrases, and ideas * delete * discuss * evaluate * find opposite * find similar * graph & visualize * learn from * plot on a map * plot on a timeline * purchase * rate * read * review * save * share * summarize * tag * trace idea * transform
We ask ourselves, “What services can be provisioned to make the sense of all the content one finds on the Internet or in a library? How can the content of a digital work be ‘read’ in such a way that key facts and concepts become readily apparent? And can this process be applied to an entire corpus and/or a reader’s personal search results?” Thus, we see the problem of find & get evolving into the problem of use & understand.
In our opinion, the answers to these questions lie in the combination of traditional library principles with the application of computer science. Because libraries are expected to know the particular information needs of their constituents, libraries are uniquely positioned to address the problem of use & understand. What do people do with the data and information they find & get from libraries, or for that matter, any other place? In high school and college settings, students are expected to read literature and evaluate it. They are expected to compare & contrast it with similar pieces of literature, extract themes, and observe how authors use language. In a more academic setting scholars and researchers are expected to absorb massive amounts of non-fiction in order to keep abreast of developments in their fields. Each disciplinary corpus is whittled down by peer-review. It is reduced through specialization. Now-a-days the corpus is reduced even further through the recommendation processes of social networking. The resulting volume of content is still considered overwhelming by many. Use & understand is a next step in the information flow. It comes after find & get, and it is a process enabling the reader to better ask and answer questions of an entire collection, subcollection, or individual work. By applying digital humanities computing process, specifically text mining and natural language processing, the process of use & understand can be supported by the DPLA. The examples in the following sections demonstrate and illustrate how this can be done.
Again, libraries are almost always a part of a larger organization, and there is an expectation libraries serve their constituents. Libraries do this in any number ways, one of which is attempting to understanding the “information needs” of the broader organization to provide both just-in-time as well as just-in-case collections and services. We are living, working, and learning in an environment of information abundance, not scarsity. Our production economy has all but migrated to a service economy. One of the fuels of service economies is data and information. As non-profit organizations, libraries are unable to compete when it comes to data provision. Consequently libraries may need to refocus and evolve. By combining its knowledge of the reader with the content of collections, libraries can fill a growing need. Because libraries are expected to understand the partiular needs of their particular clientele, libraries are uniquely positioned to fill this niche. Not Google. Not Yahoo. Not Microsoft.
One of the simplest and most rudimentary services against texts the DPLA could provide in order to promote use & understand is to measure the size of documents in terms of word counts in addition to page counts.
Knowing the size of a document is important to the reader because it helps them determine the time necessary to consume the document’s content as well as implies the document’s depth of elaboration. In general, shorter books require less time to read, and longer books go into greater detail. But denoting the sizes of books in terms of page counts is too ambiguous to denote length. For any given book, a large print addition will contain more pages than the same book in paperback form, which will be different again from its first edition hard cover manifestation.
Not only can much of the ambiguity of document lengths be eliminated if they were denoted with word counts, but if bibliographic descriptions were augmented with word counts then meaningful comparisons between texts could easily be brought to light.
Suppose the DPLA has a collection of one million full-text items. Suppose the number of words in each item were counted and saved in bibliographic records. Thus, search results could then be sorted by length. Once bibliographic records were supplemented with word counts it would be possible to calculate the average length of a book in the collection. Similarly, the range of lengths could be associated with a relative scale such as: tiny books, short books, average length books, long books, and tome-like books. Bibliographic displays could then be augmented with gauge-like graphics to illustrate lengths.
Such was done against the Alex Catalogue of Electronic Texts. There are (only) 14,000 full-text documents in the collection, but after counting all the words in all the documents it was determined that the average length of a document is about 150,000 words. A search was then done against the Catalogue for Charles Dickens’s A Christmas Carol, Oliver Twist and David Copperfield, and the lengths of the resulting documents were compared using gauge-like graphics, as illustrated below:
 A Christmas Carol |
 Oliver Twist |
 David Copperfield |
At least a couple of conclusions can be quickly drawn from this comparison. A Christmas Carol is much shorter than David Copperfield, and Oliver Twist is an average length document.
There will certainly be difficulties counting the number of words in documents. Things will need to be considered in order to increase accuracy, things like: whether or not the document in question has been processed with optical character recognition, whether or not things like chapter headers are included, whether or not back-of-the-book indexes are included, whether nor not introductory materials are included. All of this also assumes a parsing program can be written which accurately extracts “words” from a document. The later is, in fact, fodder for an entire computer science project.
Despite these inherent difficulties, denoting the number of words in a document and placing the result in bibliographic records can help foster use & understand. We believe counting the number of words in a document will result in a greater number of benefits when compared to costs.
Measuring the inherent difficulty — readability score — of texts enables the reader to make judgements about those texts, and in turn, fosters use & understand. By including such measurements in the bibliographic records and search results, the DPLA will demonstrate ways it can “save the time of the reader”.
In the last century J. Peter Kincaid, Rudolf Flesch, and Robert Gunning worked both independently as well as collaboratively to create models of readability. Based on a set of factors (such as but not limited to: lengths of documents measured in words, the number of paragraphs in documents, the number of sentences in paragraphs, the number of words in sentences, the complexity of words, etc.) numeric values were calculated to determined the reading levels of documents. Using these models things like Dr. Seuss books are consistently determined to be easy to read while things like insurance policies are difficult. Given the full-text of a document in plain text form, it is almost trivial to compute any number of readability scores. The resulting values could be saved in bibliographic records, and these values could be communicated to the reader with the use of gauge-like graphics.
In a rudimentary way, the Alex Catalogue of Electronic texts has implemented this idea. For each item in the Catalogue the Fog, Flesch, and Kincaid readability scores have been calculated and saved to the underlying MyLibrary database. Searches were done against the Catalogue for Charles Dickens’s David Copperfield, Henry David Thoreau’s Walden, and Immanual Kant’s Fundamental Principles Of The Metaphysics Of Morals. The following graphics illustrate the readability scores of each. We believe the results are not surprising, but they are illustrative of this technique’s utility:
 David Cooperfield |
 Walden |
 Metaphysics of Morals |
If readability scores were integrated into bibliographic search engines (“catalogs”), then it would be possible to limit search results by reading level or even sort search results by them. Imagine being able to search a library catalog for all items dealing with Neo-Platonism, asking for shorter items as opposed to longer items, and limiting things further by readability score.
Readability scores are not intended to be absolute. Instead they are intended to be used as guidelines. If the reader is a novice when it comes to particular topic, and the reader is of high school age, that does not mean they are unable to read college level material. Instead, the readability scores would be used to set the expectations of the reader and help them make judgements before they begin reading a book.
Bibliographic systems are notoriously qualitative in nature making the process of compare & contrast between bibliographic items very subjective. If there were more quantitative data associated with bibliographic records, then mathematical processes could be applied against collections as a whole, subsets of the collection, or even individual items.
Library catalogs are essentially inventory lists denoting what a library owns (or licenses). For the most part, catalogs are used to describe the physical nature of a library collection: authors, titles, publication dates, pagination and size, notes (such as “Includes index.”), and subject terms. Through things like controlled vocabularies and authority lists, the nature of a collection can be posited, and some interesting questions can be answered. Examples include: what is the average age of the items in the collection, what are the collection’s major subject areas, who are the predominate authors of the works in the collection. These are questions whose answers are manifested now-a-days through faceted browse interfaces, but they are questions of the collection as a whole or subsets of the collection, not individual works. They are questions librarians find interesting, not necessarily readers who want to evaluate the significance of a given work.
If the bibliographic systems were to contain quantitative data, then the bibliographic information systems would be more meaningful and more useful. Dates are a very good example. The dates (years) in a library catalog denote when the item in hand (a book) was published, not when the idea in the book was manifested. Consequently, if Plato’s Dialogs were published today, then its library catalog record would have a value of 2011. While such a thing is certainly true, it is misleading. Plato did not write the Dialogs this year. They were written more than 2,500 years ago. Given our current environment, why can’t a library catalog include this sort of information?
Suppose the reader wanted to read all the works of Henry David Thoreau. Suppose the library catalog had accurately denoted the all the items in its collection by this author with the authority term, “Thoreau, Henry David”. Suppose the reader did an author search for “Thoreau, Henry David” and a list of twenty-five items was returned. Finally, suppose the reader wanted to begin by reading Thoreau’s oldest work first and progress to his latest. Using a library catalog, such a thing would not be possible because the dates in bibliographic records denote the date of publication, not the date of first conception or manifestation.
Suppose the reader wanted to plot on a timeline when Thoreau’s works were published, and the reader wanted to compare this with the complete works of Longfellow or Walt Whitman. Again, such a thing would not be possible because the dates in a library catalog denote publication dates, not when ideas were originally manifested. Why shouldn’t a library catalog enable the reader to easily create timelines?
To make things even more complicated, publication dates are regularly denoted as strings, not integers. Examples include: [1701], 186?, 19–, etc. These types of values are ambiguous. Their meaning and interpretation is bound to irregularly implemented “syntactical sugar”. Consequently, without all but heroic efforts, it is not easy to do any sort of compare & contrast evaluation when it comes to dates.
The DPLA has the incredible opportunity to make a fresh start when it comes to the definition of library catalogs. We know the DPLA will not want to reinvent the wheel. At the same time we believe the DPLA will want to exploit the current milieu, re-evaluate the possibilities of computer technology, and consequently refine and evolve the meaning of “catalog”. Traditional library catalogs were born in an era of relative information scarcity. Today we are dealing with problems of abundance. Library catalogs need to do many things differently in order to satisfy the needs/desires of the current reader. “Next-generation library catalogs” can do so much more than provide access to local collections. Facilitating ways to evaluate collections, sub-collections, or individual items through the use of quantitative analysis is just one example.
By turning a relevancy ranking algorithm on its head, it is be possible to measure the existence of concepts of a given work. If this were done for many works, then new comparisons between works would be possible, and again, making it possible for the reader to easily compare & contrast items in a corpus or search results. Of all the services against texts examples in this proposal, we know this one is the most avant-garde.
Term frequency/inverse document frequency (TFIDF) is a model at the heart of many relevancy ranking algorithms. Mathematically stated, TFIDF equals:
( c / t ) * log( d / f )
where:
In other words, TFIDF calculates relevancy (“aboutness”) by multiplying the ratio of query words and document sizes to the ratio of number of documents in a corpus and total frequency of query terms. Thus, if there are three documents each containing the word “music” three times, but one of them is 100 words long and the other two are 200 words long, then the first document is considered more relevant than the other two.
Written language — which is at the very heart of library content — is ambiguous, nuanced, and dynamic. Few, if any, concepts can be completely denoted by a single word or phrase. Instead, a single concept may be better described using a set of words or phrases. For example, music might be denoted thusly:
art, Bach, Baroque, beat, beauty, blues, composition, concert, dance, expression, guitar, harmony, instrumentation, key, keyboard, melody, Mozart, music, opera, percussion, performance, pitch, recording, rhythm, scale, score, song, sound, time, violin
If any document used some or all of these words with any degree of frequency, then it would probably be safe to say the document was about music. This “aboutness” could then be calculated by summing the TFIDF scores of all the music terms in a given document — a thing called the “document overlap measure”. Thus, one document might have a total music “aboutness” measure of 105 whereas another document might have a measure of 55.
We used a process very similar to the one outlined above in an effort to measure the “greatness” of the set of books called The Great Books Of The Western World. Each book in the set was evaluated in terms of it use of the 102 “great ideas” enumerated in the set’s introduction. We summed the computed TFIDF values of each great idea in each book, a value we call the Great Ideas Coefficient. Through this process we determined the “greatest” book in the set was Aristotleʼs Politics because it alluded to the totality of “great ideas” more than the others. Furthermore, we determined that Shakespeare wrote seven of the top ten books when it comes to the idea of love. The following figure illustrates the result of these comparisons. The bars above the line represent books greater than the hypothetical average great book, and the bars below the line are less great than the others.
 Measuring the “greatness” of The Great Books of the Western World |
The DPLA could implement very similar services against texts in one and/or two ways. First, it could denote any number of themes (like music or “great ideas”) and calculate coefficients denoting the aboutness of those themes for every book in the collection. Readers could then limit their searches by these coefficients or sort their search results accordingly. Find all books with subjects equal to philosophy. Sort the result by the philosophy coefficient.
Second, and possibly better, the DPLA could enable readers to denote their own more specialized and personalized themes. These themes and their aboutness coefficients could then be applied, on-the-fly, to search results. For example, find all books with subject terms equal to gardening, and sort the result by the reader’s personal definition of biology.
As stated earlier, written language is ambiguous and nuanced, but at the same time it is, to some degree, predicable. If it were not predicable, then no one would be able to understand another. Because of this predicability, language, to some degree, can be quantified. Once quantified, it can be measured. Once measured it can be sorted and graphed, and thus new meanings can be expressed and evaluated. The coefficients described in this section, like the measurements of length and readability, are to be taken with a grain of salt, but they can help the reader use & understand library collections, sub-collections, and individual items.
Plotting things on a timeline is an excellent way to put events into perspective, and when written works are described with dates, then they are amenable to visualizations.
The DPLA could put this idea into practice by applying it against search results. The reader could do a search in the “catalog”, and the resulting screen could have a link labeled something like “Plot on a timeline”. By clicking the link the dates of search results could be extracted from the underlying metadata, plotted on a timeline, and displayed. At the very least such a function would enable the reader to visualize when things were published and answer rudimentary questions such as: are there clusters of publications, do the publications span a large swath of time, did one particular author publishing things on regular basis?
The dates in traditional bibliographic metadata denote the publication of an item, as mentioned previously. Consequently the mapping of monographs may not be useful as desired. On the other hand, the dates associated with things of a serial nature (blog postings, twitter feeds, journal articles, etc.) are more akin to dates of conception. We imagine the DPLA systematically harvesting, preserving, and indexing freely available and open access serial literature. This content is much more amenable to plotting on a timeline as illustrated below:
 Timeline illustrating when serial literature was published |
The timeline was created by aggregating selected RSS feeds, parsing out the dates, and plotting them accordingly. Different colored items represent different feeds. Each item in the timeline is hot providing the means to read the items’ abstracts and optionally viewing the items’ full text.
Plotting things on a timeline is another way the DPLA can build on the good work of find & get and help the reader use & understand.
Akin to traditional back-of-the-book indexes, word and phrase frequency tabulations are one of the simplest and most expedient ways of providing access to and overviews of a text. Like tables of contents and indexes, word and phrase frequecies increase a text’s utility and make texts easier to understand.
Back-of-the-book indexes are expensive to create and the product of an individual’s perspective. Moreover, back-of-the-book indexes are not created for fiction. Why not? Given the full-text of a work any number of back-of-the-book index-like displays could be created to enhance the reader’s experience. For example, by simply tabulating the occurrences of every word in a text (sans, maybe, stop words), and then displaying the resulting list alphabetically, the reader can have a more complete back-of-the-book index generated for them without the help of a subjective indexer. The same tabulation could be done again but instead of displaying the content alphabetically, the results could be ordered by frequency as in a word cloud. In either case each entry in the “index” could be associated with an integer denoting the number of times the word (or phrase) occurs in the text. The word (or phrase) could then be linked to a concordance (see below) in order to display how the word (or phrase) was used in context.
Take for example, Henry David Thoreaus’s Walden. This is a piece of non-fiction about a man who lives alone in the woods by a pond for just about two years. In the book’s introduction Ralph Waldo Emerson describes Thoreau as a man with a keen sense of physical space and an uncanny ability for measurement. The book itself describes one person’s vision of what it means to be human. Upon the creation and display of the 100 most frequently used two-word phrases (bigrams), these statements about the book are born out. Notice the high frequency of quantitative references as well as reference to men:
Compare Walden to James Joyce’s Ulysses, a fictional work describing a day in the life of Leopold Bloom as he walks through Dublin. Notice how almost every single bigram is associated with the name of a person
Interesting? Some people may react to these illustrations and say, “So what? I already knew that.” To which we reply, “Yes, but what about those people who haven’t read these texts?” Imagine being able to tabulate the word frequencies against any given set of texts — a novel, a journal article, a piece of non-fiction, all of the works by a given author or in a given genre. The results are able to tell the reader things about the works. For example, it might alert the reader to the central importance of a person named Bloom. When Bloom is mentioned in the text, then maybe the reader ought to be extra attention to what is being said. Frequency tabulations and word cloud can also alert the reader to what is not said in a text. Apparently religion is not a overarching theme in either of the above examples.
 The 100 most frequent two-word phrases in Walden |
 The 100 most frequent two-word phrases in Ulysses |
It is possible to tabulate word frequencies across texts. Again, using A Christmas Carol, Oliver Twist, and David Copperfield as examples, we discover the 6-word phrase “taken with a violent fit of” appears in both David Copperfield and A Christmas Carol. Moreover, the bigram “violent fit” appears on all three works. Specifically, characters in these three Dickens stories have violent fits of laughter, crying, trembling, and coughing. By concatenating the stories together and applying concordancing methods to them (described below) we see there are quite a number of violent things in the three stories:
  n such breathless haste and violent agitation, as seemed to betoken so
  ood-night, good-night!' The violent agitation of the girl, and the app
  sberne) entered the room in violent agitation. 'The man will be taken,
  o understand that, from the violent and sanguinary onset of Oliver Twi
  one and all, to entertain a violent and deeply-rooted antipathy to goi
  eep a little register of my violent attachments, with the date, durati
  cal laugh, which threatened violent consequences. 'But, my dear,' said
  in general, into a state of violent consternation. I came into the roo
  artly to keep pace with the violent current of her own thoughts: soon
  ts and wiles have brought a violent death upon the head of one worth m
   There were twenty score of violent deaths in one long minute of that
  id the woman, making a more violent effort than before; 'the mother, w
   as it were, by making some violent effort to save himself from fallin
  behind. This was rather too violent exercise to last long. When they w
   getting my chin by dint of violent exertion above the rusty nails on
  en who seem to have taken a violent fancy to him, whether he will or n
  peared, he was taken with a violent fit of trembling. Five minutes, te
  , when she was taken with a violent fit of laughter; and after two or
  he immediate precursor of a violent fit of crying. Under this impressi
  and immediately fell into a violent fit of coughing: which delighted T
  of such repose, fell into a violent flurry, tossing their wild arms ab
   and accompanying them with violent gesticulation, the boy actually th
  ght I really must have laid violent hands upon myself, when Miss Mills
   arm tied up, these men lay violent hands upon him -- by doing which,
   every aggravation that her violent hate -- I love her for it now -- c
   work himself into the most violent heats, and deliver the most wither
  terics were usually of that violent kind which the patient fights and
   me against the donkey in a violent manner, as if there were any affin
   to keep down by force some violent outbreak. 'Let me go, will you,--t
  hands with me - which was a violent proceeding for him, his usual cour
  en.' 'Well, sir, there were violent quarrels at first, I assure you,'
  revent the escape of such a violent roar, that the abused Mr. Chitling
  t gradually resolved into a violent run. After completely exhausting h
  , on which he ever showed a violent temper or swore an oath, was this
  ullen, rebellious spirit; a violent temper; and an untoward, intractab
  fe of Oliver Twist had this violent termination or no. CHAPTER III REL
  in, and seemed to presage a violent thunder-storm, when Mr. and Mrs. B
  f the theatre, are blind to violent transitions and abrupt impulses of
  ming into my house, in this violent way? Do you want to rob me, or to
These observations simply beg other questions. Is violence a common theme in Dickens’ works? What other adjectives are used to a greater or lesser degree in Dickens’ works? How do the use of these adjectives differ from other authors of the same time period or within the canon of English literature?
While works of fiction are the basis of most of the examples, there is no reason why similar processes couldn’t be applied to non-fiction as well. We also understand that the general reader will not be interested in these sorts of services against texts. Instead we see these sorts of services more applicable to students in high school and college. We also see these sorts of services being applicable to the scholar or researcher who needs to “read” large numbers of journal article. Finally, we do not advocate the use of these sorts of tools as a replacement for traditional “close” reading. These tools are supplements and additions to the reading process just as tables of contents and back-of-the-book indexes are today.
Concordances — one of the oldest literary tools in existence — have got to be some of the more useful services against texts a library could provide because they systematically display words and concepts within the context of the larger written work making it very easy to compare & contrast usage. Originally implemented by Catholic priests as early as 1250 to study religious texts, concordances (sometimes called “key word in context” or KWIC indexes) trivialize the process of seeing how a concept is expressed in a work.
As an example of how concordances can be used to analyze texts, we asked ourselves, “How do Plato, Aristotle, and Shakespeare differ in their definition of man?” To answer this question we amassed all the works of the authors, searched each for the phrase “man is”, and displayed the results in a concordance-like fashion. From the results the reader can see how the definitions of Plato and Aristotle are very similar but much different from Shakespeare’s:
  stice, he is met by the fact that man is a social being, and he tries to harmoni
  ption of Not-being to difference. Man is a rational animal, and is not -- as man
  ss them. Or, as others have said: Man is man because he has the gift of speech;
  wise man who happens to be a good man is more than human (daimonion) both in lif
  ied with the Protagorean saying, 'Man is the measure of all things;' and of this
  ronounced by the judgement 'every man is unjust', the same must needs hold good
  ts are formed from a residue that man is the most naked in body of all animals a
  ated piece at draughts. Now, that man is more of a political animal than bees or
  hese vices later. The magnificent man is like an artist; for he can see what is
  lement in the essential nature of man is knowledge; the apprehension of animal a
   what I have said against it; for man is a giddy thing, and this is my conclusio
   of man to say what dream it was: man is but an ass, if he go about to expound t
  e a raven for a dove? The will of man is by his reason sway'd; And reason says y
  n you: let me ask you a question. Man is enemy to virginity; how may we barricad
  er, let us dine and never fret: A man is master of his liberty: Time is their ma
We do not advocate the use of concordances as the be-all and end-all of literary analysis but rather a pointer to bigger questions. Think how much time and energy would have been required if the digitized texts of each of these authors was not available, and if computers could not be applied against them. Concordances, as well as the other services against texts outlined in this proposal, make it easier to ask questions of collections, sub-collections, and individual works. This ease-of-use empowers the reader to absorb, observe, and learn from texts in ways that was not possible previously. We do not advocate these sort of services against texts as replacements for traditional reading processes, but rather we advocate them as alternative and supplemental tools for understanding the human condition or physical environment as manifested in written works.
Herein lies one of the main points of our proposal. By creatively exploiting the current environment where full-text abounds and computing horsepower is literally at everybody’s fingertips, libraries can assist the reader to “read” texts in new and different ways — ways that make it easier to absorb larger amounts of information and ways to understand it from new and additional perspectives. Concordances are just one example.
Visualizing the words frequently occurring near a given word is often descriptive and revealing. With the availability of full-text content, creating such visualization is almost trivial and have the potencial for greatly enhancing the reader’s experience. This enhanced reading process is all but impossible when the written word is solely accessible in analog forms, but in a digital form the process is almost easy.
For example, first take the word woodchuck as found in Henry David Thoreau’s Walden. Upon reading the book the reader learns of his literal distaste for the woodchuck. They eat is beans, and he wants to skin them. Compare the same author’s allusions to woodchucks in his work Two Weeks On The Concord And Merrimack Rivers. In this work, when woodchucks are mentioned he also alludes to other small animals such as foxes, minks, muskrats, and squirrels. In other words, the connotations surrounding woodchucks and between the two books are different as illustrated by the following network diagrams:
 “woodchuck” in Walden |
 “woodchuck” in Rivers |
The given word — woodchuck — is in the center. Each of the words connected to the given word are the words appearing most frequently near the given word. This same process is then applied to the connected words. Put another way, these network diagrams literally illustrate what an author says, “in the same breath” when they use a given word. Such visualizations are simply not possible through the process of traditional reading without spending a whole lot of effort. The DPLA could implement the sort of functionality described in this section and make the reader’s experience richer. It demonstrates how libraries can go beyond access (a problem that is increasingly not a problem) and move towards use & understand.
We do not advocate the use of this technology to replace traditional analysis, but rather to improve upon it. This technology, like all of the examples in the proposal, makes it easier to find interesting patterns for further investigation.
Sometimes displaying where in a text, percentage-wise, a word or phrase exists can raise interesting questions, and by providing tools to do such visualizations the DPLA will foster the ability to more easily ask interesting questions.
For example, what comes to mind when you think of Daniel Defoe’s Robinson Curose? Do you think of a man shipwrecked on an island and the cannibal named Friday? Ask yourself, when in the story is the man shipwrecked and when does he meet Friday? Early in the story? In the middle? Towards the end? If you guessed early in the story, then you would be wrong because most of the story takes place on a boat, and only three-quarters of the way through the book does Friday appear, as illustrated by the following histogram:
We all know that Herman Melville’s book Moby Dick is about a sailor hunting a great white whale. Looking at a histogram of where the word “white” appears in the story, we see a preponderance of its occurrence forty percent the way through the book. Why? Upon looking at the book more closely we see that one of the chapters is entitled “The Whiteness of the Whale”, and it is almost entirely about the word “white”. This chapter appears about forty percent through the text. Who ever heard of an entire book chapter whose theme was a color?
 “friday” in Crusoe |
 “white” in Moby Dick |
In a Catholic pamphlet entitled Letters of an Irish Catholic Layman the word “catholic” is one of the more common and appears frequently in the text towards the beginning as well as the end
 “catholic” in Layman |
 “lake erie” in Layman |
 “niagara falls” in Layman |
After listing the most common two-word phrases in the book we see that there are many references to places in upper New York state:
 The 100 most frequently used two-word phrases in Letters of an Irish Catholic Layman |
Looking more closely at the locations of “Lake Erie” and “Niagra Falls” in the text, we see that these things are referenced in the places where the word “catholic” is not mentioned
Does the author go off on a tangent? Are there no catholics in these areas? The answers to the questions, and the question of why are left up to the reader, but the important point is the ability to quickly “read” the texts in ways that were not feasible when the books were solely in analog form. Displaying where in a text words or phrases occur literally illustrates new ways to view the content of libraries. These are examples of how the DPLA can build on find & get and increase use & understand.
Written works can be characterized through parts-of-speech analysis. This analysis can be applied to the whole of a library collection, subsets of the collection, or individual works. The DPLA has the opportunity to increase the functionality of a library by enabling the reader to elaborate upon and visualize parts-of-speech analysis. Such a process will facilitate greater use of the collection and improve understanding of it.
Because the English language follows sets of loosely defined rules, it is possible to systematically classify the words and phrases of written works into parts-of-speech. These include but are not limited to: nouns, pronouns, verbs, adjectives, adverbs, prepositions, punctuation, etc. Once classified, these parts-of-speech can be tabulated and quantitative analysis can begin.
Our own foray’s into parts-of-speech analysis, where the relative percentage use of parts-of-speech were compared, proved fruitless. But the investigation inspired other questions whose answers may be more broadly applied. More specifically, students and scholars are often times more interested in what an author says as opposed to how they say it. Such investigations can gleaned not so much from gross parts-of-speech measurements but rather the words used to denote each parts-of-speech. For example, the following table lists the 10 most frequently used pronouns and the number of times they occur in four works. Notice the differences:
| Walden | Rivers | Northanger | Sense |
|---|---|---|---|
| I (1,809) | it (1,314) | her (1,554) | her (2,500) |
| it (1,507) | we (1,101) | I (1,240) | I (1,917) |
| my (725) | his (834) | she (1,089) | it (1,711) |
| he (698) | I (756) | it (1,081) | she (1,553) |
| his (666) | our (677) | you (906) | you (1,158) |
| they (614) | he (649) | he (539) | he (1,068) |
| their (452) | their (632) | his (524) | his (1,007) |
| we (447) | they (632) | they (379) | him (628) |
| its (351) | its (487) | my (342) | my (598) |
| who (340) | who (352) | him (278) | they (509) |
While the lists are similar, they are characteristic of work from which they came. The first — Walden — is about an individual who lives on a lake. Notice the prominence of the word “I” and “my”. The second — Rivers — is written by the same author as the first but is about brothers who canoe down a river. Notice the higher occurrence of the word “we” and “our”. The later two works, both written by Jane Austin, are works with females as central characters. Notice how the words “her” and “she” appear in these lists but not in the former two. It looks as if there are patterns or trends to be measured here.
If the implementation of the DPLA were to enable the reader to do this sort of parts-of-speech analysis against search results, then the search results may prove to be more useful.
Nouns and pronouns play a special role in libraries because they are the foundation of controlled vocabularies, authority lists, and many other reference tools. Imagine being able to extract and tabulate all the nouns (things, names, and places) from a text. A word cloud like display would convey a lot of meaning about the text. On the other hand, a simple alphabetical list of the result could very much function like a back-of-the-book index. Each noun or noun phrase could be associated with any number of functions such as but not limited to:
We demonstrated the beginnings of the look-up functions in a Code4Lib Journal article called “Querying OCLC Web Services for Name, Subject, and ISBN“. The concordance functionality is described above. The elaboration service is common place in today’s ebook readers. Through an interface designed for mobile devices, we implemented a combination of the elaborate and plot on a map services as a prototype. In this implementation the reader is presented with a tiny collection of classic works. The reader is then given the opportunity to browse the names or places index. After the reader selects a specific name or place the application displays a descriptive paragraph of the selection, an image of the selection, and finally, hypertext links to a Wikipedia article or a Google Maps display.
 |
 |
 |
 |
 |
| Screen shots of services against texts on a mobile device | ||||
Given the amount of full text content that is expected to be in or linked from the DPLA’s collection, there is so much more potential functionality for the reader. The idea of a library being a storehouse of books and journals is rapidly become antiquated. Because content is so readily available on the ‘Net, there is a need for libraries to evolve beyond its stereotypical function. By combining a knowledge of what readers do with information with the possibilities for full text analysis, the DPLA will empower the reader to more easily ask and answer questions of texts. And in turn, make it easier for the reader to use & understand what they are reading.
People may believe the techiques described herein run contrary to the traditional processes of “close” reading. From our point of view, nothing could be further from the truth. We sincerely believe the techniques described in this proposal suppliment and enhance the reading process.
We are living in an age where we feel like we are drowning in data and information. But according to Ann Blair this is not a new problem. In her book, Too Much to Know, Blair chronicles in great detail the ways scholars since the 3rd Century have dealt with information overload. While they seem obvious in today’s world, they were innovations in their time. They included but were not limited to: copying texts (St. Jerome in the 3rd Century), creating concordances (Hugh St. Cher in the 13th Century), and filing wooden “cards” in a “catalog” (Athanasius Kircher 17th Century).
 St. Jerome |
 Hugh St. Cher |
 Athanasius Kircher |
Think of all the apparatus associated with a printed book. Books have covers, and sometimes there are dust jackets complete with a description of the book and maybe the author. On the book’s spine is the title and publisher. Inside the book there are cover pages, title pages, tables of contents, prefaces & introductions, tables of figures, the chapters themselves complete with chapter headings at the top of every page, footnotes & references & endnotes, epilogues, and an index or two. These extras — tables of contents, chapter headings, indexes, etc. — did not appear in books with the invention of the codex. Instead their existence was established and evolved over time.
In scholarly detail, Blair documents how these extras — as well as standard reference works like dictionaries, encyclopedias, and catalogs — came into being. She asserts the creation of these things became necessary as the number and lengths of books grew. These tools made the process of understanding the content of books easier. They reenforced ideas, and made the process of returning to previously read information faster. Accordingl to Blair, not everybody thought these tools — especially reference works — were a good idea. To paraphrase, “People only need a few good books, and people should read them over and over again. Things like encyclopedias only make the mind weaker since people area not exercising their memories.” Despite these claims, reference tools and the aparatus of printed books continue to exist and our venerable “sphere of knowledge” continues to grow.
Nobody can claim undertanding of a book if they read only the table of contents, flip through the pages, and glance at the index. Yes, they will have some understanding, but it will only be tertiary. We see the tools described in this proposal akin to tables of contents and back-of-the-book indexes. They are tools to find, get, use, and understand the data, information, and knowledge a book contains. They are a natural evolution considering the existence of books in digital forms. The services against texts described in this proposal enhance and supplement the reading process. They make it easier to compare & contrast the content of single books or an entire corpus. They make it faster and easier to extract pertinate information. Like a back-of-the-book index, they make it easier to ask questions of a text and get answers quickly. The tools described in this proposal are not intended to be end-all and be-all of textual analysis. Instead, they are intended to be pointers to interesting ideas, and it is left up to the reader to flesh out and confirm the ideas after closer reading.
Digital humanities investigations and specifically text mining computing techniques like the ones in this proposal can be viewed as modern-day processes for dealing with and taking advantage of information overload. Digital humanists use computers to evaluate all aspects of human expression. Writing. Music. Theator. Dance. Etc. Text mining is a particular slant on the digital humanities applying this evaluation process against sets of words. We are simply advocating these proceses become integrated with library collections and services.
This section lists the software used to create our Beta-Sprint Propoal examples. All of the software is open source or freely accessible. None of the software is one-of-a-kind because each piece could be replaced by something else providing similar functionality.
This short list of software can be used to create a myriad of enhanced library services and tools, but the specific pieces of software listed above are not so important in and of themselves. Instead, they represent types of software which already exist and are freely available for use by anybody. Services against texts facilitating use & understand can be implemented with a wide variety of software applications. The services against texts outlined in this proposal are not limited to the software listed in this section.
Putting into practice the services against text described in this proposal would not be a trivial task, but process is entirely feasible. This section outlines a number of implementation how-to’s.
The measurement services (size, readability, and concept) would idealy be done against texts as they were added to the collection. The actual calculation of the size and readability scores are not difficult. All that is needed is the full text of the documents and software to do the counting. (Measuring concepts necessitates additional work since TFIDF requires a knowledge of the collection as a whole; measuring concepts can only be done once the bulk of the collection has been built. Measuring concepts is also a computationally intensive process.)
Instead, the challenge includes denoting locations to store the metadata, deciding whether or not to index the metadata, and figuring out how to display the metadata to the reader. The measurements themselves will be integers or decimal numbers. If MARC were the container for the bibliogrpahic data, then any one of a number of local notes could be used for storage. If a relational database were used, then additional fields could be used. If the DPLA wanted to enable the reader to limit or sort search results by any of the measurments, then the values will need to be indexed. We would be willing to guess the underlying indexer for the DPLA will be Solr, since it seems to be the current favorite. Indexing the measurements in Solr will be as easy as creating the necessary fields to a Solr configuration file, and adding the measurements to the fields as the balance of the bibliographic data is indexed. We would not suggest creating any visualizations of the measurements ahead of time, but rather on-the-fly and only as they were needed; the visualizations could probably be implemented using Javascript and embedded into the DPLA’s “catalog”.
Like the measurements, plotting the publication dates or dates of conception on a timeline can be implemented using Javascript and embedded into the DPLA’s “catalog”. For serial literature (blogs, open access journal articles, Twitter feeds, etc.) the addition of meaningful dates will have already been done. For more more traditional library catalog materials (books), the addition of dates of conception will be labor intensive. Therefore such a thing might not be feasible. On the other hand, this might be a great opportunity to practice a bit of crowdsourcing. Consider making a game out of the process, and try to get people outside the DPLA to denote when Plato, Thoreau, Longfellow, and Whitman wrote their great works.
Implementing the frequency, concordance, proximity, and locations in a text services require no preprocessing. Instead these services can all be implemented on-the-fly by a program linked from the DPLA’s “catalog”. These services will require a single argument (a unique identifier) and some optional input parameters. Given a unique identifier, the program can look up basic bibliographic information from the catalog including the URL where the full-text resides, retrieve the full-text, and do the necessary processing. This URL could point to the local file system, or, if the network was deemed fast and reliable, the URL could point to the full-text in remote repositories such as the Internet Archive or the HathiTrust. These specific services against texts have been implemented in the Catholic Research Resources Alliance “Catholic Portal” application using “Analyze using text mining techniques” as the linked text. This is illustrated below:
 Screen shot of the “Catholic Portal” |
By the middle of September 2011 we expect the Hesburgh Libraries at the University of Notre Dame will have included very similar links in their catalog and “discovery system”. These links will provide access to frequency, concordance, and locations in a text services for sets of digitized Catholic pamphlets.
Based on our experience, the parts-of-speech services will require pre-processing. This is because the process of classifying words into categories of parts-of-speech is a time- and computing-intensive process. It does not seem feasible to extract the parts-of-speech from a document in real time.
To overcome this limitation, we classified our small sample of texts and saved the result in easily parsable text files. Our various scripts were then applied against these surrogates as opposed to the original documents. It should be noted that these surrogates, while not only computationally expensive, were also expensive in terms of disk space consuming more than double the space of the original.
We suggest one or two alternative strategies for the DPLA. First, determine what particular items from the DPLA’s collection may be the more popular. Once determined, have those items pre-processed outputting the surrogate files. These pre-processed items can then be used for demonstration purposes and generate interest in the parts-of-speech services. Second, when readers want to use these services against items that have not been pre-processed, then have the readers select their items, supply an email address, process the content, and notifiy the readers when the surrogates have been created. This second approach is akin to the just-in-time approach to collection development as opposed to the just-in-case philosophy.
Obviously, we think all of the services against texts outlined above are useful, but practically speaking, it is not feasible to implement all of them once. Instead we advocate the following phased approach:
This section lists most of the services outlined in the proposal as well as links to blog postings and example implementations.
These URLs point to services generating word frequencies, concordances, histograms illustrating word locations, and network diagrams illustrating word proximities for Walden and Ulysses.
Using the text mining techniques built into the “Catholic Portal” the reader can see where the words/phrases “catholic”, “lake erie”, and “niagara falls” are used in the text.
Using network diagrams, the reader can see what words Thoreau uses “in the same breath” when he mentions the word “woodchuck”. These proximity displays are also incorporated into just about every item in the Alex Catalogue
This blog posting first tabulates the most frequently used words by the authors, as well as their definitions of “man” and a “good man”.
The “Portal” is collection of rare, uncommon, and infrequently held materials brought together to facilitate Catholic studies. It includes some full text materials, and they are linked to text mining services.
In this blog posting a few works by Charles Dickens are compared & contrasted. The comparisons include size and word/phrase usage.
This blog posting describes how a timeline was created by plotting the publication dates of RSS feeds.
After extracting the names and places from a text, this service grabs Linked Data from DBedia, displays a descriptive paragraph, and allows the reader to look the name or place up in Wikipedia and/or plot it on a world map. This service is specifically designed for mobile devices.
This blog posting elaborates on how various parts of speech were used in a number of selected classic works.
The “greatness” of the Great Books was evaluated in a number of blog postings, and the two listed here give a good overview of the methodology.
In our mind, the combination of digital humanities computing techniques — like all the services against texts outined above — and the practices of librarianship would be a marriage made in heaven. By supplementing the DPLA’s collections with full text materials and then enhancing its systems to facilitate text mining and natural language processing, the DPLA can not only make it easier for readers to find data and information, but it can also make that data and information easier to use & understand.
We know the ideas outlined in this proposal are not typical library functions. But we also apprehend the need to take into account the changing nature of the information landscape. Digital content lends itself to a myriad of new possibilities. We are not saying analog forms of books and journals are antiquated nor useless. No, far from it. Instead, we believe the library profession has figured out pretty well how to exploit and take advantage of that medium and its metadata. On the other hand, the posibilities for full text digital content are still mostly unexplored and represent a vast untapped potencial. Building on and expanding on the education mission of libraries, services against texts may be a niche the profession — and the DPLA — can help fill. The services & tools described in this proposal are really only examples. Any number of additional services against texts could be implemented. We are only limited by our ability to think of action words denoting the things people want to do with texts once they find & get them. By augmenting a library’s traditional functions surrounding collection and sevices with the sorts of things described above, the role of libraries can expand and evolve to include use & understand.
Eric Lease Morgan considers himself to be a librarian first and a computer user second. His professional goal is to discover new ways to use computers to provide better library service. He has a BA in Philosophy from Bethany College in West Virginia (1982), and an MIS from Drexel University in Philadelphia (1987).
While he has been a practicing librarian for more than twenty years he has been writing software for more than thirty. He wrote his first library catalog in 1989, and it won him an award from Computers in Libraries Magazine. In a reaction to the “serials pricing crisis” he implemented the Mr. Serials Process to collect, organize, archive, index, and disseminate electronic journals. For these efforts he was awarded the Bowker/Ulrich’s Serials Librarianship Award in 2002. An advocate of open source software and open access publishing since before the phrases were coined, just about all of his software and publications are freely available online. One of his first pieces of open source software was a database-driven application called MyLibrary, a term which has become a part of the library vernacular.
As a member of the LITA/ALA Top Technology Trends panel for more than ten years, as well as the owner/moderator of a number of library-related mailing lists (Code4Lib, NGC4Lib, and Usability4Lib), Eric has his fingers on the pulse of the library profession. He coined the phrase “‘next-generation’ library catalog”. More recently, Eric has been applying text mining and other digital humanities computing techniques to his Alex Catalogue of Electronic Texts which he has been maintaining since 1994. Eric relishes all aspects of librarianship. He even makes and binds his own books. In his spare time, Eric plays blues guitar and Baroque recorder. He also enjoys folding origami, photography, growing roses, and fishing.
This is a tiny Catholic Youth Literature Project update.
Using a Perl module called Lingua::Fathom I calculated the size (in words) and readability scores of all the documents in the Project. I then updated the underlying MyLibrary database with these values, as well as wrote them back out again to the “catalog”. Additionally, I spent time implementing the concordance. The interface is not very iPad-like right now, but that will come. The following (tiny) screen shots illustrate the fruits of my labors.
Give it a whirl and tell me what you think, but remember, it is designed for iPad-like devices.
2011-08-31T01:43:36+00:00 Life of a Librarian: Catholic Youth Literature Project: A Beginning http://sites.nd.edu/emorgan/2011/08/catholic-youth-literature-project-a-beginning/This posting outlines some of the beginnings behind the Catholic Youth Literature Project.
The Catholic Youth Literature Project is about digitizing, teaching, and learning from public domain literature from the 1800’s intended for Catholic children. The idea is to bring together some of this literature, make it easily available for downloading and reading, and enable learners to “read” texts in new & different ways. I am working with Jean McManus, Pat Lawton, and Sean O’Brien on this Project. My specific tasks are to:
Written (and spoken) language follow sets of loosely defined rules. If this were not the case, then none of us would be able to understand one another. If I have digital versions of books, I can use a computer to extract and tabulate the words/phrases it contains, once that is done I can then look for patterns or anomalies. For example, I might use these tools to see how Thoreau uses the word “woodchuck” in Walden. When I do I see that he doesn’t like woodchucks because they eat his beans. In addition, I can see how Thoreau used the word “woodchuck” in a different book and literally see how he used it differently. In the second book he discusses woodchucks in relation to other small animals. A reader could learn these things through the traditional reading process, but the time and effort to do so is laborious. These tools will enable the reader to do such things across many books at the same time.
In the Spring O’Brien is teaching a class on children and Catholicism. He will be using my tool as a part of his class.
I do not advocate this tool as a replacement for traditional “close” reading. This is a supplement. It is an addition. These tools are analogous to tables-of-contents and back-of-the-book indexes. Just because a person reads those things does not mean they understand the book. Similarly, just because they use my tools does not mean they know what the book contains.
I have created the simplest of “catalogs” so far, and here is screen dump:
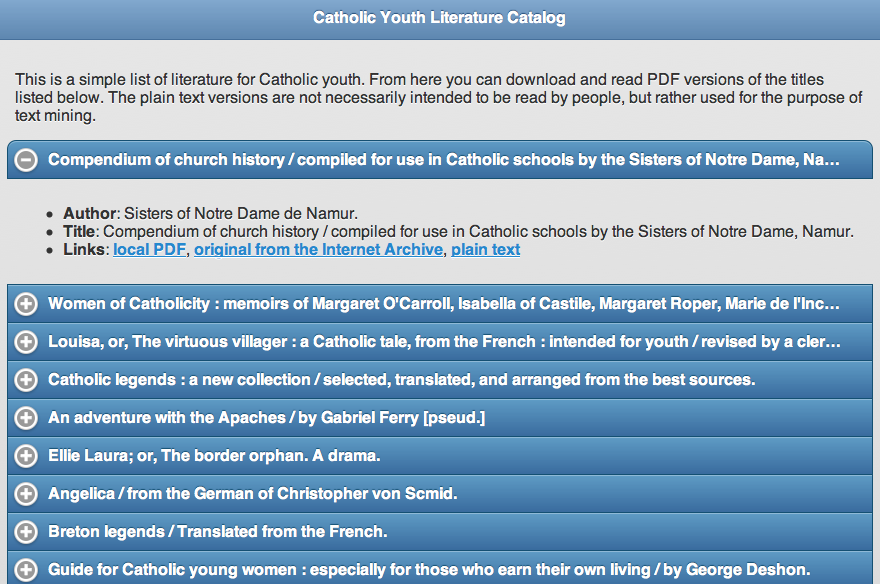
Catholic Youth Literature Project catalog
You can also try the “catalog” for yourself, but remember, the interface is designed for iPads (and other Webkit-based browsers). Your milage may vary.
Wish us luck, and ‘more later.
The 5th Annual Hesburgh Libraries Pot-Luck Picnic And Mini-Disc Tournament was an unqualified success. Around seventy-five people met to share a meal and themselves. I believe this was the biggest year for the tournament with about a dozen teams represented. Team Hanstra took away the trophy after a sudden death playoff against Team Procurement. Both teams had scores of 20. “Congrats, Team Hanstra! See you next year.”
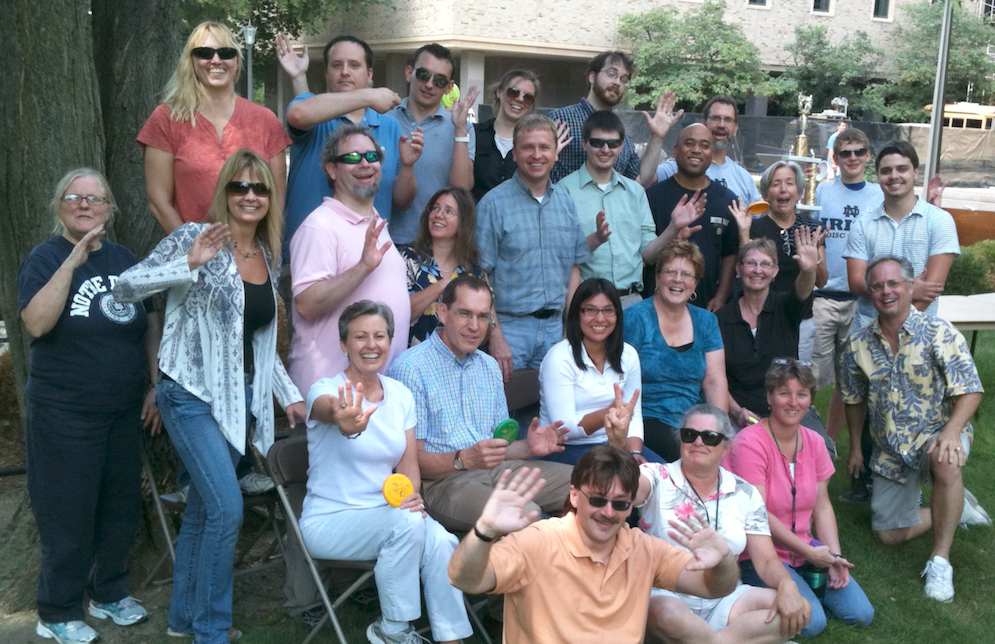
Disc Golfers
From the picnic’s opening words:
Libraries are not about collections. Libraries are not about public service. Libraries are not about buildings and spaces. Libraries are not about books, journals, licensed content, nor computers. Instead, libraries are about what happens when all of these things are brought together into a coherent whole. None of these things are more important than the others. None of them come before the others. They are all equally important. They all have more things in common than differences.
That is what this picnic is all about. It is about sharing time together and appreciating our similarities. Only through working together as a whole will we be able to accomplish our goal — providing excellent library services to this, the great University of Notre Dame.
Gotta go. Gotta throw.
2011-08-22T23:15:51+00:00 Life of a Librarian: Code4Lib Midwest: A Travelogue http://sites.nd.edu/emorgan/2011/08/code4lib-midwest-a-travelogue/This is a travelogue documenting my experiences at second Code4Lib Midwest Meeting (July 28 & 29, 2011) at the University of Illinois, Chicago.
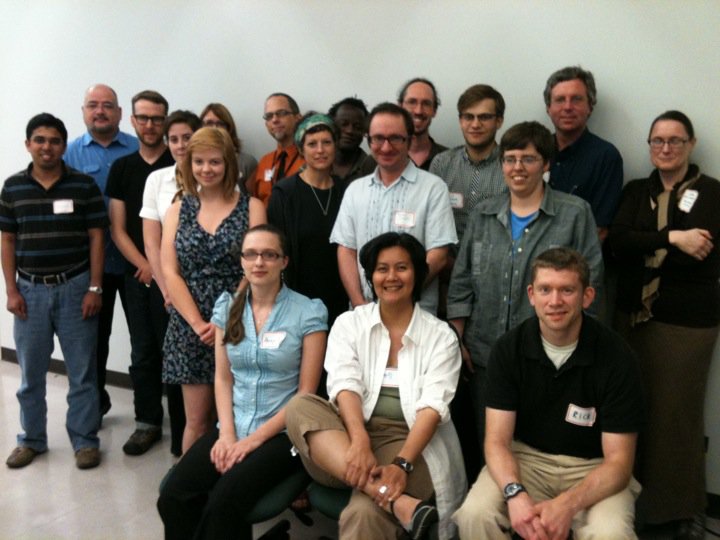
Attendees of Code4Lib Midwest
The meeting began with a presentation by Peter Schlumpf (Avanti Library Systems). In it he described and demonstrated Avanti Nova, an application used to create and maintain semantic maps. To do so, a person first creates objects denoted by strings of characters. This being Library Land, these strings of characters can be anything from books to patrons, from authors to titles, from URLs to call numbers. Next a person creates links (relationships) between objects. These links are seemingly simple. One points to another, vice versa, or the objects link to each other. The result of these two processes forms a thing Schlumpf called a relational matrix. Once the relational matrix is formed queries can be applied against it and reports can be created. Towards the end of the presentation Schlumpf demonstrated how Avanti Nova could be used to implement a library catalog as well as represent the content of a MARC record.
Robert Sandusky (University of Illinois, Chicago) shared with the audience information about a thing called the DataOne Toolkit. DataOne is a federation of data repositories including nodes such as Dryad, MNs, and UC3 Merritt. The Toolkit supports an application programmer interface to support three levels of federation compliance: read, write, and replicate. I was particularity interested in DataOne’s data life cycle: collect, assure, describe, deposit, preserve, discover, integrate, analyze, collect. I also liked the set of adjectives and processes used to describe the vision of DataOne: adaptive, cognitive, community building, data sharing, discovery & access, education & training, inclusive, informed, integrate and synthesis, resilient, scalable, and usable. Sandusky encouraged members of the audience (and libraries in general) to become members of DataOne as well as community-based repositories. He and DataOne see libraries playing a significant role when it comes to replication of research data.
Somewhere in here I, Eric Lease Morgan (University of Notre Dame), spoke to the goals of the Digital Public Library of America (DPLA) as well as outlined my particular DPLA Beta-Sprint Proposal. In short, I advocated the library community move beyond the process of find & get and towards the process of use & understanding.
Ken Irwin (Wittenberg University) gave a short & sweet lightning talk about “hacking” trivial projects. Using an example from his workplace — an application used to suggest restaurants — he described how he polished is JQuery skills and enhanced is graphic design skills. In short he said, “There is a value for working on things that are not necessarily library-related… By doing so there is less pressure to do it ‘correctly’.” I thought these were words of wisdom and point to the need for play and experimentation.
Rick Johnson (University of Notre Dame) described how he and his group are working in an environment where the demand is greater than the supply. Questions he asked of the group, in an effort to create discussion, included: how do we move from a development shop to a production shop, how do we deal with a backlog of projects, to what degree are we expected to address library problems versus university problems, to what extent should our funding be grant-supported and if highly, then what is our role in the creation of these grants. What I appreciated most about Johnson’s remarks was the following: “A library is still a library no matter what medium they collect.” I wish more of our profession expressed such sentiments.
Margaret Heller (Dominican University) asked the question, “How can we assist library students learn a bit of technology and at the same time get some work done?” To answer her question she described how her students created a voting widget, did an environmental scan, and created a list of library labs.
Christine McClure (Illinois Institute of Technology) was given the floor, and she was seeking feedback in regards to here recently launched mobile website. Working in a very small shop, she found the design process invigorating since she was not necessarily beholden to a committee for guidance. “I work very well with my boss. We discuss things, and I implement them.” Her lightning talk was the first of many which exploited JQuery and JQuery Mobile, and she advocated the one-page philosophy of Web design.
Jeremy Prevost (Northwestern University) built upon the McClure’s topic by describing how he built a mobile website using a Model View Controller (MVC) framework. Using such a framework, which is operating system and computer programming language agnostic, accepts a URL as input, performs the necessary business logic, branches according to the needs/limitations of the HTTP user-agent, and returns the results appropriately. Using MVC he is able to seamlessly provide many different interfaces to his website.
If a poll had been taken on the best talk of the Meeting, then I think Matthew Reidsma‘s (Grand Valley State University) presentation would have come out on top. In it he drove home two main points: 1) practice “progressive enhancement” Web design as opposed to “graceful degradation”, and 2) use JQuery to control the appearance and functionality of hosted Web content. In the former, single Web pages are designed in a bare bones manner, and through the use of conditional Javascript logic and cascading stylesheets the designer implements increasingly complicated pages. This approach works well for building mobile websites through full-fledged desktop browser interfaces. The second point — exploiting JQuery to control hosted pages — was very interesting. He was given access to the header and footer of hosted content (Summon). He then used JQuery’s various methods to read the body of the pages, munge it, and present more aesthetically pleasing as well as more usable pages. His technique was quite impressive. Through Reidsma’s talk I also learned the necessity of many skills to do Web work. It is not enough to know how HTML or Javascript or graphic design or database management or information architecture, etc. Instead, it is necessary to have a combination of these skills in order to really excel. To a great degree Riedsma embodied such a combination.
Francis Kayiwa (University of Illinois, Chicago) wrapped up the first day by asking the group questions about hosting and migrating applications from different domains. The responses quickly turned to things about EAD files, blogs postings, and where the financial responsibility lies when grant money dries up. Ah, Code4Lib. You gotta love it.
The second day was given over to three one-hour presentations. The first was by Rich Wolf (University of Illinois, Chicago) who went to excruciating detail on how to design and write RESTful applications using Objective-C.
My presentation on text mining might have been as painful for others. In it I tried to describe and demonstrate how libraries could exploit the current environment to provide services against texts through text mining. Examples included the listing of n-grams and their frequencies, concordances, named-entity extractions, word associations through network diagrams, and geo-locations. The main point of the presentation was “Given the full text of documents and readily accessible computers, a person can ‘read’ and analyze a text in so many new and different ways that would not have been possible previously.”
The final presentation at the Meeting was by Margaret Kipp (University of Wisconsin Milwaukee), and it was called “Teaching Linked Data”. In it she described and demonstrated how she was teaching library school students about mash-ups. Apparently her students have very little computer experience, and the class surrounded things like the shapes of URLs, the idea of Linked Data, and descriptions of XML and other data streams like JSON. Using things like Fusion tables, Yahoo Pipes, Simile Timelines, and Google Maps students were expected to become familiar with new uses for metadata and open data. One of the nicest things I heard from Kipp was, “I was also trying to teach the students about programatic thinking.” I too think such a thing is important; I think it important to know how to think both systematically (programmatically) as well as analytically. Such thinking processes complement each other.
From my perspective, the Meeting was an unqualified success. Kudos go to Francis Kayiwa, Abigail Goben, Bob Sandusky, and Margaret Heller for organizing the logistics. Thank you! The presentations were on target. The facilites were more than adequate. The wireless network connections were robust. The conversations were apropos. The company was congenial. The price was right. Moreover, I genuinely believe everybody went away from the Meeting learning something new.
I also believe these sorts of meetings demonstrate the health and vitality of the growing Code4Lib community. The Code4Lib mailing list boasts about 2,000 subscribers who are from all over the world but mostly in the United States. Code4Lib sponsors an annual meeting and regularly occurring journal. Regional meetings, like this one in Chicago, are effective and inexpensive professional development opportunities for people who are unable or uncertain about the full-fledged conference. If these meetings continue, then I think we ought to start charging a franchise fee. (Just kidding, really.)
I was asked the other day about ways to make people aware of open access journal publications, and this posting echoes much of my response.
Thanks again for taking the time this morning to discuss some of the ways open-access journals are using social media and other technology to distribute content and engage readers. I am on the board of [name deleted] recently transitioned to an open access format, and we are looking to maximize the capabilities of this new, free, and on-line format. To that end, any additional insights you might be able to share about effective social media applications for open-access sources, or other exemplary electronic journals you may be able to recommend, would be most helpful.
As you know, I have not been ignoring you as much as I have been out of town. Thank you for your patience.
I am only able to share my personal experiences here, and they are not intended to be standards of best practices. Yet, here are some ideas:
The right software makes many of the tasks I outlined easier. I suggest you take a look at Open Journal Systems.
Good luck, and I commend you for going the open access route.
This posting describes a poor man’s restoration process.
Yesterday, I spent about an hour and a half writing down a work/professional to-do list intended to span the next few months. I prioritized things, elaborated on things, and felt I like had the good beginnings of an implementable plan.
I put the fruits of my labors into my pocket and then went rowing around in my boat. After my swim and on the way back to the dock I realized my to-do list was still in my pocket. Sigh. After pulling it out I and seeing the state it was in, I decided to try to salvage it. Opening it up was difficult. Naturally, the paper tore, but I laid it down as flat as I could. I went home to get a few pieces of paper to support and sandwich my soaked to-do list. For the next few hours, as the paper dried in the hot weather we are experiencing, I continually flipped and turned the to-do list so it would not stick to its supports.
 Page #1 |
 Page #2 |
This morning, after the list was was a dry as it was going to be, I photographed both sides of it, did my best color-correct the image, converted the whole thing into a PDF file, and printed the result. While the it looks like heck, the time I spent salvaging my intellectual efforts were much shorter than the time I would have spent recreating the list. Like a blues, such recreations are never exactly the same as the originals. But it would have been a whole lot better if I hadn’t gone swimming with my to-do list in the first place.
I might not have done this restoration process in the “best” way, but that does not detract from the effort itself. I really do enjoy all aspects of library work.
2011-07-25T15:05:28+00:00 Mini-musings: My DPLA Beta-Sprint Proposal: The movie http://infomotions.com/blog/2011/07/my-dpla-beta-sprint-proposal-the-movie/Please see my updated and more complete Digital Public Library of America Beta-Sprint Proposal. The following posting is/was a precursor.
The organizers of the Digital Public Library of America asked the Beta-Sprint Proposers to create a video outlining the progress of their work. Below is the script of my video as well as the video itself. Be gentle with me. Video editing is difficult.
2011-07-22T18:29:44+00:00 Life of a Librarian: Trip to the Internet Archive, Fort Wayne (Indiana) http://sites.nd.edu/emorgan/2011/07/trip-to-the-internet-archive-fort-wayne-indiana/Introduction
My name is Eric Morgan. I am a Digital Projects Librarian here at the University of Notre Dame, and I am going to outline, ever so briefly, my Digital Public Library of America Beta-Sprint Proposal. In a nutshell, the Proposal describes, illustrates, and demonstrates how the core functionality of a library can move away from “find & get” and towards “use & understand”.
Find & get
With the advent of ubiquitous and globally networked computers, the characteristics of data and information have fundamentally changed. More specifically, things like books and journals — the traditional meat and potatoes of libraries — no longer need to be manifested in analog forms, and their digital manifestations lend themselves to new functionality. For example, digital versions of books and journals can be duplicated exactly, and they are much less limited to distinct locations in space and time. This, in turn, has made things like the search engines of Google, Yahoo, and Microsoft a reality. Compared to twenty years ago, this has made the problem of find & get much less acute. While the problem of find & get will never completely be resolved, many people feel the problem is addressed simply enough. Enter a few words into a search box, click Go, and select items of interest.
Use & undertand
The problem of find & get is always a means to an end, and not the end itself. People want to do things with the content they find. I call these things “services against texts” and they are denoted by action verbs such as analyze, annotate, cite, compare & contrast, confirm, delete, discuss, evaluate, find opposite, find similar, graph & visualize, learn from, plot on a map, purchase, rate, read, review, save, share, summarize, tag, trace idea, or transform. Thus, the problem of find & get is evolving into the problem of use & understand. I ask myself, “What services can be provisioned to make the sense of all the content one finds on the Internet or in a library?” In my opinion, the answer lies in the combination of traditional library principles and the application of computer science. Because libraries are expected to know the particular information needs of their constituents, libraries are uniquely positioned to address the problem of use & understand. Not Google. Not Yahoo. Not Microsoft.
Examples
How do we go about doing this? We begin by exploiting the characteristics of the increasingly available of full text content. Instead of denoting the length of a book by the number of pages it contains, we measure it by the number of words. Thus, we will be able to unambiguously compare & contrast the lengths of documents. By analyzing the lengths of paragraphs, the lengths of sentences, and the lengths of words in a document, we will be able to calculate readability scores, and we will be better able to compare & contrast the intended reading levels of a book or article. By tabulating the words or phrases in multiple documents and then comparing those tabulations with each other libraries will make it easier for readers to learn about the similarities and differences between items in a corpus. Such a service will enable people to answer questions like, “How does the use of the phrase ‘good man’ differ between Plato, Aristotle, and Shakespeare?” If there were tools aware of the named people and places in a document, then a reader’s experience could be enriched with dynamic annotations and plots on a world map. Our ability to come up with ideas for additional services against texts is only limited by our imagination and our ability to understand the information needs of our clientele. My Beta Sprint Proposal demonstrates how many of these ideas can be implemented today and with the currently available technology.
Thank you
Thank you for the opportunity to share some of my ideas about the Digital Public Library of America, my Beta Sprint Proposal, and the role of libraries in the near future.
This is the tiniest of travelogues describing a field trip to a branch of the Internet Archive in Fort Wayne (Indiana), July 11, 2001.
Here at the Hesburgh Libraries we are in the midst of a digitization effort affectionately called the Catholic Pamphlets Project. We have been scanning away, but at the rate we are going we will not get done until approximately 2100. Consequently we are considering the outsourcing of the scanning work, and the Internet Archive came to mind. In an effort to learn more about their operation, a number of us went to visit a branch of the Internet Archive, located at the Allen County Public Library in Fort Wayne (Indiana), on Monday, July 11, 2011.
When we arrived we were pleasantly surprised at the appearance of the newly renovated public library. Open. Clean. Lots of people. Apparently the renovation caused quite a stir. “Why spend money on a public library?” The facilities of the Archive, on the other hand, were modest. It is located in the lower level of the building with no windows, cinderblock walls, and just a tiny bit cramped.
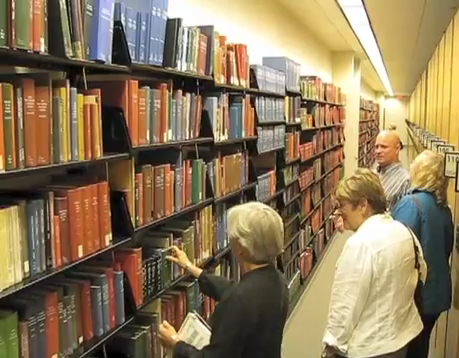 Internet Archive, the movie! |
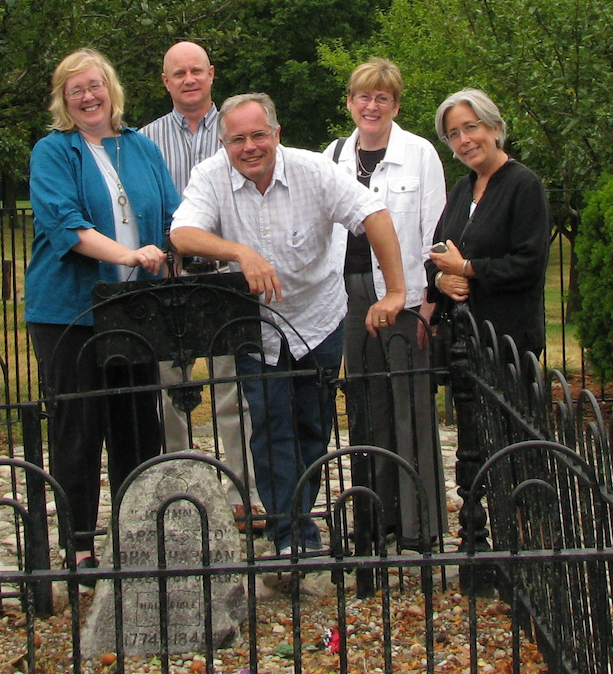 Pilgimage to Johnny Appleseed’s grave |
We were then given a tour of the facility and learned about the workflow. Books arrive in boxes. Each book is associated with bibliographic metadata usually found in library catalogs. Each is assigned a unique identifier. The book is then scanned in a “Scribe”, a contraption cradling the book in a V-shape while photographing each page. After the books are digitized they are put through a bit of a quality control process making sure there are no missing pages, blurry images, or pictures of thumbs. Once that is complete the book’s images and metadata are electronically sent to the Internet Archive’s “home planet” in San Francisco for post-processing. This is where the various derivatives are made. Finally, the result is indexed and posted to the ‘Net. People are then free to download the materials and do with them just about anything they desire. We have sent a number of our pamphlets to the Fort Wayne facility and you can see the result of the digitization process.
From my point of view, working with the Internet Archive sounds like a good idea, especially if one or more of their Scribes comes to live here in the Libraries. All things considered, their services are inexpensive. They have experience. They sincerely seem to have the public good at heart. They sure are more transparent than the Google Books project. Digitization by the Internet Archive may be a bit challenging when it comes to items not in the public domain, but compared to the other issues I do not think this is a very big issue.
To cap off our visit to Fort Wayne we made a pilgrimage to Johnny Appleseed’s (John Chapman’s) grave. A good time was had by all.
2011-07-18T17:52:49+00:00 Readings: DraftReportWithTransclusion http://www.w3.org/2005/Incubator/lld/wiki/DraftReportWithTransclusion Makes the case for Linked Data in libraries. Distinguished between metadata elements, value vocabularies, and data sets. Advocated the Semantic Web as a way for people to "follow their nose", or, in other words, facilitate browse. A cool quote included, "In a sea of RDF triples, no developer is an island", and echoed "The best thing to do with your data will be thought of by somebody else." Was aptly critical of the professions slowness to change, lack of the necessary resources, and top-down approach to standards creation. Contrasted library metadata as record-based and Web metadata as graph based.This posting outlines an initiative colloquially called the Catholic Pamphlets Project, and it outlines the current state of the Project.
Earlier this year the Hesburgh Libraries was awarded a “mini-grant” from University administration to digitize and make accessible a set of Catholic Americana. From the proposal:
The proposed project will enable the Libraries and Archives to apply these [digital humanities computing] techniques to key Catholic resources held by the University. This effort supports and advances the Catholic mission of the University by providing enhanced access to significant Catholic scholarship and facilitating the discovery of new knowledge. We propose to create an online collection of Catholic Americana resources and to develop and deploy an online discovery environment that allows users to search metadata and full-text documents, and provides them with tools to interact with the documents. These web-based tools will support robust keyword searching within and across texts and the ability to analyze texts and detect patterns across documents using tools such as charts, graphs, timelines, etc.
A part of this Catholic Americana collection is a sub-collection of about 5,000 Catholic pamphlets. With titles like The Catholic Factor In Urban Welfare, About Keeping Your Child Healthy, and The Formation Of Scripture the pamphlets provide a rich fodder for research. We are currently in the process of digitizing these pamphlets, thus the name, the Catholic Pamphlets Project.
While the Libraries has digitized things in the past, previous efforts have not been holistic nor as large in scope. Because of the volume of materials, in both analog and digital forms, the Catholic Pamphlets Projects is one of the larger digitization projects the Libraries has undertaken. Consequently, it involves just about every department: Collection Development, Special Collections, Preservation, Cataloging, Library Systems, and Public Services. To date, as many as twenty different people have been involved, and the number will probably grow.
What are we going to actually do? What objectives are we going to accomplish? The answer to these questions fall into four categories, listed here in no priority order:
Towards these ends, a number of things have been happening. For example, catalogers have been drawing up new policies. And preservationists have been doing the same. Part-time summer help has been hired. They are located in our Art Slide Library and have digitized just less than two dozen items. As of this afternoon, summer workers in the Engineering Library are lending a scanning hand too. Folks from Collection Development are determining the copyright status of pamphlets. The Libraries is simultaneously building a relationship with the Internet Archive. A number of pamphlets have been sent to them, digitized, and returned. For a day in July a number of us plan on visiting an Internet Archive branch office in Fort Wayne to learn more. Folks from Systems have laid down the infrastructure for the text mining, a couple of text mining orientation sessions have been facilitated, and about two dozen pamphlets are available for exploration.
The Catholic Pamphlets Project is something new for the Hesburgh Libraries, and it is experiencing incremental progress.
2011-06-21T01:33:28+00:00 Mini-musings: DPLA Beta Sprint Submission http://infomotions.com/blog/2011/06/dpla-beta-sprint-submission/I decided to give it a whirl and particpate in the DPLA Beta Sprint, and below is my submission:
2011-06-20T20:38:26+00:00 Readings: Digging into data using new collaborative infrastructures supporting humanities-based computer science research http://firstmonday.org/htbin/cgiwrap/bin/ojs/index.php/fm/article/view/3372/2950 Describes some of the challenges and solutions to collaborative humanities research surrounding digital content -- "his paper explores infrastructure supporting humanities–computer science research in large–scale image data by asking: Why is collaboration a requirement for work within digital humanities projects? What is required for fruitful interdisciplinary collaboration? What are the technical and intellectual approaches to constructing such an infrastructure? What are the challenges associated with digital humanities collaborative work?... The paper covers a range of research problems encountered in humanities endeavors that require computer science research and a collaborative infrastructure. We documented specific challenges as encountered in the Digging into Data to Answer Authorship–Related Questions project and described collaborative technologies deployed for the DID project."DPLA Beta Sprint Submission
My DPLA Beta Sprint submission will describe and demonstrate how the digitized versions of library collections can be made more useful through the application of text mining and various other digital humanities computing techniques.
Full text content abounds, and full text indexing techniques have matured. While the problem of discovery will never be completely solved, it is much less acute than it was even a decade ago. Whether the library profession or academia believes it or not, most people do not feel as if they have a problem finding data, information, and knowledge. To them it is as easy as entering a few words or phrases into a search box and clicking Go.
It is now time to move beyond the problem of find and spend increased efforts trying to solve the problem of use. What does one do with all the information they find and acquire? How can it be put into the context of the reader? What actions can the reader apply against the content they find? How can it be compared & contrasted? What makes one piece of information — such as a book, an article, a chapter, or even a paragraph — more significant than another? How might the information at hand be used to solve problems or create new insights?
There is no single answer to these questions, but this submission will describe and demonstrate one set of possibilities. It will assume the existence of full text content of just about any type — such as books the Internet Archive, open access journals, or blog postings. It will outline how these texts can be analyzed to find patterns, extract themes, and identify anomalies. It will describe how entire corpora or search results can be post-processed to not only refine the discovery process but also make sense of the results and enable the reader to quickly grasp the essence of textual documents. Since actions speak louder than words, this submission will also present a number of loosely joined applications demonstrating how this analysis can be implemented through Web browsers and/or portable computing devices such as tablet computers.
By exploiting the current environment — full text content coupled with ubiquitous computing horsepower — the DPLA can demonstrate to the wider community how libraries can remain relevant in the current century. This submission will describe and demonstrate a facet of that vision.
Next-generation library catalogs are really indexes, not catalogs, and increasingly the popular name for such things is “discovery system”. Examples include VuFind, Primo combined with Primo Central, Blacklight, Summon, and to a lesser extent Koha, Evergreen, OLE, and XC. While this may be a well-accepted summary of the situation, I really do not think it goes far enough. Indexers address the problem of find, but in my opinion, find is not the problem to be solved. Everybody can find. Most people believe Google has all but solved that problem. Instead, the problem to solve is use. Just as much as people want to find information, they want to use it, to put it into context, and to understand it. With the advent of so much full text content, the problem of find is much easier to solve than it used to be. What is needed is a “next-generation” library catalog including tools and interfaces designed to make the use and understanding of information easier. Both the “Catholic Portal” and the discovery systems of the Hesburgh Libraries at the University of Notre Dame are beginning to implement some of these ideas. When it comes to “next-generation” library catalogs we might ask the question, “Are we there yet?”. I think the answer is, “No, not yet.”
This text was originally written for a presentation to the Rare Books and Manuscripts Section of the American Library Association during a preconference meeting, June 23, 2011. It is available in a number of formats including this blog posting, a one-page PDF document intended as a handout, and an ePub file.
There are currently a number of discovery systems from which a library can choose, and it is very important to note that they have more things in common than differences. VuFind, Primo combined with Primo Central, Summon, and Blacklight are all essentially indexer/search engine combinations. Even more, they all use same “free” and open source software — Lucene — at their core. All of them take some sort of bibliographic data (MARC, EAD, metadata describing journal articles, etc.), stuff it into a data structure (made up authors, titles, key words, and control numbers), index it in the way the information retrieval community has been advocating for at least the past twenty years, and finally, provide a way to query the index with either one-box-one-button or fielded interfaces. Everything else — facets, cover art, reviews, favorites, etc. — is window dressing. When and if any sort of OCLC/EBSCOHost combination manifests itself, I’m sure the underlying technology will be very similar.
Koha, Evergreen, and OLE (Open Library Environment) are more traditional integrated library systems. They automate traditional library processes. Acquisitions. Cataloging. Serials Control. Circulation. Etc. They are database applications, not indexers, designed to manage an inventory. Search — the “OPAC” — is one of these processes. The primary difference between these applications and the integrated library systems of the recent past is their distribution mechanism. Koha and Evergreen are open source software, and therefore as “free as a free kitten”. OLE is still in development, but will be distributed as open source. Everything else is/was licensed for a fee.
When talking about “next-generation” library catalogs and “discovery systems”, many people allude to the Extensible Catalog (XC) which is not catalog nor an index. More accurately, it is system enabling and empowering the library community to manage and transform its bibliographic data on a massive scale. It offer ways for a library to harvest content from OAI-PMH data repositories (such as library catalogs), do extensive find/replace or enhancement operations against the harvested data, expose the result via OAI-PMH again, and finally, support the NCIP protocol so the circulation status of items found in an index can be determined. XC is middleware designed to provide functionality between an integrated library system and discovery system.
With the availability of wide-spread full text indexing, the need to organize content according to a classification system — to catalog items — has diminished. This need is not negated, but it is not as necessary as it used to be. In the past, without the availability of wide-spread full text indexing, classification systems provided two functions: 1) to organize the collection into a coherent whole with sub-parts, and 2) to surrogate physical items enumerated in a list. The aggregate of metadata elements — whether they be titles, authors, contributors, key words, subject terms, etc. — acted as “dummies” for the physical item containing the information. They are/were pointers to the book, the journal article, the piece of sheet music, etc. With the advent of wide-spread full text indexing, these two functions are not needed as much as they were in the past. Through the use of statistical analysis and direct access to the thing itself, indexers/search engines make the organization and discovery of information easier and less expenses. Note, I did not say “better”, just simpler and with greater efficiency.
Because wide-spread full text indexing abounds, the problem of find is not as acute as it used to be. In my opinion, it is time to move away from the problem of find and towards the problem of use. What does a person do with the information once they find and acquire it? Does it make sense? Is it valid? Does it have a relationship other things, and if so, then what is that relationship and how does it compare? If these relationships are explored, then what new knowledge might one uncover, or what existing problem might be solved? These are the questions of use. Find is a means to an end, not the end itself. Find is a library problem. Use the problem everybody else wants to solve.
True, classification systems provide a means to discover relationships between information objects, but the predominate classification systems and processes employed today are pre-coordinated and maintained by institutions. As such they posit realities that may or may not match the cognitive perception of today’s readers. Moreover, they are manually applied to information objects. This makes the process literally slow and laborious. Compared to post-coordinated and automated techniques, the manual process of applying classification to information objects is deemed expensive and of diminishing practical use. Put another way, the application of classification systems against information objects today is like icing on a cake, leather trim in a car, or a cherry on a ice cream sundae. They make their associated things richer, but they are not essencial their core purpose. They are extra.
Through the use of a process called text mining, it is possible to provide new services against individual items in a collection as well as to collections as a whole. Such services can make information more useful.
Broadly defined, text mining is an automated process for analyzing written works. Rooted in linguistics, it makes the assumption that language — specifically written language — adheres to sets of loosely defined norms, and these norms are manifested in combinations of words, phrases, sentences, lines of a poem, paragraphs, stanzas, chapters, works, corpora, etc. Additionally, linguistics (and therefore text mining) also assumes these manifestations embody human expressions, meanings, and truth. By systematically examining the manifestations of written language as if they were natural objects, the expressions, meanings, and truths of a work may be postulated. Such is the art and science of text mining.
The process of text mining begins with counting, specifically, counting the number of words (n) in a document. This results in a fact — a given document is n words long. By comparing n across a given corpus of documents, new facts can be derived, such as one document is longer than another, shorter than another, or close to an average length. Once words have been counted they can be tallied. The result is a list of words and their associated frequencies. Some words occur often. Others occur infrequently. The examination of such a list tells a reader something about the given document. The comparison of frequency lists between documents tells the reader even more. By comparing the lengths of documents, the frequency of words, and their existence in an entire corpus a reader can learn of the statistical significance of given words. Thus, the reader can begin to determine the “aboutness” of a given document. This rudimentary counting process forms the heart of most relevancy ranking algorithms of indexing applications and is called “term frequency inverse document frequency” or TFIDF.
Not only can words be tallied but they can be grouped into different parts-of-speech (POS): nouns, pronouns, verbs, adjectives, adverbs, prepositions, function (“stop”) words, etc. While it may be interesting to examine the proportional use of each POS, it may be more interesting to examine the individual words in each POS. Are the personal pronouns singular or plural? Are they feminine or masculine? Are the names of places centered around a particular geographic location? Do these places exist in the current time, a time in the past, or a time in future? Compared to other documents, is there a relatively higher or lower use of color words, action verbs, names of famous people, or sets of words surrounding a particular theme? Knowing the answers to these questions can be quite informative. Just as these processes can be applied to words they can be applied to phrases, sentences, paragraphs, etc. The results can be charted, graphed, and visualized. They can be used to quickly characterize single documents or collections of documents.
The results of text mining processes are not to be taken as representations of truth, any more than the application of Library of Congress Subject Headings completely denote the aboutness of text. Text mining builds on the inherent patterns of language, but language is fluid and ambiguous. Therefore the results of text mining lend themselves to interpretation. The results of text mining are intended to be indicators, guides, and points of reference, and all of these things are expected to be interpreted and then used to explain, describe, and predict. Nor is text mining intended to be a replacement for the more traditional process of close reading. The results of text mining are akin to a book’s table of contents and back-of-the-book index. They outline, enumerate, and summarize. Text mining does the same. It is a form of analysis and a way to deal with information overload.
Assuming the availability of increasing numbers of full text information objects, a library’s “discovery system” could easily incorporate text mining for the purposes of enhancing the traditional cataloging process as well as increasing the usefulness of found material. In my opinion, this is the essence of a true “next-generation” library catalog.
An organization called the Catholic Research Resources Alliance (CRRA) brings together rare, uncommon, and infrequently held materials into a thing colloquially called the “Catholic Portal”. The content for the Portal comes from a variety of metadata formats (MARC, EAD, and Dublin Core) harvested from participating member institutions. Besides supporting the Web 2.0 features we have all come to expect, it also provides item level indexing of finding aids, direct access to digitized materials, and concordancing services. The inclusion of concordance features makes the Portal more than the usual discovery system.
For example, the St. Michael’s College at the University of Toronto is a member of the CRRA. They have been working with the Internet Archive for a number years, and consequently measurable portions of their collection have been digitized. After being given hundreds of Internet Archive unique identifiers, a program was written which mirrored digital content and bibliographic descriptions (MARC records) locally. The MARC records were ingested into the Portal (an implementation of VuFind), and search results were enhanced to include links to both the locally mirrored content as well as the original digital surrogate. In this way, the Portal is pretty much just like any other discovery system. But the bibliographic displays go further because they contain links to text mining interfaces.

The “Catholic Portal”
Through these interfaces, the reader can learn many things. For example, in a book called Letters Of An Irish Catholic Layman the word “catholic” is one of the most frequently used. Using the concordance, the reader can see that “Protestants and Roman Catholics are as wide as the poles asunder”, and “good Catholics are not alarmed, as they should be, at the perverseness with which wicked men labor to inspire the minds of all, but especially of youth, with notions contrary to Catholic doctrine”. This is no big surprise, but instead a confirmation. (No puns intended.) On the other hand, some of the statistically most significant two-word phrases are geographic identities (“upper canada”, “new york”, “lake erie”, and “niagara falls”) . This is interesting because such things are not denoted in the bibliographic metadata. Moreover, a histogram plotting where in the document “niagra fals” occurs can be juxtaposed with a similar histogram for the word “catholic”. Why does the author talk about Catholics when they do not talk about upstate New York? Text mining makes it easier to bring these observations to light in a quick and easy-to-use manner.

Concordance highlighting geographic two-word phrases

Where the word “catholic” is located in the text

Where “niagra falls” is located in the text
Some work being done in the The Hesburgh Libraries at the University of Notre Dame is in the same vein. Specifically, the Libraries is scanning Catholic pamphlets, curating the resulting TIFF images, binding them together to make PDF documents, embedding the results of OCR (optical character recognition) into the PDFs, saving the PDFs on a Web server, linking to the PDFs from the catalog and discovery system, and finally, linking to text mining services from the catalog and discovery system. Consequently, once found, the reader will be able to download a digitized version of a pamphlet, print it, read it in the usual way, and analyze it for patterns and meanings in ways that may have been overlooked through the use of traditional analytic methods.
Are we there yet? Has the library profession solved the problem of “next-generation” library catalogs and discovery systems? In my opinion, the answer is, “No.” To date the profession continues to automate its existing processes without truly taking advantage of computer technology. The integrated library systems are more open than they used to be. Consequently control over the way they operate is being transfered from vendors to the library community. The OPACs of yesterday are being replaced with the discovery systems of today. They are easier to use and better meet readers’ desires. They are not perfect. They are not catalogs. But they do make the process of find more efficient.
On the other hand, our existing systems do not take advantage of the current environment. They do not exploit the wide array and inherent functionality of available full text literature. Think of the millions of books freely available from the Internet Archive, Google Books, the HathiTrust, and Project Gutenberg. Think of the thousands of open access journal titles. Think about all the government documents, technical reports, theses & dissertations, conference proceedings, blogs, wikis, mailing list archives, and even “tweets” freely available on the Web. Even without the content available through licensing, this content has the makings of a significant library of any type. The next step is to provide enhanced services against this content — services that go beyond discovery and access. Once done, the library profession moves away from being a warehouse to an online place where data and information can be put into context, used to address existing problems, and/or create new knowledge.
The problem of find as reached the point of diminishing returns. The problem of use is now the problem requiring a greater amount of the profession’s attention.
2011-06-01T14:39:40+00:00 Readings: HathiTrust: A research library at Web scale http://www.hathitrust.org/documents/christenson-lrts-201104.pdf A nice introduction to what the HathiTrust is. -- "Research libraries have a mission to build collections that will meet the research needs o f their user communities over time, to curate these collections to ensure perpetual access, and to facilitate intellectual and physical access to these col- lections as effectively as possible. Recent mass digitization projects as well as finanCial pressures and limited space to store print collections have created a new environment and new challenges for large research libraries. This paper will describe one approach to these challenges: HathiTrust, a shared digital repOSitory owned and operated by a partnership ofmore than forty major libraries."This posting outlines how I refined a number of my RSS feeds and then aggregated them into a coherent whole using Planet.
I have, more or less, been creating RSS (Real Simple Syndication) feeds since 2002. My first foray was not really with RSS but rather with RDF. At that time the functions of RSS and RDF were blurred. In any event, I used RDF as a way of syndicating randomly selected items from my water collection. I never really pushed the RDF, and nothing really became of it. See “Collecting water and putting it on the Web” for details.
In December of 2004 I started marking up my articles, presentations, and travelogues in TEI and saving the result in a database. The webified version of these efforts was something called Musings on Information and Librarianship. I described the database supporting the process is a specific entry called “My personal TEI publishing system“. A program — make-rss.pl — was used to make the feed.
Since then blogs have become popular, and almost by definition, blogs support RSS in a really big way. My RSS was functional, but by comparison, everybody else’s was exceptional. For many reasons I started drifting away from my personal publishing system in 2008 and started moving towards WordPress. This manifested itself in this blog — Mini-Musings.
To make things more complicated, I started blogging on other sites for specific purposes. About a year ago I started blogging for the “Catholic Portal”, and more recently I’ve been blogging about research data management/curation — Days in the Life of a Librarian — at the University of Notre Dame.
In September of 2009 I started implementing a reading list application. Print an article. Read it. Draw and scribble on it. (Read, “Annotate it.”) Scan it. Convert it into a PDF document. Do OCR against it. Save the result to a Web-accessible file system. Do data entry against a database to describe it. Index the metadata and extracted OCR. And finally, provide a searchable/browsable interface to the whole lot. The result is a fledgling system I call “What’s Eric Reading?” Since I wanted to share my wealth (after all, I am a librarian) I created an RSS feed against this system too.
I was on a roll. I went back to my water collection and created a full-fledged RSS feed against it as well. See the simple Perl script — water2rss.pl — to see how easy it is.
Ack! I now have six different active RSS feeds, not counting the feeds I can get from Flickr and YouTube:
That’s too many, even for an ego surfer like myself. What to do? How can I consolidate these things? How can I present my writings in a single interface? How can I make it easy to syndicate all of this content in a standards-compliant way?
The answer to my questions is/was Planet — “an awesome ‘river of news’ feed reader. It downloads news feeds published by web sites and aggregates their content together into a single combined feed, latest news first.”
A couple of years ago the Code4Lib community created an RSS “planet” called Planet Code4Lib — “Blogs and feeds of interest to the Code4Lib community, aggregated.” I think it is maintained by Jonathan Rochkind, but I’m not sure. It is pretty nice since it brings together the RSS feeds from quite a number of library “hackers”. Similarly, there is another planet called Planet Cataloging which does the same thing for library cataloging feeds. This one is maintained by Jennifer W. Baxmeyer and Kevin S. Clarke. The combined planets work very well together, except when individual blogs are in both aggregations. When this happens I end up reading the same blog postings twice. Not a big deal. You get what you pay for.
After a tiny bit of investigation, I decided to use Planet to aggregate and serve my RSS feeds. Installation and configuration was trivial. Download and unpack the distribution. Select an HTML template. Edit a configuration file denoting the location of RSS feeds and where the output will be saved. Run the program. Tweak the template. Repeat until satisfied. Run the program on a regular basis, preferably via cron. Done. My result is called Planet Eric Lease Morgan.

The graphic design may not be extraordinarily beautiful, but the content is not necessarily intended to be read via an HTML page. Instead the content is intended to be read from inside one’s favorite RSS reader. Planet not only aggregates content but syndicates it too. Very, very nice.
I learned a number of things from this process. First I learned that standards evolve. “Duh!”
Second, my understanding of open source software and its benefits was re-enforced. I would not have been able to do nearly as much if it weren’t for open source software.
Third, the process provided me with a means to reflect on the processes of librarianship. My particular processes for syndicating content needed to evolve in order to remain relevant. I had to go back and modify a number of my programs in order for everything to work correctly and validate. The library profession seemingly hates to do this. We have a mindset of “Mark it and park it.” We have a mindset of “I only want to touch book or record once.” In the current environment, this is not healthy. Change is more the norm than not. The profession needs to embrace change, but then again, all institutions, almost by definition, abhor change. What’s a person to do?
Forth, the process enabled me to come up with a new quip. The written word read transcends both space and time. Fun!?
Finally, here’s an idea for the progressive librarians in the crowd. Use the Planet software to aggregate RSS fitting your library’s collection development policy. Programatically loop through the resulting links to copy/mirror the remote content locally. Curate the resulting collection. Index it. Integrate the subcollection and index into your wider collection of books, jourals, etc. Repeat.
2011-05-25T22:54:15+00:00 Life of a Librarian: Research Data Inventory http://sites.nd.edu/emorgan/2011/05/data-set-inventory/This is the home page for the Research Data Inventory.
If you create or manage research data here at the University, then please complete the 10-question form. It will take you less than two minutes. I promise.
Research data abounds across the University of Notre Dame. It comes in many shapes and sizes, and it comes from many diverse disciplines. In order for the University to support research it behooves us to know what data sets exist and how they are characterized. This — the Research Data Inventory — is one way to accomplish this goal.
The aggregated results of the inventory will help the University understand the breadth & depth of the local research data, set priorities, and allocate resources. The more we know about the data sets on campus, the more likely resources will be allocated to make their management easier.
Complete the inventory, and tell your colleagues about it. Your efforts are sincerely appreciated.
2011-05-19T00:03:40+00:00 Mini-musings: Book reviews for Web app development http://infomotions.com/blog/2011/05/book-reviews-for-web-app-development/This is a set of tiny book reviews covering the topic of Web app development for the iPhone, iPad, and iPod Touch.
Unless you’ve been living under a rock for the past three or four years, then you know the increasing popularity of personal mobile computing devices. This has manifested itself through “smart phones” like the iPhone and “tablet computers” like the iPad and to some extent the iPod Touch. These devices, as well as other smart phones and tablet computers, get their network connections from the ether, their screens are smaller than the monitors of desktop computers, and they employ touch screens for input instead of keyboards and mice. All of these things significantly change the user’s experience and thus their expectations.
As a librarian I am interested in providing information services to my clientele. In this increasingly competitive environment where the provision of information services includes players like Google, Amazon, and Facebook, it behooves me to adapt to the wider environment of my clientele as opposed to the other way around. This means I need to learn how to provide information services through mobile computing devices. Google does it. I have to do it too.
Applications for mobile computing devices fall into two categories: 1) native applications, and 2) “Web apps”. The former are binary programs written in compiled languages like Objective-C (or quite possibly Java). These types of applications are operating system-specific, but they are also able to take full advantage of the underlying hardware. This means applications for things like iPhone or iPad can interoperate with the devices’ microphone, camera, speakers, geo-location functions, network connection, local storage, etc. Unfortunately, I don’t know any compiled languages to any great degree, and actually I have little desire to do so. After all, I’m a lazy Perl programmer, and I’ve been that way for almost twenty years.
The second class of applications are Web apps. In reality, these things are simply sets of HTML pages specifically designed for mobiles. These “applications” have the advantage of being operating system independent but are dead in the water without the existence of a robust network connection. These applications, in order to be interactive and meet user expectations, also need to take full advantage of CSS and Javascript, and when it comes to Javascript it becomes imperative to learn and understand how to do AJAX and AJAX-like data acquisition. If I want to provide information services through mobile devices, then the creation of Web apps seems much more feasible. I know how to create well-formed and valid HTML. I can employ the classic LAMP stack to do any hard-core computing. There are a growing number of CSS frameworks making it easy to implement the mobile interface. All I have to do is learn Javascript, and this is not nearly as difficult as it used to be with the emergence of Javascript debuggers and numerous Javascript libraries. For me, Web apps seem to be the way to go.
Over the past couple of years I went out and purchased the following books to help me learn how to create Web apps. Each of them are briefly described below, but first, here’s a word about WebKit. There are at least three HTML frameworks driving the majority of Web browsers these days. Gecko which is the heart of Firefox, WebKit which is the heart of Safari and Chrome, and whatever Microsoft uses as the heart of Internet Explorer. Since I do not own any devices that run the Android or the Windows operating systems, all of my development is limited to Gecko or WebKit based browsers. Luckily, WebKit seems to be increasing in popularity, and this makes it easier for me to rationalize my development in iPhone, iPad, and iPod Touch. The books reviewed below also lean in this direction.
 |
 |
 |
 |
 |
Based on the things I’ve learned from these books, I’ve created several mobile interfaces. Each of them deserve their own blog posting so I will only outline them here:
Remember, the sites listed above are designed for mobile, primarly driven by the WebKit engine. If you don’t use a mobile device to view the sites, then your milage will vary.
 Image Gallery |
 Water Collection |
 Alex Lite |
 Geo-Location |
Web app development is beyond a trend. It has all but become an expectation. Web app implementation requires an evolution in thinking about Web design as well as an additional skill set which includes advanced HTML, CSS, and Javascript. These are not your father’s websites. There are a number of books out there that can help you learn about these topics. Listed above are just a few of them.
2011-05-15T14:01:40+00:00 Life of a Librarian: Data Management Day http://sites.nd.edu/emorgan/2011/04/data-management-day/This is the home page for the University of Notre Dame’s inaugural Data Management Day (April 25, 2011). Here you will find a thorough description of the event. In a sentence, it was a success.

Co-sponsored by the Center for Research Computing and the Hesburgh Libraries, the purpose of Data Management Day was to raise awareness of all things research data across the Notre Dame community. This half-day event took place on Monday, April 25 from 1–5 o’clock in Room 126 of DeBartolo Hall. It brought together as many people as possible who deal with research data. The issues included but were not limited to:
To help get us going and to stimulate our thinking, a number of speakers shared their experience.
In “Science and Engineering need’s perspective” Edward Bensman (Civil Engineering & Geological Sciences) described how he quantified the need for research data storage & backup. He noted that people’s storage quotas were increasing at a linear rate but the need for storage was increasing at an exponential rate. In short he said, “The CRC is not sized for University demand and we need an enterprise solution.” He went on to recommend a number of things, specifically:
Charles Vardeman (Center for Research Computing) in “Data Management for Molecular Simulations” outlined the workflow of theoretical chemists and enumerated a number of models for running calculations against them. He emphasized the need to give meaning to the data and thus the employment of a metadata schema called SMILES was used in conjunction with relational database models to describe content. Vardeman concluded with a brief description of a file system-based indexing scheme that might make the storage and retrieval of information easier.
Vardeman’s abstract: Simulation algorithms are enabling scientists to ask interesting questions about molecular systems at an increasingly unmanageable rate from a data perspective. Traditional POSIX directory and file storage models are inadequate to categorize this ever increasing amount of data. Additionally, the tools for managing molecular simulation data must be highly flexible and extensible allowing unforeseen connections in the data to be elucidated. Recently, the Center for Research Computing built a simulation database to categorize data from Gaussian molecular calculations. Our experience of applying traditional database structures to this problem will be discussed highlighting the advantages and disadvantages of using such a strategy to manage molecular data.
Daniel Skendzel (Project Manager for the Digital Asset Strategy Committee) presented an overview of the work of the Digital Asset Management group in “Our Approach to Digital Asset Management”. He began by comparing digital asset management to a storage closet and then showed two different pictures of closets. One messy and another orderly. He described the University’s digital asset management system as “siloed”, and he envisioned bringing these silos together into a more coherent whole complete with suites of tools for using the assets more effectively. Skendzel compared & contrasted our strategy to Duke’s (coordinated), Yale’s (enabling), and the University of Michigan’s (integrated) noting the differences in functionality and maturity across all four. I thought his principles for cultural change — something he mentioned at the end — were most interesting:
Skendzel’s abstract: John Affleck-Graves and the Leadership Committee on Operational Excellence commissioned the Digital Asset Strategy Committee in May 2010 to create and administer a master plan to provide structure for managing digital content in the form of multi-media, images, specific document-types and research data. The plan will address a strategy for how we can best approach the lifecycle needs of capturing, managing, distributing and preserving our institutional digital content. This talk will focus on our progress toward a vision to enhance the value of our digital content by integrating our unique organizational culture with digital technologies.
Darren Davis (Associate Vice President for Research and Professor of Political Science) talked about the importance and role of institutional review boards in “Compliance and research data management”. He began by pointing out the long-standing issues of research and human subject noting a decades-old report outlining the challenges. He stated how the University goes well beyond the Federal guidelines, and he said the respect of the individual person is the thing the University is most interested in when it comes to these guidelines. When human subjects are involved in any study, he said, it is very important for the subjects to understand what information is being gleaned from them, the compensation they will receive from the process, and that their services are being given willingly. When licensing data from human subject research confidentiality is an ever-present challenge, and the data needs to be de-identifiable. Moreover, the licensed data can not be repurposed. Finally, Davis said he and the Office of Research will help faculty create data management plans and they look to expand these service offerings accordingly.
Davis’s abstract: Advances in technology have enabled investigators to explore new avenues of research, enhance productivity, and use data in ways unimagined before. However, the application of new technologies has the potential to create unanticipated compliance problems regarding what constitutes human subject research, confidentiality, and consent.
In “From Design to Archiving: Managing Multi-Site, Longitudinal Data in Psychology” Jennifer Burke (Research Assistant Professor of Psychology & Associate Director of the Center for Children and Families) gave an overview of the process she uses to manage her research data. She strongly advocated planning that includes storage, security, back-up, unit analysis, language, etc. Her data comes in all formats: paper, electronic, audio/video. She designs and builds her data sets sometimes in rows & columns and sometimes as linked relational databases. She is mindful of file naming conventions and the use of labeling conventions (her term for “metadata”). There is lots of data-entry, data clean-up, and sometimes “back filling”. Finally everything is documented in code books complete with a CD. She shares her data, when she can, through archives, online, and even the postal mail. I asked Burke which of the processes was the most difficult or time-consuming, and she said, without a doubt, the data-entry was the most difficult.
Burke’s abstract: This brief talk will summarize the work of the Data Management Center, from consulting on methodological designs to preparing data to be archived. The talk will provide an overview of the types of data that are typical for psychological research and the strategies we have developed to maintain these data safely and efficiently. Processes for data documentation and preparation for long-term archiving will be described.
Up next was Maciej Malawski (Center for Research Computing, University of Notre Dame & AGH University of Science and Technology, Krakow, Poland) and his “Prospects for Executable Papers in Web and Cloud Environments”. Creating research data is one thing, making it available is another. In this presentation Malawski advocated “executable” papers” — applications/services embedded into published articles allowing readers to interact with the underlying data. The idea is not brand new and may have been first articulated as early as 1992 when CD-ROMs became readily available. Malawski gave at least a couple of working examples of the executable papers citing myExperiment and the Grid Space Virtual Laboratory.
Malawski’s abstract: Recent developments in both e-Science and computational technologies such as Web 2.0 and cloud computing call for a novel publishing paradigm. Traditional scientific publications should be supplemented with elements of interactivity, enabling reviewers and readers to reexamine the reported results by executing parts of the software on which such results are based as well as access primary scientific data. We will discuss opportunities brought by recent Web 2.0, Software-as-a-Service, grid and cloud computing developments, and how they can be combined together to make executable papers possible. As example solutions, we will focus on two specific environments: MyExperiment portal for sharing scientific workflows, and GridSpace virtual laboratory which can be used as a prototype executable paper engine.
Patrick Flynn (Professor of Computer Science & Engineering, Concurrent Professor of Electrical Engineering) seemed to have the greatest amount of experience in the group, and he shared it in a presentation called “You want to do WHAT?: Managing and distributing identifying data without running afoul of your research sponsor, your IRB, or your Office of Counsel”. Flynn and his immediate colleagues have more than 10 years of experience with biometric data. Working with government and non-government grant sponsors, Flynn has been collecting images of people’s irises, their faces, and other data points. The data is meticulously maintained, given back to the granters, and then licensed to others. To date Flynn has about 18 data sets to his credit, and they have been used in a wide variety of subsequent studies. The whole process is challenging, he says. Consent forms. Metadata data accuracy. Licensing. Institutional review boards. In the end, he advocated the University cultivate a culture of data stewardship and articulated the need for better data management systems across campus.
Flynns’ abstract: This talk will summarize nine years’ experience with collecting biometrics data from consenting human subjects and distributing such data to qualified research groups. Key points visited during the talk will include: Transparency and disclosure; addressing concerns and educating the concerned; deploying infrastructure for the management of terabytes of data; deciding whom to license data to and how to decline requests; how to manage an ongoing data collection/enrollment/distribution workflow.
In “Globus Online: Software-as-a-Service for Research Data Management” Steven Tuecke (Deputy Director, Computation Institute, University of Chicago & Argonne National Laboratory) described the vision for a DropBox-like service for scientists called Globus Online. By exploiting cloud computing techniques, Tuecke sees a time when researchers can go to a website, answer a few questions, select a few check boxes, and have the information technology for their lab set up almost instantly. Technology components may include blogs, wikis, mailing lists, file systems for storage, databases for information management, indexer/search engines, etc. “Medium and small labs should be doing science, not IT (information technology).” In short, Tuecke advocated Software-As-A-Service (SaaS) for much of research data.
Tuecke’s abstract: The proliferation of data and technology creates huge opportunities for new discoveries and innovations. But they also create huge challenges, as many researchers lack the IT skills, tools, and resources ($) to leverage these opportunities. We propose to solve this problem by providing missing IT to researchers via a cost-effective Software-as-a-Service (SaaS) platform, which we believe can greatly accelerate discovery and innovation worldwide. In this presentation I will discuss these issue, and demonstrate our initial step down this path with the Globus Online file transfer service.
The final presentation was given by Timothy Flanagan (Associate General Counsel for the University), “Legal issues and research data management”. Flanagan told the audience it was his responsibility to represent the University and provide legal advice. When it comes to research data management, there are more questions than answers. “A lot of these things are not understood.” He sees his job and the General Counsel’s job as one of balancing obligation with risk.
Jarek Nabrzyski (Center for Research Computing) and I believe Data Management Day was a success. The event itself was attended by more than sixty-five people, and they seemed to come from all parts of the University. Despite the fact that the presentations were only fifteen minutes long, each of the presenters obviously spent a great deal of time putting their thoughts together. Such effort is greatly appreciated.
The discussion after the presentations was thoughtful and meaningful. Some people believed a larger top-down effort to provide infrastructure support was needed. Others thought the needs were more pressing and the solution to the infrastructure and policy issues needs to come up from a grassroots level. Probably a mixture of both is required.
One of the goals of Data Management Day was to raise the awareness of all issues research data management. The presentations covered many of the issues:
Data management is happening all across our great university. The formats, storage mechanisms, data modeling, etc. are different from project to project. But they all share a set of core issues that need to be addressed to one degree or another. By bringing together as many people as possible and facilitating discussion among them, the hope was to build understanding across our academe and ultimately work more efficiently. Data Management Day was one way to accomplish this goal.
What are the next steps? Frankly, we don’t know. All we can say is research data management is not an issue that can be addressed in isolation. Instead, everybody has some of the solution. Talk with your immediate colleagues about the issues, and more importantly, talk with people outside your immediate circle. Our whole is greater than the sum of our parts.
2011-04-30T08:04:26+00:00 Mini-musings: Alex Lite (version 2.0) http://infomotions.com/blog/2011/04/alex-lite-version-2-0/This posting describes Alex Lite (version 2.0) — a freely available, standards-compliant distribution of electronic texts and ebooks.
 Alex Lite in a browser |
 Alex Lite on a mobile |
A few years ago I created the first version of Alex Lite. Its primary purpose was to: 1) explore and demonstrate how to transform a particular flavor of XML (TEI) into a number of ebook formats, and 2) distribute the result on a CD-ROM. The process was successful. I learned a lot of about XSLT — the primary tool for doing this sort of work.
Since then two new developments have occurred. First, a “standard” ebook format has emerged — ePub. Based on XHTML, this standard specifies packaging up numerous XML files into a specialized ZIP archive. Software is intended to uncompress the file and display the result. Second, mobile devices have become more prevalent. Think “smart phones” and iPads. These two things have been combined to generate an emerging ebook market. Consequently, I decided to see how easy it would be to transform my TEI files into ePub files, make them available on the Web as well as a CD-ROM, and finally implement a “Webapp” for using the whole thing.
Alex Lite (version 2.0) is the result. There you will find a rudimentary Web browser-based “catalogue” of electronic texts. Browsable by authors and titles (no search), a person can read as many as eigthy classic writings in the forms of HTML, PDF, and ePub files. Using just about any mobile device, a person should be able to use a differnt interface to the collection with all of the functionality of the original. The only difference is the form factor, and thus the graphic design.
The entire Alex Lite distribution is designed to be given away and used as a stand-alone “library”. Download the .zip file. Uncompress it (about 116 MB). Optionally save the result on your Web server. Open the distribution’s index.html file with your browser or mobile. Done. Everything is included. Supporting files. HTML files. ePub files. PDF’s. Since all the files have been run through validators, a CD of Alex Lite should be readable for quite some time. Give away copies to your friends and relatives. Alex Lite makes a great gift.
Computers and their networks are extremely fragile. If they were to break, then access to much of world’s current information would suddently become inaccessible. Creating copies of content, like Alex Lite, are a sort of insurance against this catastrophe. Marking-up content in forms like TEI make it realatively easy to migrate ideas forward. TEI is just the information, not display nor container. Using XSLT it is possible to create different containers and different displays. Having copies of content locally enables a person to control their own destiny. Linking to content only creates maintenance nightmares.
Alex Lite is a fun little hack. Share it with your friends, and use it to evolve your definition of a library.
2011-04-12T01:41:10+00:00 Mini-musings: Where in the world is the mail going? http://infomotions.com/blog/2011/03/where-in-the-world-is-the-mail-going/For a good time, I geo-located the subscribers from a number of mailing lists, and then plotted them on a Google map. In other words, I asked the question, “Where in the world is the mail going?” The answer was sort of surprising.
I moderate/manage three library-specific mailing lists: Usability4Lib, Code4Lib, and NGC4Lib. This means I constantly get email messages from the LISTSERV application alerting me to new subscriptions, unsubscriptions, bounced mail, etc. For the most part the whole thing is pretty hands-off, and all I have to do is manually unsubscribe people because their address changed. No big deal.
It is sort of fun to watch the subscription requests. They are usually from places within the United States but not always. I then got to wondering, “Exactly where are these people located?” Plotting the answer on a world map would make such things apparent. This process is called geo-location. For me it is easily done by combining a Perl module called Geo::IP with the Google Maps API. The process was not too difficult and implemented in a program called domains2map.pl:
The results are illustrated below.
| Usability4Lib – 600 subscribers | |
|---|---|
 interactive map |
 pie chart |
| Code4Lib – 1,700 subscribers | |
|---|---|
 interactive map |
 pie chart |
| NGC4Lib – 2,100 subscribers | |
|---|---|
 interactive map |
 pie chart |
It is interesting to note how many of the subscribers seem to be located in Mountain View (California). This is because many people use Gmail for their mailing list subscriptions. The mailing lists I moderate/manage are heavily based in the United States, western Europe, and Australia — for the most part, English-speaking countries. There is a large contingent of Usability4Lib subscribers located in Rochester (New York). Gee, I wonder why. Even though the number of subscribers to Code4Lib and NGC4Lib is similar, the Code4Libbers use Gmail more. NGC4Lib seems to have the most international subscription base.
In the interest of providing “access to the data behind the chart”, you can download the data sets: code4lib.txt, ngc4lib.txt, and usability4lib.txt. Fun with Perl, Google Maps, and mailing list subscriptions.
For something similar, take a gander at my water collection where I geo-located waters of the world.
2011-03-24T01:22:09+00:00 Mini-musings: Constant chatter at Code4Lib http://infomotions.com/blog/2011/03/constant-chatter-at-code4lib/As illustrated by the chart, it seems as if the chatter was constant during the most recent Code4Lib conference.
For a good time and in the vein of text mining, I made an effort to collect as many tweets with the hash tag #c4l11 as well as the backchannel log files. (“Thanks, lbjay!”). I then parsed the collection into fields (keys, author identifiers, date stamps, and chats/tweets), and stuffed them into a database. I then created a rudimentary tab-delimited text file consisting of a key (representing a conference event), a start time, and an end time. Looping through this file I queried my database returning the number of chats and tweets associated with each time interval. Lastly, I graphed the result.

Constant chatter at Code4Lib, 2011
As you can see there are a number of spikes, most notably associated with keynote presentations and Lightning Talks. Do not be fooled, because each of these events are longer than balance of the events in the conference. The chatter was rather constant throughout Code4Lib 2011.
When talking about the backchannel, many people say, “It is too distracting; there is too much stuff there.” I then ask myself, “How much is too much?” Using the graph as evidence, I can see there are about 300 chats per event. Each event is about 20-30 minutes long. That averages out to 10ish chats per minute or 1 item every 6 seconds. I now have a yardstick. When the chat volume is equal to or greater than 1 item every 6 seconds, then there is too much stuff for many people to follow.
The next step will be to write a program allowing people to select time ranges from the chat/tweet collection, extract the associated data, and apply analysis tools against them. This includes things like concordances, lists of frequently used words and phrases, word clouds, etc.
Finally, just like traditional books, articles, microforms, and audio-visual materials things things like backchannel log files, tweets, blogs, and mailing list archives are forms of human expression. Do what degree do these things fall into the purview of library collections? Why (or why not) should libraries actively collect and archive them? If it is within our purview, then what do libraries need to do differently in order build such collections and take advantage of their fulltext nature?
2011-03-20T14:02:12+00:00 Life of a Librarian: Data management & curation groups http://sites.nd.edu/emorgan/2011/03/data-management-curation-groups/This is a short and incomplete list of universities with data management & curation groups. Each item includes the name of the local group, a link to the group’s home page, a blurb describing the focus of the group, and a sublist of group membership.
“The Research Data Management Service Group (RDMSG) aims to: present a coherent set of services to researchers; develop a unified web presence providing general information on data management planning, services available on campus, and standard language that may be used in data management plans in grant proposals; provide a single point of contact that puts researchers in touch with specialized assistance as the need arises. The RDMSG is jointly sponsored by the Senior Vice Provost for Research and the University Librarian, and also has a faculty advisory board.” — http://data.research.cornell.edu/
“The University of Oxford is committed to supporting researchers in appropriate curation and preservation of their research data, and where applicable in accordance with the research funders’ requirements.” — http://www.admin.ox.ac.uk/rdm/
“Digital curation covers cradle-to-grave data management, including storage, preservation, selection, transfer, description, sharing, access, reuse, and transformations. With the current focus on data sharing and preservation on the part of funding agencies, publishers, and research disciplines, having data management practices in place is more relevant than ever.” — http://researchdata.wisc.edu/
“What should be included in a data management plan? Funding agencies, e.g., the National Science Foundation (NSF), may have specific requirements for plan content. Otherwise, there are fundamental data management issues that apply to most disciplines, formats, and projects. And keep in mind that a data management plan will help you to properly manage your data for own use, not only to meet a funder requirement or enable data sharing in the future.” — http://libraries.mit.edu/guides/subjects/data-management/
“The SciDaC Group is ready to consult with you on your entire data life cycle, helping you to make the right decisions, so that your scientific research data will continue to be available when you and others need it in the future.” — http://www2.lib.virginia.edu/brown/data/
“The University Libraries are here to assist you with research data management issues through best practices, training, and awareness of data preservation issues. This site examines the research data life-cycle and offers tools and solutions for creation, storage, analysis, dissemination, and preservation of your data.” — http://www.lib.umn.edu/datamanagement
“Good data management starts with comprehensive and consistent data documentation and should be maintained through the life cycle of the data.” — http://www.libraries.psu.edu/psul/scholar/datamanagement.html
“Research Cyberinfrastructure offers UC San Diego researchers the computing, network, and human infrastructure needed to create, manage, and share data, and SDSC’s favorable pricing can help researchers meet the new federal requirements for budget proposals.” — http://rci.ucsd.edu/
“We investigate and pursue innovative solutions for curation issues of organizing, facilitating access to, archiving for and preserving research data and data sets in complex environments.” — http://d2c2.lib.purdue.edu/
In this posting I present two quantitative methods for denoting the “greatness” of a text. Through this analysis I learned that Aristotle wrote the greatest book. Shakespeare wrote seven of the top ten books when it comes to love. And Aristophanes’s Peace is the most significant when it comes to war. Once calculated, this description – something I call the “Great Ideas Coefficient” – can be used as a benchmark to compare & contrast one text with another.
In 1952 Robert Maynard Hutchins et al. compiled a set of books called the Great Books of the Western World. [1] Comprised of fifty-four volumes and more than a couple hundred individual works, it included writings from Homer to Darwin. The purpose of the set was to cultivate a person’s liberal arts education in the Western tradition. [2]
To create the set a process of “syntopical reading” was first done. [3]. (Syntopical reading is akin to the emerging idea of “distant reading” [4], and at the same time complementary to the more traditional “close reading”.) The result was an enumeration of 102 “Great Ideas” commonly debated throughout history. Through the syntopical reading process, through the enumeration of timeless themes, and after thorough discussion with fellow scholars, the set of Great Books was enumerated. As stated in the set’s introductory materials:
…but the great books posses them [the great ideas] for a considerable range of ideas, covering a variety of subject matters or disciplines; and among the great books the greatest are those with the greatest range of imaginative or intellectual content. [5]
Our research question is then, “How ‘great’ are the Great Books?” To what degree do they discuss the Great Ideas which apparently define their greatness? If such degrees can be measured, then which of the Great Books are greatest?
To measure the greatness of any text – something I call a Great Ideas Coefficient – I apply two methods of calculation. Both exploit the use of term frequency inverse document frequency (TFIDF).
TFIDF is a well-known method for calculating statistical relevance in the field of information retrieval (IR). [6] Query terms are supplied to a system and compared to the contents of an inverted index. Specifically, documents are returned from an IR system in a relevancy ranked order based on: 1) the ratio of query term occurrences and the size of the document multiplied by 2) the ratio of the number of documents in the corpus and the number of documents containing the query terms. Mathematically stated, TFIDF equals:
(c/t) * log(d/f)
where:
For example, suppose a corpus contains 100 documents. This is d. Suppose two of the documents contain a given query term (such as “love”). This is f. Suppose also the first document is 50 words long (t) and contains the word love once (c). Thus, the first document has a TFIDF score of 0.034:
(1/50) * log(100/2) = 0.0339
Where as, if the second document is 75 words long (t) and contains the word love twice (c), then the second document’s TFIDF score is 0.045:
(2/75) * log(100/2) = 0.0453
Thus, the second document is considered more relevant than the first, and by extension, the second document is probably more “about” love than the first. For our purposes relevance and “aboutness” are equated with “greatness”. Consequently, in this example, when it comes to the idea of love, the second document is “greater” than the first. To calculate our first Coefficient I sum all 102 Great Idea TFIDF scores for a given document, a statistic called the “overlap score measure”. [7] By comparing the resulting sums I can compare the greatness of the texts as well as examine correlations between Great Ideas. Since items selected for inclusion in the Great books also need to exemplify the “greatest range of imaginative or intellectual content”, I also produce a Coefficient based on a normalized mean for all 102 Great Ideas across the corpus.
To calculate the Great Ideas Coefficient for each of the Great Books I used the following process:
The end result was a file in the form of a matrix with 222 rows and 104 columns. Each row represents a Great Book. Each column is a local identifier, a Great Ideas TFIDF score, and a book’s Great Ideas Coefficient. [9]
Sorting the matrix according to the Great Ideas Coefficient is trivial. Upon doing so I see that Kant’s Introduction To The Metaphysics Of Morals and Aristotle’s Politics are the first and second greatest books, respectively. When the matrix is sorted by the love column, I see Plato’s Symposium come out as number one, but Shakespeare claims seven of the top ten items with his collection of Sonnets being the first. When the matrix is sorted by the war column, then Aristophanes’s Peace is the greatest.
Unfortunately, denoting overall greatness in the previous manner is too simplistic because it does not fit the definition of greatness posited by Hutchins. The Great Books are expected to be great because they exemplify the “greatest range of imaginative or intellectual content”. In other words, the Great Books are great because they discuss and elaborate upon a wide spectrum of the Great Ideas, not just a few. Ironically, this does not seem to be the case. Most of the Great Books have many Great Idea scores equal to zero. In fact, at least two of the Great Ideas – cosmology and universal – have TFIDF scores equal to zero across the entire corpus, as illustrated by Figure 1. This being the case, I might say that none of the Great Books are truly great because none of them significantly discuss the totality of the Great Ideas.

Figure 1 – Box plot scores of Great Ideas
To take this into account and not allow the value of the Great Idea Coefficient to be overwhelmed by one or two Great Idea scores, I calculated the mean TFIDF score for each of the Great Ideas across the matrix. This vector represents an imaginary but “typical” Great Book. I then compared the Great Idea TFIDF scores for each of the Great Books with this central quantity to determine whether or not it is above or below the typical mean. After graphing the result I see that Aristotle’s Politics is still the greatest book with Hegel’s Philosophy Of History being number two, and Plato’s Republic being number three. Figure 2 graphically illustrates this finding, but in a compressed form. Not all works are listed in the figure.

Figure 2 – Individual books compared to the “typical” Great Book
How “great” are the Great Books? The answer depends on what qualities a person wants to measure. Aristotle’s Politics is great in many ways. Shakespeare is great when it comes to the idea of love. The calculation of the Great Ideas Coefficient is one way to compare & contrast texts in a corpus – “syntopical reading” in a digital age.
[1] Hutchins, Robert Maynard. 1952. Great books of the Western World. Chicago: Encyclopædia Britannica.
[2] Ibid. Volume 1, page xiv.
[3] Ibid. Volume 2, page xi.
[4] Moretti, Franco. 2005. Graphs, maps, trees: abstract models for a literary history. London: Verso, page 1.
[5] Hutchins, op. cit. Volume 3, page 1220.
[6] Manning, Christopher D., Prabhakar Raghavan, and Hinrich Schütze. 2008. An introduction to information retrieval. Cambridge: Cambridge University Press, page 109.
[7] Ibid.
[8] Solr – http://lucene.apache.org/solr/
[9] This file – the matrix of identifiers and scores – is available at http://bit.ly/cLmabY, but a more useful and interactive version is located at http://bit.ly/cNVKnE
2011-03-16T10:33:05+00:00 Mini-musings: Code4Lib Conference, 2011 http://infomotions.com/blog/2011/03/code4lib-conference-2011/This posting documents my experience at the 2011 Code4Lib Conference, February 8-10 in Bloomington (Indiana). In a sentence, the Conference was well-organized, well-attended, and demonstrated the over-all health and vitality of this loosely structured community. At the same time I think the format of the Conference will need to evolve if it expects to significantly contribute to the library profession.
 student center |
 computers |
 Code4Libbers |
The Conference officially started on Tuesday, February 8 after the previous day’s round of pre-conference activities. Brad Wheeler (Indiana University) gave the introductory remarks. He alluded to the “new normal”, and said significant change only happens when there are great leaders or financial meltdowns such as the one we are currently experiencing. In order to find stability in the current environment he advocated true dependencies and collaborations, and he outlined three tensions: 1) innovation versus solutions at scale, 2) local-ness and cloudiness, and 3) propriety verus open. All of these things, he said, are false dichotomies. “There needs to be a balance and mixture of all these tension.” Wheeler used his experience with Kuali as an example and described personal behavior, a light-weight organization, and local goals as the “glue” making Kuali work. Finally, he said the library community needs to go beyond “toy” projects and create something significant.
The keynote address, Critical collaborations: Programmers and catalogers? Really?, was given by Diane Hillman (Metadata Management). In it she advocated greater collaboration between the catalogers and coders. “Catalogers and coders do not talk with each other. Both groups get to the nitty-gritty before their is an understanding of the problem.” She said change needs to happen, and it should start within our own institutions by learning new skills and having more cross-departmental meetings. Like Wheeler, she had her own set of tensions: 1) “cool” services versus the existing online public access catalog, and 2) legacy data versus prospective data. She said both communities have things to learn from each other. For example, catalogers need to learn to use data that is not created by catalogers, and catalogers need not always look for leadership from “on high”. I asked what the coders needed to learn, but I wasn’t sure what the answer was. She strongly advocated RDA (Resource Description and Access), and said, “It is ready.” I believe she was looking to the people in the audience as people who could create demonstration projects to show to the wider community.
Karen Coombs (OCLC) gave the next presentation, Visualizing library data. In it she demonstrated a number of ways library information can be graphed through the use of various mash-up technologies: 1) a map of holdings, 2) QR codes describing libraries, 3) author timelines, 4) topic timelines, 5) FAST headings in a tag cloud, 6) numbers of libraries, 7) tree relationships between terms, and 8) pie charts of classifications. “Use these things to convey information that is not a list of words”.
In Hey, Dilbert, where’s my data?”, Thomas Barker (University of Pennsylvania) described how he is aggregating various library data sets into a single source for analysis — http://code.google.com/p/metridoc/
Tim McGeary (Lehigh University) shared a Kuali update in Kuali OLE: Architecture of diverse and linked data. OLE (Open Library Environment) is the beginnings of an open source library management system. Coding began this month (February) with goals to build community, implement a “next-generation library catalog”, re-examine business operations, break away from print models of doing things, create an enterprise-level system, and reflect the changes in scholarly work. He outlined the structure of the system and noted three “buckets” for holding different types of content: 1) descriptive — physical holdings, 2) semantic — conceptual content, and 3) relational — financial information. They are scheduled to release their first bits of code by July.
Cary Gordon (The Cherry Hill Company) gave an overview of Drupal 7 functionality in Drupal 7 as a rapid application development tool. Of most interest to me was the Drupal credo, “Sacrifice the API. Preserve the data.” In the big scheme of things, this makes a lot of sense to me.
After lunch first up was Josh Bishoff (University of Illinois) with Enhancing the mobile experience: mobile library services at Illinois. The most important take-away was the importance between a mobile user experience and a desktop user experience. They are not the same. “This is not a software problem but rather an information architecture problem.”
Scott Hanrath (University of Kansas) described his participation in the development of Anthologize in One week, one tool: Ultra-rapid open sources development among strangers. He enumerated the group’s three criteria for success: 1) usefulness, 2) low walls & high ceilings, and 3) feasibility. He also attributed the project’s success to extraordinary outreach efforts — marketing, good graphic design, blurbs, logos, etc.
 cabin |
 graveyard |
 chruch |
VuFind beyond MARC: Discovering everything else by Demian Katz (Villanova University) described how VuFind supports the indexing of non-MARC metadata through the use of “record drivers”. Acquire metadata. Map it to Solr fields. Index it while denoting it as a special metadata type. Search. Branch according to metadata type. Display. He used Dublin Core OAI-PMH metadata as an example.
The last formal presentation of the day was entitled Letting in the light: Using Solr as an external search component by Jay Luker and Benoit Thiell (Astrophysics Data System). ADS is a bibliographic information system for astronomers. It uses a pre-print server originally developed at CERN. They desired to keep much of the functionality of the original server as possible but enhance it with Solr indexing. They described how they hacked the two systems to allow the searching and retrieving of millions of records at a time. Of all the presentations at the Conference, this one was the most computer science-like.
The balance of the day was given over to breakout sessions, lightning talks, a reception in the art museum, and craft beer drinking in the hospitality suite. Later that evening I retired to my room and hacked on Twitter feeds. “What do library programmers do for a good time?”
The next day began with a presentation by my colleagues at Notre Dame, Rick Johnson and Dan Brubakerhorst. In A Community-based approach to developing a digital exhibit at Notre Dame using the Hydra Framework, they described how they are building and maintaining a digital library framework based on a myriad of tools: Fedora, Active Fedora, Solr, Hydrangia, Ruby, Blacklight. They gave examples of ingesting EAD files. They are working on an ebook management application. Currently they are building a digitized version of city plans.
I think the most inspiring presentation was by Margaret Heller (Dominican University) and Nell Tayler (Chicago Underground) called Chicago Underground Library’s community-based cataloging system. Tayler began and described a library of gray literature. Poems. Comics. All manner of self publications were being collected and loosely cataloged in order to increase the awareness of the materials and record their existence. The people doing the work have little or no cataloging experience. They decided amongst themselves what metadata they were going to use. They wanted to focus on locations and personal characteristics of the authors/publishers of the material. They whole thing reminded me of the times I suggested cataloging local band posters because somebody will find everything interesting at least once.
Gabriel Farrell (Drexel University) described the use of a non-relational database called CouchDB in Beyond sacrilege: A CouchApp catalog. With a REST-ful interface, complete with change log replication and different views, CouchApp seems to be cool as well as “kewl”.
Matt Zumwalt (MediaShelf) in Opinionated metadata: Bringing a bit o sanity to the world of XML metdata described OM which looked like a programatic way of working with XML in Ruby but I thought his advice on how to write good code was more interesting. “Start with people’s stories, not the schema. Allow the vocabulary to reflect the team. And talk to the other team members.”
Ben Anderson (eXtensible Catalog) in Enhancing the performance of extensibility of XC’s metadata services toolkit outlined the development path and improvements to the Metadata Services Toolkit (MST). He had a goal of making the MST faster and more robust, and he did much of this by taking greater advantage of MySQL as opposed to processing various things in Solr.
 wires |
 power supply |
 water cooler |
In Ask Anything! a.k.a. the ‘Human Search Engine moderated by Dan Chudnov (Library of Congress) a number of people stood up, asked the group a question, and waited for an answer. The technique worked pretty well and enabled many people to identify many others who: 1) had similar problems, or 2) offered solutions. For better or for worse, I asked the group if they had any experience with issues of data curation, and I was “rewarded” for my effort with the responsibility to facilitate a birds-of-a-feather session later in the day.
Standing in for Mike Grave, Tim Shearer (University of North Carolina at Chapel Hill) presented GIS on the cheap. Using different content from different sources, Grave is geo-tagging digital objects by assigning them latitudes and longitudes. Once this is done, his Web interfaces read the tagging and place the objects on a map. He is using a Javascript library called Open Layers for the implementation.
In Let’s get small: A Microservices approach to library websites by Sean Hannan (Johns Hopkins University) we learned how a myriad of tools and libraries are being used by Hannan to build websites. While the number of tools and libraries seemed overwhelming I was impressed at the system’s completeness. He was practicing the Unix Way when it comes to website maintenance.
When a person mentions the word “archives” at a computer conference, one of the next words people increasingly mention is “forensics”, and Mark Matienzo (Yale University) in Fiwalk with me: Building emergent pre-ingest workflows for digital archival records using open source-forensic software described how he uses forensic techniques to read, organize, preserve digital media — specifically hard drives. He advocated a specific workflow for doing his work, a process for analyzing the disk’s content with a program called Gumshoe, and Advanced Forensic Framework 4 (AFF4) for doing forensics against file formats. Ultimately he hopes to write an application binding the whole process together.
I paid a lot of attention to David Lacy (Villanova University) when he presented (Yet another) home-grown digital library system, built upon open source XML technologies and metadata standards because the work he has done directly effects a system I am working on colloquially called the “Catholic Portal”. In his system Lacy described a digital library system complete with METS files, a build process, an XML database, and an OAI-PMH server. Content is digitized, described, and ingested into VuFind. I feel embarrassed that I had not investigated this more thoroughly before.
Break-out (birds-of-a-feather) sessions were up next and I facilitated one on data curation. Between ten and twelve of us participated, and in a nutshell we outlined a whole host of activities and issues surrounding the process of data management. After listing them all and listening to the things discussed more thoroughly by the group I was able to prioritize. (“Librarians love lists.”) At the top was, “We won’t get it right the first time”, and I certainly agree. Data management and data curation are the new kids on the block and consequently represent new challenges. At the same time, our profession seems obsessed with the creation of processes, implementations, and not evaluating the processes as needed. In our increasingly dynamic environment, such a way of thinking is not feasible. We will have to practice. We will have to show our ignorance. We will have to experiment. We will have to take risks. We will have to innovate. All of these things assume imperfection from the get go. At the same time the issues surrounding data management have a whole lot in common with issues surrounding just about any other medium. The real challenge is the application of our traditional skills to the current environment. A close second in the priorities was the perceived need for cross-institutional teams — groups of people including the office of research, libraries, computing centers, legal counsel, and of course researchers who generate data. Everybody has something to offer. Everybody has parts of the puzzle. But no one has all the pieces, all the experience, nor all the resources. Successful data management projects — defined in any number of ways — require skills from across the academe. Other items of note on the list included issues surrounding: human subjects, embargoing, institution repository versus discipline repositories, a host of ontologies, format migration, storage and back-up versus preservation and curation, “big data” and “little data”, entrenching one’s self in the research process, and unfunded mandates.
 text mining |
As a part of the second day’s Lighting Talks I shared a bit about text mining. I demonstrated how the sizes of texts — measured in words — could be things we denote in our catalogs thus enabling people to filter results in an additional way. I demonstrated something similar with Fog, Flesch, and Kincaid scores. I illustrated these ideas with graphs. I alluded to the “colorfulness” of texts by comparing & contrasting Thoreau with Austen. I demonstrated the idea of “in the same breath” implemented through network diagrams. And finally, I tried to describe how all of these techniques could be used in our “next generation library catalogs” or “discovery systems”. The associated video, here, was scraped from the high quality work done by the University of Indiana. “Thanks guys!”
At the end of the day we were given the opportunity to visit the University’s data center. It sounded a lot like a busman’s holiday to me so I signed up for the 6 o’clock show. I got on the little bus with a few other guys. One was from Australia. Another was from Florida. They were both wondering whether or not the weather was cold. It being around 10° Fahrenheit I had to admit it was. The University is proud of their data center. It can withstand tornado-strength forces. It is built into the side of a hill. It is only have full, if that, which is another way of saying, “They have a lot of room to expand.” We saw the production area. We saw the research area. I was hoping to see lots of blinking lights and colorful, twisty cables, but the lights were few and the cables were all blue. We saw Big Red. I wanted to see where the network came in. “It is over there, in that room”. Holding up my hands I asked, “How big is the pipe?”. “Not very large,” was the reply, “and the fiber optic cable is only the size of a piece of hair.” It thought the whole thing was incongruous. All this infrastructure and it literally hangs on the end of a thread. One of the few people I saw employed by the data center made a comment while I was taking photographs. “Those are the nicest packaged cables you will ever see.” She was very proud of her handiwork, and I was happy to take a few pictures of them.
 Big Red |
 generator |
 wires |
The last day of the conference began with a presentation by Jason Casden and Joyce Chapman (North Carolina State University Libraries) with Building a open source staff-facing tablet app for library assessment. In it they first described how patron statistics were collected. Lots of paper. Lots of tallies. Lots of data entry. Little overall coordination. To resolve this problem they created a tablet-based tool allowing the statistics collector to roam through the library, quickly tally how many people were located where and doing what, and update a centralized database rather quickly. Their implementation was an intelligent use of modern technology. Kudos.
Ian Mulvany (Medeley) was a bit of an entrepreneur when he presented Medeley’s API and university libraries: Three example to create value on behalf of Jan Reichelt. His tool, Medeley, is intended to solve real problems for scholars: making them more efficient as writers, and more efficient as discoverers. To do this he provides a service where PDF files are saved centrally, analyzed for content, and enhanced through crowd sourcing. Using Medeley’s API things such as reading lists, automatic repository deposit, or “library dashboard” applications could be written. As of this writing Medeley is sponsoring a contest with cash prizes to see who can create the most interesting application from their API. Frankly, the sort of application described by Reichelt is the sort of application I think the library community should have created a few years ago.
In Practical relevancy testing, Naomi Dushay (Stanford University) advocated doing usability testing against the full LAMP stack. To do this she uses a program called Cucumber to design usability tests, run them, look at the results, adjust software configurations, and repeat.
Kevin Clarke (NESCent) in Sharing between data repositories first compared & contrasted two repository systems: Dryad and TreeBase. Both have their respective advantages & disadvantages. As a librarian he understands why it is good idea to have the same content in both systems. To this end he outlined and described how such a goal could be accomplished using a file packaging format called BagIt.
The final presentation of the conference was given by Eric Hellman (Gluejar, Inc) and called Why (Code4) libraries exist. In it he posited that more than half of the books sold in the near future will be in ebook format. If this happens, then, he asked, will libraries become obsolete? His answer was seemingly both no and yes. “Libraries need to change in order to continue to exists, but who will drive this change? Funding agencies? Start-up companies? Publishers? OCLC? ILS vendors?” None of these things, he says. Instead, it may be the coders but we (the Code4Lib community) have a number of limitations. We are dispersed, poorly paid, self-trained, and too practical. In short, none of the groups he outlined entirely have what it takes to keep libraries alive. On the other hand, he said, maybe libraries are not really about books. Instead, maybe, they are about space, people, and community. In the end Hellman said, “We need to teach, train, and enable people to use information.”
 conference center |
 bell |
 hidden flywheel |
All in all the presentations were pretty much what I expected and pretty much what was intended. Everybody was experiencing some sort of computing problem in their workplace. Everybody used different variations of the LAMP stack (plus an indexer) to solve their problems. The presenters shared their experience with these solutions. Each presentation was like variations of a 12-bar blues. A basic framework is assumed, and the individual uses the framework to accomplish to create beauty. If you like the idea of the blues framework, then you would have liked the Code4Lib presentations. I like the blues.
In the past eight months I’ve attended at least four professional conferences: Digital Humanities 2010 (July), ECDL 2010 (September), Data Curation 2010 (December), and Code4Lib 2011 (February). Each one had about 300 people in attendance. Each one had something to do with digital libraries. Two were more academic in nature. Two were more practical. All four were communities unto themselves; at each conference there were people of the in-crowd, new comers, and folks in between. Many, but definitely not most, of the people I saw were a part of the other conferences but none of them were at all four. All of the conferences shared a set of common behavioral norms and at the same time owned a set of inside jokes. We need to be careful and not go around thinking our particular conference or community is the best. Each has something to offer the others. I sincerely do not think there is a “best” conference.
The Code4Lib community has a lot to offer the wider library profession. If the use of computers in libraries is only going to grow (which is an understatement), then a larger number of people who practice librarianship will need/want to benefit from Code4Lib’s experience. Yet the existing Code4Lib community is reluctant to change the format of the conference to accomodate a greater number of people. Granted, larger numbers of attendees make it more difficult to find venues, enable a single shared conference experience, and necessitates increased governance and bureaucracy. Such are the challenges of a larger group. I think the Code4Lib community is growing and experiencing growing pains. The mailing list increases by at least one or two new subscribers every week. The regional Code4Lib meetings continue. The journal is doing just fine. Code4Lib is a lot like the balance of the library profession. Practical. Accustomed to working on a shoe string. Service oriented. Without evolving in some way, the knowledge of Code4Libbers is not going to have a substancial effect on the wider library community. This makes me sad.
Next year’s conference — Code4Lib 2012 — will be held in Seattle (Washington). See you there?
 wires |
 self-portrait |
This posting is the first of my text mining essays focusing on parts-of-speech. Based on the most rudimentary investigations, outlined below, it seems as if there is not much utility in the classification and description of texts in terms of their percentage use of parts-of-speech.
For the past year or so I have spent a lot of my time counting words. Many of my friends and colleagues look at me strangely when I say this. I have to admit, it does sound sort of weird. On the other hand, the process has enabled me to easily compare & contrast entire canons in terms of length and readability, locate statistically significant words & phrases in individual works, and visualize both with charts & graphs. Through the process I have developed two Perl modules (Lingua::EN::Ngram and Lingua::Concordance), and I have integrated them into my Alex Catalogue of Electronic Texts. Many people are still skeptical about the utility of these endeavors, and my implementations do not seem to be compelling enough to sway their opinions. Oh well, such is life.
My ultimate goal is to figure out ways to exploit the current environment and provide better library service. The current environment is rich with full text. It abounds. I ask myself, “How can I take advantage of this full text to make the work of students, teachers, and scholars both easier and more productive?” My current answer surrounds the creation of tools that take advantage of the full text — making it easier for people to “read” larger quantities of information, find patterns in it, and through the process create new knowledge.
Much of my work has been based on rudimentary statistics with little regard to linguistics. Through the use of computers I strive to easily find patterns of meaning across works — an aspect of linguistics. I think such a thing is possible because the use of language assumes systems and patterns. If it didn’t then communication between ourselves would be impossible. Computers are all about systems and patterns. They are very good at counting and recording data. By using computers to count and record characteristics of texts, I think it is possible to find patterns that humans overlook or don’t figure as significant. I would really like to take advantage of core reference works which are full of meaning — dictionaries, thesauri, almanacs, biographies, bibliographies, gazetteers, encyclopedias, etc. — but the ambiguous nature of written language makes the automatic application of such tools challenging. By classifying individual words as parts-of-speech (POS), some of this ambiguity can be reduced. This posting is my first foray into this line of reasoning, and only time will tell if it is fruitful.
My first experiment compares & contrasts POS usage across texts. “To what degree are there significant differences between authors’ and genres’ usage of various parts-of-speech?”, I asked myself. “Do some works contain a greater number of nouns, verbs, and adjectives than others?” If so, then maybe this would be one way to differentiate works, and make it easier for the student to both select a work for reading as well as understand its content.
To answer these questions, I need to first identify the POS in a document. In the English language there are eight generally accepted POS: 1) nouns, 2) pronouns, 3) verbs, 4) adverbs, 5) adjectives, 6) prepositions, 7) conjunctions, and 8) interjections. Since I am a “lazy Perl programmer”, I sought a POS tagger and in the end settled on one called Lingua::TreeTagger — a full-featured wrapper around a command line driven application called Tree Tagger. Using a process called the Hidden Markov Model, TreeTagger systematically goes through a document and guesses the POS for a given word. According to the research, it can do this with 96% accuracy because is has accurately modeled the systems and patterns of the English language alluded to above. For example, it knows that sentences begin with capital letters and end with punctuation marks. It knows that capitalized words in the middle of sentences are the names of things and the names of things are nouns. It knows that most adverbs end in “ly”. It knows that adjectives often precede nouns. Similarly, it knows the word “the” also precedes nouns. In short, it has done its best to model the syntactical nature of a number of languages and it uses these models to denote the POS in a document.
For example, below is the first sentence from Abraham Lincoln’s Gettysburg Address:
Four score and seven years ago our fathers brought forth on this continent, a new nation, conceived in Liberty, and dedicated to the proposition that all men are created equal.
Using Lingua::TreeTagger it is trivial to convert the sentence into the following XML snippet where each element contains two attributes (a lemma of the word in question and its POS) and the word itself:
<pos><w lemma="Four" type="CD">Four</w> <w lemma="score" type="NN">score</w> <w lemma="and" type="CC">and</w> <w lemma="seven" type="CD">seven</w> <w lemma="year" type="NNS">years</w> <w lemma="ago" type="RB">ago</w> <w lemma="our" type="PP$">our</w> <w lemma="father" type="NNS">fathers</w> <w lemma="bring" type="VVD">brought</w> <w lemma="forth" type="RB">forth</w> <w lemma="on" type="IN">on</w> <w lemma="this" type="DT">this</w> <w lemma="continent" type="NN">continent</w> <w lemma="," type=",">,</w> <w lemma="a" type="DT">a</w> <w lemma="new" type="JJ">new</w> <w lemma="nation" type="NN">nation</w> <w lemma="," type=",">,</w> <w lemma="conceive" type="VVN">conceived</w> <w lemma="in" type="IN">in</w> <w lemma="Liberty" type="NP">Liberty</w> <w lemma="," type=",">,</w> <w lemma="and" type="CC">and</w> <w lemma="dedicate" type="VVN">dedicated</w> <w lemma="to" type="TO">to</w> <w lemma="the" type="DT">the</w> <w lemma="proposition" type="NN">proposition</w> <w lemma="that" type="IN/that">that</w> <w lemma="all" type="DT">all</w> <w lemma="man" type="NNS">men</w> <w lemma="be" type="VBP">are</w> <w lemma="create" type="VVN">created</w> <w lemma="equal" type="JJ">equal</w> <w lemma="." type="SENT">.</w></pos>
Each POS is represented by a different code. TreeTagger uses as many as 58 codes. Some of the less obscure are: CD for cardinal number, CC for conjunction, NN for noun, NNS for plural noun, JJ for adjective, VBP for the verb to be in the third-person plural, etc.
Using a slightly different version of the same trivial code, Lingua::TreeTagger can output a delimited stream where each line represents a record and the delimited values are words, lemmas, and POS. The first ten records from the sentence above are displayed below:
| Word | Lemma | POS |
|---|---|---|
| Four | Four | CD |
| score | score | NN |
| and | and | CC |
| seven | seven | CD |
| years | year | NNS |
| ago | ago | RB |
| our | our | PP$ |
| fathers | father | NNS |
| brought | bring | VVD |
| forth | forth | RB |
In the end I wrote a simple program — tag.pl — taking a file name as input and streaming to standard output the tagged text in delimited form. Executing the code and saving the output to a file is simple:
$ bin/tag.pl corpus/walden.txt > pos/walden.pos
Consequently, I now have a way to quickly and easily denote the POS for each word in a given plain text file.
Now that the POS of a given document are identified, the next step is to count and summarize them. Counting is something at which computers excel, and I wrote another program — summarize.pl — to do the work. The program’s input takes the following form:
summarize.pl <all|simple|other|pronouns|nouns|verbs|adverbs|adjectives> <t|l> <filename>
The first command line argument denotes what POS will be output. “All” denotes the POS defined by Tree Tagger. “Simple” denotes Tree Tagger POS mapped to the eight generally accepted POS of the English language. The use of “nouns”, “pronouns”, “verbs”, “adverbs”, and “adjectives” tells the script to output the tokens (words) or lemmas in each of these classes.
The second command line argument tells the script whether to tally tokens (words) or lemmas when counting specific items.
The last argument is the file to read, and it is expected to be in the form of tag.pl’s output.
Using summarize.pl to count the simple POS in Lincoln’s Address, the following output is generated:
$ summarize.pl simple t address.pos

noun 41

pronoun 29

adjective 21

verb 51

adverb 31

determiner 35

preposition 39

conjunction 11

interjection 0

symbol 2

punctuation 39

other 11
In other words, of the 272 words found in the Gettysburg Address 41 are nouns, 29 are pronouns, 21 are adjectives, etc.
Using a different from of the script, a list of all the pronouns in the Address, sorted by the number of occurances, can be generated:
$ summarize.pl pronouns t address.pos

we 10

it 5

they 3

who 3

us 3

our 2

what 2

their 1
In other words, the word “we” — a particular pronoun — was used 10 times in the Address.
Consequently, I now have tool enabling me to count the POS in a document.
I now have the tools necessary to answer one of my initial questions, “Do some works contain a greater number of nouns, verbs, and adjectives than others?” To answer this I collected nine sets of documents for analysis:
Using tag.pl I created POS files for each set of documents. I then used summary.pl to output counts of the simple POS from each POS file. For example, after creating a POS file for Walden, I summarized the results and learned that it contains 23,272 nouns, 10,068 pronouns, 8,118 adjectives, etc.:
$ summarize.pl simple t walden.pos

noun 23272

pronoun 10068

adjective 8118

verb 17695

adverb 8289

determiner 13494

preposition 16557

conjunction 5921

interjection 37

symbol 997

punctuation 14377

other 2632
I then copied this information into a spreadsheet and calculated the relative percentage of each POS discovering that 19% of the words in Walden are nouns, 8% are pronouns, 7% are adjectives, etc. See the table below:
| POS | % |
|---|---|
| noun | 19 |
| pronoun | 8 |
| adjective | 7 |
| verb | 15 |
| adverb | 7 |
| determiner | 11 |
| preposition | 14 |
| conjunction | 5 |
| interjection | 0 |
| symbol | 1 |
| punctuation | 12 |
| other | 2 |
I repeated this process for each of the nine sets of documents and tabulated them here:
| POS | Excursions | Rivers | Walden | Sense | Northanger | Emma | Aristotle | Shakespeare | Plato | Average |
|---|---|---|---|---|---|---|---|---|---|---|
| noun | 20 | 20 | 19 | 17 | 17 | 17 | 19 | 25 | 18 | 19 |
| verb | 14 | 14 | 15 | 16 | 16 | 17 | 15 | 14 | 15 | 15 |
| punctuation | 13 | 13 | 12 | 15 | 15 | 15 | 11 | 16 | 13 | 14 |
| preposition | 13 | 13 | 14 | 13 | 13 | 12 | 15 | 9 | 14 | 13 |
| determiner | 12 | 12 | 11 | 7 | 8 | 7 | 13 | 6 | 11 | 10 |
| pronoun | 7 | 7 | 8 | 12 | 11 | 11 | 5 | 11 | 7 | 9 |
| adverb | 6 | 6 | 7 | 8 | 8 | 8 | 6 | 6 | 6 | 7 |
| adjective | 7 | 7 | 7 | 5 | 6 | 6 | 7 | 5 | 6 | 6 |
| conjunction | 5 | 5 | 5 | 3 | 3 | 3 | 5 | 3 | 6 | 4 |
| other | 2 | 2 | 2 | 3 | 3 | 3 | 3 | 3 | 3 | 3 |
| symbol | 1 | 1 | 1 | 1 | 1 | 0 | 1 | 2 | 1 | 1 |
| interjection | 0 | 0 | 0 | 0 | 0 | 0 | 0 | 0 | 0 | 0 | Percentage and average of parts-of-speech usage in 9 works or corpra |
The result was very surprising to me. Despite the wide range of document sizes, and despite the wide range of genres, the relative percentages of POS are very similar across all of the documents. The last column in the table represents the average percentage of each POS use. Notice how the each individual POS value differs very little from the average.
This analysis can be illustrated in a couple of ways. First, below are nine pie charts. Each slice of each pie represents a different POS. Notice how all the dark blue slices (nouns) are very similar in size. Notice how all the red slices (verbs), again, are very similar. The only noticeable exception is in Shakespeare where there is a greater number of nouns and pronouns (dark green).
 Thoreau’s Excursions |
 Thoreau’s Walden |
 Thoreau’s Rivers |
 Austen’s Sense |
 Austen’s Northanger |
 Austen’s Emma |
 all of Plato |
 all of Aristotle |
 all of Shakespeare |
The similarity across all the documents can be further illustrated with a line graph:

Across the X axis is each POS. Up and down the Y axis is the percentage of usage. Notice how the values for each POS in each document are closely clustered. Each set of documents uses relatively the same number of nouns, pronouns, verbs, adjectives, adverbs, etc.
Maybe such a relationship between POS is one of the patterns of well-written documents? Maybe it is representative of works standing the test of time? I don’t know, but I doubt I am the first person to make such an observation.
My initial questions were, “To what degree are there significant differences between authors’ and genres’ usage of various parts-of-speech?” and “Do some works contain a greater number of nouns, verbs, and adjectives than others?” Based on this foray and rudimentary analysis the answers are, “No, there are not significant differences, and no, works do not contain different number of nouns, verbs, adjectives, etc.”
Of course, such a conclusion is faulty without further calculations. I will quite likely commit an error of induction if I base my conclusions on a sample of only nine items. While it would require a greater amount of effort on my part, it is not beyond possibility for me to calculate the average POS usage for every item in my Alex Catalogue. I know there will be some differences — especially considering the items having gone through optical character recognition — but I do not know the degree of difference. Such an investigation is left for a later time.
Instead, I plan to pursue a different line of investigation. The current work examined how texts were constructed, but in actuality I am more interested in the meanings works express. I am interested in what they say more than how they say it. Such meanings may be gleaned not so much from gross POS measurements but rather the words used to denote each POS. For example, the following table lists the 10 most frequently used pronouns and the number of times they occur in four works. Notice the differences:
| Walden | Rivers | Northanger | Sense |
|---|---|---|---|
| I (1,809) | it (1,314) | her (1,554) | her (2,500) |
| it (1,507) | we (1,101) | I (1,240) | I (1,917) |
| my (725) | his (834) | she (1,089) | it (1,711) |
| he (698) | I (756) | it (1,081) | she (1,553) |
| his (666) | our (677) | you (906) | you (1,158) |
| they (614) | he (649) | he (539) | he (1,068) |
| their (452) | their (632) | his (524) | his (1,007) |
| we (447) | they (632) | they (379) | him (628) |
| its (351) | its (487) | my (342) | my (598) |
| who (340) | who (352) | him (278) | they (509) |
While the lists are similar, they are characteristic of work from which they came. The first — Walden — is about an individual who lives on a lake. Notice the prominence of the word “I” and “my”. The second — Rivers — is written by the same author as the first but is about brothers who canoe down a river. Notice the higher occurrence of the word “we” and “our”. The later two works, both written by Jane Austin, are works with females as central characters. Notice how the words “her” and “she” appear in these lists but not in the former two. (Compare these lists of pronouns with the list from Lincoln’s Address and even more interesting things appear.) It looks as if there are patterns or trends to be measured here.
‘More later.
2011-02-06T00:33:06+00:00 Readings: Elements of a data management plan http://www.icpsr.umich.edu/icpsrweb/ICPSR/dmp/elements.jsp Lists things to discuss in a data management plan.This posting describes how I am beginning to visualize co-occurrences with a Javascript library called Protovis. Alternatively, I an trying to answer the question, “What did Henry David Thoreau say in the same breath when he used the word ‘walden’?”
Network diagrams are great ways to illustrate relationships. In such diagrams nodes represent some sort of entity, and lines connecting nodes represent some sort of relationship. Nodes clustered together and sharing many lines denote some kind of similarity. Conversely, nodes whose lines are long and not interconnected represent entities outside the norm or at a distance. Network diagrams are a way of visualizing complex relationships.
Are you familiar with the phrase “in the same breath”? It is usually used to denote the relationship between one or more ideas. “He mentioned both ‘love’ and ‘war’ in the same breath.” This is exactly one of the things I want to do with texts. Concordances provide this sort of functionality. Given a word or phrase, a concordance will find the query in a corpus and display the words on either side of it. A KWIK (key word in context) index, concordances make it easier to read how words or phrases are used in relationship with their surrounding words. The use of network diagrams seem like good idea to see — visualize — how words or phrases are used within the context of surrounding words.
Protovis is a Javascript charting library developed by the Stanford Visualization Group. Using Protovis a developer can create all sorts of traditional graphs (histograms, box plots, line charts, pie charts, scatter plots) through a relatively easy-to-learn API (application programmer interface). One of the graphs Protovis supports is an interactive simulation of network diagrams called “force-directed layouts“. After experiencing some of the work done by a few of my colleagues (“Thank you Michael Clark and Ed Summers“), I wondered whether or not network diagrams could be used to visualize co-occurrences in texts. After discovering Protovis, I decided to try to implement something along these lines.
The implementation of the visualization requires the recursive creation of a term matrix. Given a word (or regular expression), find the query in a text (or corpus). Identify and count the d most frequently used words within b number of characters. Repeat this process d times with each co-occurrence. For example, suppose the text is Walden by Henry David Thoreau, the query is “spring”, d is 5, and b is 50. The implementation finds all the occurrences of the word “spring”, gets the text 50 characters on either side of it, finds the 5 most commonly used words in those characters, and repeats the process for each of those words. The result is the following matrix:
| spring | day | morning | first | winter |
| day | days | night | every | today |
| morning | spring | say | day | early |
| first | spring | last | yet | though |
| winter | summer | pond | like | snow |
Thus, the most common co-occurrences for the word “spring” are “day”, “morning”, “first”, and “winter”. Each of these co-occurrences are recursively used to find more co-occurrences. In this example, the word “spring” co-occurs with times of day and seasons. These words then co-occur with more times of day and more seasons. Similarities and patterns being to emerge. Depending on the complexity of a writer’s sentence structure, the value of b (“breath”) may need to be increased or decreased. As the value of d (“detail”) is increased or decreased so does the number of co-occurrences to return.
Once this matrix is constructed, Protovis requires it to be converted into a simple JSON (Javascript Object Notation) data structure. In this example, “spring” points to “day”, “morning”, “first”, and “winter”. “Day” points to “days”, “night”, “every”, and “today”. Etc. As terms point to multiples of other terms, a network diagram is manifested, and the magic of Protovis is put to work. See the following illustration:
 “spring” in Walden |
It is interesting enough to see the co-occurrences of any given word in a text, but it is even more interesting to compare the co-occurrences between texts. Below are a number of visualizations from Thoreau’s Walden. Notice how the word “walden” frequently co-occurs with the words “pond”, “water”, and “woods”. This makes a lot of sense because Walden Pond is a pond located in the woods. Notice how the word “fish” is associated with “pond”, “fish”, and “fishing”. Pretty smart, huh?
 “walden” in Walden |
 “fish” in Walden |
 “woodchuck” in Walden |
 “woods” in Walden |
Compare these same words with the co-occurrences in a different work by Thoreau, A Week on the Concord and Merrimack Rivers. Given the same inputs the outputs are significantly different. For example, notice the difference in co-occurrences given the word “woodchuck”.
 “walden” in Rivers |
 “fish” in Rivers |
 “woodchuck” in Rivers |
 “woods” in Rivers |
Give it a try for yourself. I have written three CGI scripts implementing the things outlined above:
In each implementation you are given the opportunity to input your own queries, define the “size of the breath”, and the “level of detail”. The result is an interactive network diagram visualizing the most frequent co-occurrences of a given term.
The root of the Perl source code is located at http://infomotions.com/sandbox/network-diagrams/.
The visualization of co-occurrences obviously has implications for text mining and the digital humanities, but it also has implications for the field of librarianship.
Given the current environment where data and information abound in digital form, libraries have found themselves in an increasingly competitive environment. What are libraries to do? Lest they become marginalized, librarians can not rest on their “public good” laurels. Merely providing access to information is not good enough. Everybody feels as if they have plenty of access to information. What is needed are methods and tools for making better use of the data and information they acquire. Implementing text mining and visualization interfaces are one way to accomplish that goal within context of online library services. Do a search in the “online catalog”. Create a subset of interesting content. Click a button to read the content from a distance. Provide ways to analyze and summarize the content thus saving the time of the reader.
Us librarians have to do something differently. Think like an entrepreneur. Take account of your resources. Examine the environment. Innovate and repeat.
2011-01-10T00:34:21+00:00 Mini-musings: MIT’s SIMILE timeline widget http://infomotions.com/blog/2010/12/mits-simile-timeline-widget/For a good time, I took a stab at learning how to implement a MIT SIMILE timeline widget. This posting describes what I learned.
The MIT SIMILE Widgets are a set of cool Javascript tools. There are tools for implementing “exhibits”, time plots, “cover flow” displays a la iTunes, a couple of other things, and interactive timelines. I have always had a fondness for timelines since college when I created one to help me study for my comprehensive examinations. Combine this interest with the rise of digital humanities and my belief that library data is too textual in nature, I decided to learn how to use the timeline widget. Maybe this tool can be used in Library Land?

Screen shot of local timeline implementation
The family of SIMILE Widgets Web pages includes a number of sample timelines. By playing with the examples you can see the potencial of the tool. Going through the Getting Started guide was completely necessary since the Widget documentation has been written, re-written, and moved to other platforms numerous times. Needless to say, I found the instructions difficult to use. In a nutshell, using the Timeline Widget requires the developer to:
Taking hints from “timelines in the wild“, I decided to plot my writings — dating from 1989 to the present. Luckily, just about all of them are available via RSS (Really Simple Syndication), and they include:
Consequently, after writing my implementation’s framework, the bulk of the work was spent converting RSS files into an XML file the widget could understand. In the end I:
You can see the fruits of these labors on a page called Eric Lease Morgan’s Writings Timeline, and you can download the source code — timeline-2010-12-20.tar.gz. From there a person can scroll backwards and forwards in time, click on events, read an abstract of the writing, and hyperlink to the full text. The items from the Water Collection work in the same way but also include a thumbnail image of the water. Fun!?
I have a number of take-aways. First, my implementation is far from perfect. For example, the dates from the Water Collection are not correctly formatted in the data file. Consequently, different Javascript interpreters render the dates differently. Specifically, the Water Collection links to not show up in Safari, but they do show up in Firefox. Second, the timeline is quite cluttered in some places. There has got to be a way to address this. Third, timelines are a great way to visualize events. From the implementation you can readily see what how often I was writing and on what topics. The presentation makes so much more sense compared to a simple list sorted by date, title, or subject terms.
Library “discovery systems” could benefit from the implementation of timelines. Do a search. Get back a list of results. Plot them on a timeline. Allow the learner, teacher, or scholar to visualize — literally see — how the results of their query compare to one another. The ability to visualize information hinges on the ability to quantify information characteristics. In this case, the quantification is a set of dates. Alas, dates in our information systems are poorly recorded. It seems as if we — the library profession — have made it difficult for ourselves to participate in the current information environment.
2010-12-21T01:04:04+00:00 Life of a Librarian: 6th International Data Curation Conference http://sites.nd.edu/emorgan/2010/12/6th-international-data-curation-conference/This posting documents my experiences at the 6th International Data Curation Conference, December 6-8, 2010 in Chicago (Illinois). In a sentence, my understanding of the breath and depth of data curation was re-enforced, and the issues of data curation seem to be very similar to the issues surrounding open access publishing.


After a few pre-conference workshops which seemed to be popular, and after the reception the night before, the Conference began in earnest on Tuesday, December 7. The presentations of the day were akin to overviews of data curation, mostly from the people who were data creators.
One of the keynote addresses was entitled “Working the crowd: Lessons from Galaxy Zoo” by Chris Lintott (University of Oxford & Alder Planetarium). In it he described how images of galaxies taken as a part of the Sloan Digital Sky Survey where classified through crowd sourcing techniques — the Galaxy Zoo. Wildly popular for a limited period of time, its success was attributed to convincing people their task was useful, they were treated as collaborators (not subjects), and it was not considered a waste of time. He called the whole process “citizen science”, and he has recently launched Zooniverse in the same vein.
“Curation centres, curation services: How many are enough?” by Kevin Asjhley (Digital Curation Centre) was the second talk, and in a tongue-in-cheek way, he said the answer was three. He went on to outline they whys and wherefores of curation centers. Different players: publishers, governments, and subject centers. Different motivations: institutional value, reuse, presentation of the data behind the graph, obligation, aggregation, and education. Different debates on who should do the work: libraries, archives, computer centers, institutions, disciplines, nations, localities. He summarized by noting how data is “living”, we have a duty to promote it, it is about more than scholarly research, and finally, three centers are not really enough.
Like Lintott, Antony Williams (Royal Society of Chemistry) described a crowd sourcing project in “ChemSpider as a platform for crowd participation”. He began by demonstrating the myriad of ways Viagra has been chemically described on the the ‘Net. “Chemical information on the Internet is a mess.” ChemSpider brings together many links from chemistry-related sites and provides a means for editing them in an online environment.
Barend Mons outlined one of the common challenges of metadata. Namely, the computer’s need for structured information and most individuals’ lack of desire to create it. In “The curation challenge for the next decade: Digital overlap strategy or collective brains?” Mons advocated the creation of “nano publications” in the form of RDF statements — assertions — as a possible solution. “We need computers to create ‘reasonable’ formats.”
“Idiosyncrasy at scale: Data curation in the humanities” by John Unsworth (University of Illinois at Urbana-Champaign) was the fourth presentation of the day. Unsworth began with an interesting set of statements. “Retrieval is a precondition for use, and normalization is a precondition for retrieval, but humanities’ texts are messy and difficult to normalize.” He went on to enumerate types of textual normalization: spelling, vocabulary, punctuation, “chunking”, mark-up, and metadata. He described MONK as a normalization project. He also mentioned a recent discussion on the Alliance of Digital Humanities Organizations site where humanists debated whether or not texts ought be marked-up prior to analysis. In short, idiosyncracies abound.
The Best Student Paper Award was won by Youngseek Kim (Syracuse University) for “Education for eScience professionals: Integrating data curation and cyberinfrastructure”. In it he described the use of focus group interviews and an analysis of job postings to articulate the most common skills a person needs to be a “escience professional”. In the end he outlined three sets of skills: 1) the ability to work with data, 2) the ability to collaborate with others, and 3) the ability to work with cyberinfrastructure. The escience professional needs to have domain knowledge, a collaborative nature, and know how to work with computers. “The escience professional needs to have a range of capabilities and play a bridging role between scientists and information professionals.”
After Kim’s presentation there was a discussion surrounding the role of the librarian in data curation. While I do not feel very much came out of the discussion, I was impressed with one person’s comment. “If a university’s research data were closely tied to the institution’s teaching efforts, then much of the angst surrounding data curation would suddenly go away, and a strategic path would become clear.” I thought that comment, especially coming from a United States Government librarian, was quite insightful.
The day’s events were (more or less) summarized by Clifford Lynch (Coalition for Networked Information) with some of the following quotes. “The NSF mandate is the elephant in the room… The NSF plans are not using the language of longevity… The whole thing may be a ‘wonderful experiment’… It might be a good idea for someone to create a list of the existing data plans and their characteristics in order to see which ones play out… Citizen science is not only about analysis but also about data collection.”
The second day’s presentation were more practical in nature and seemingly geared for librarians and archivists.
In my opinion, “Managing research data at MIT: Growing the curation community one institution at a time” by MacKenzie Smith (Massachusetts Institute of Technology Libraries) was the best presentation of the conference. In it she described data curation as a “meta-discipline” as defined in Media Ecology by Marshall McLuhan, and where information can be described in terms of format, magnitude, velocity, direction, and access. She articulated how data is tricky once a person travels beyond one’s own silo, and she described curation as being about reproducing data, aggregating data, and re-using data. Specific examples include: finding data, publishing data, preserving data, referencing data, making sense of data, and working with data. Like many of the presenters, she thought data curation was not the purview of any one institution or group, but rather a combination. She compared them to layers of storage, management, linking, discovery, delivery, management, and society. All of these things are done by different groups: researchers, subject disciplines, data centers, libraries & archives, businesses, colleges & universities, and funders. She then presented an interesting set of two case studies comparing & contrasting data curation activities at the University of Chicago and MIT. Finally she described a library’s role as one of providing services and collaboration. In the jargon of Media Ecology, “Libraries are a ‘keystone’ species.”
The Best Paper Award was given to Laura Wynholds (University of California, Los Angeles) for “Linking to scientific data: Identity problems of unruly and poorly bounded digital objects”. In it she pointed out how one particular data set was referenced, accessible, and formatted from three different publications in three different ways. She went on to outline the challenges of identifying which data set to curate and how.
In “Making digital curation a systematic institutional function” Christopher Prom (University of Illinois at Urbana-Champaign) answered the question, “How can we be more systematic about bringing materials into the archives?” Using time granted via a leave of absence, Prom wrote Practical E-Records which “aims to evaluate software and conceptual models that archivists and records manager might use to identify preserve, and provide access to electronic records.” He defined trust as an essencial component of records management, and outlined the following process that needs to be done in order to build it: assess resources, wrote program statement, engage records producers, implement policies, implement repository, develop action plans, tailor workflows, and provide access.
James A. J. Wilson (University of Oxford) shared some of his experiences with data curation in “An institutional approach to developing research data management infrastructure”. According to Wilson, the Computing Services center is taking the coordinating role at Oxford when it comes to data curation, but he, like everybody else, emphasized the process is not about a single department or entity. He outlined a number of processes: planning, creation, local storage, documentation, institutional storage, discovery, retrieval, and training. He divided these processes between researchers, computing centers, and libraries. I thought one of the more interesting ideas Wilson described was DaaS (database as a service) where databases are created on demand for researchers to use.
Patricia Hswe (Penn State University) described how she and a team of other people at the University are have broken down information silos to create a data repository. Her presentation, “Responding to the call to curate: Digital curation in practice at Penn State University” outlined the use of microservices in their implementation, and she explained the successes of CurateCamps. She emphasized how the organizational context of the implementation is probably the most difficult part of the work.
Huda Kan (Cornell University) described an application to create, reuse, stage, and share research data in a presentation called “DataStaR: Using the Semantic Web approach for data curation”. The use of RDF was core to the system’s underlying data structure.
Since this was the last session in a particular concurrent track, a discussion followed Kan’s presentation. It revolved around the errors in metadata, and the discussed solutions seemed to fall into three categories: 1) write better documentation and/or descriptions of data, 2) write computer programs to statistically identify errors and then fix them, or 3) have humans do the work. In the end, the solution is probably a combination of all three.
Sometime during the conference I got the idea of creating a word cloud made up of Twitter “tweets” with the conference’s hash tag — idcc10. In a fit of creativity, I wrote the hack upon my return home, and the following illustration is the result:

Wordcloud illustrating the tweets tagged with idcc10
The Conference was attended by approximately 250 people, apparently a record. The attendees were mostly from the United States (obviously), but there it was not uncommon to see people from abroad. The Conference was truly international in scope. I was surprised at the number of people I knew but had not seen for a while because I have not been recently participating in Digital Library Federation-like circles. It was nice to rekindle old acquaintances and make some new ones.
At to be expected, the presentations outlined apparent successes based on experience. From my perspective, Notre Dame’s experience is just beginning. We ought to learn from this experience, and some of my take-aways include:
Michelle Hudson and I have had a couple more data creator interviews, and here is a list of themes from them:
Between Monday, November 8 and Thursday, November 11 I participated in three data webinars — a subset of a larger number of webinars facilitated by the ICPSR, and this posting outlines what I learned from them.
The first was called “Data Management Plans” and presented by Katherine McNeill (MIT). She gave the briefest of histories of data sharing and noted the ICPSR has been doing this since 1962. With the advent of the recent National Science Foundation announcement requiring data curation plans the interest in curation has become keen, especially in the sciences. The National Institute of Health has had similar mandate for grants over $250,000. Many of these mandates only specify the need for a “what” when it comes to plan, and not necessarily the “how”. This is slightly different from the United Kingdom’s way of doing things.
After evaluating a number of plans from a number of places, McNeill identified a set of core issues common to many of them:
How do and/or will libraries support data curation? She answered this question by listing a number of possibilities:
Somewhere along the line McNeill advocated reading ICPSR’s “Guidelines for Effective Data Management Plans” which outlines elements of data plans as well as a number of examples
The second webinar was “America’s Most Wanted: Top US Government Data Resources” presented by Lynda Kellam (The University of North Carolina at Greensboro). Kellam is a data librarian, and this session was akin to a bibliographic instruction session where a number of government data sources were described:
The final webinar I listened to was “Students Analyzing Data in the Large Lecture Class: Active Learning with SDA Online Analysis” by Jim Oberly (University of Wisconsin-Eau Claire). [5] As a historian, Oberly is interested in making history come alive for his students. To do this, he use ICPSR’s Analyze Data Online service, and this webinar demonstrated how. He began by asking questions about the Civil War such as “For economic reasons, would the institution of slavery have died out naturally, and therefore the Civil War would have been unnecessary?” Second, he identifying a data set (New Orleans Slave Sale Sample, 1804-1862) from the ICPSR containing information on the sale of slaves. Finally, he used ICPSR’s online interface to query the data looking for trends in prices. In the end, I believe he was not so sure the War could have been avoided because the prices of slaves seemed unaffected by the political environment. The demonstration was fascinating, and interface seemingly easy to use.
Based on these webinars it is an understatement to say the area of data is wide, varied, broad, and deep. Much of Library Land is steeped in books, but in the current environment books are only one of many manifestations of data, information, and knowledge. The profession is still grappling with every aspect of raw data. From its definition to its curation. From its organization to it use. From its politics to its economics.
I especially enjoyed seeing how data is being used online. Such is a growing trend, I believe, and represents a opportunity for the profession. The finding and acquisition of data sets is somewhat of a problem now, but such a thing will become less of a problem later. The bigger problem is learning how to use and understand the data. If the profession were to integrate functions for data’s use and understanding into its systems, then libraries have a growing responsibility. If the profession only seeks to enable find and access, then the opportunities are limited and short-lived. Find and access are things we know how to do. Use and understanding requires an adjustment of our skills, resources, and expertise. Are we up to the challenge?
2010-12-10T23:35:48+00:00 Readings: Implementing Open Access: policy case studies http://papers.ssrn.com/sol3/papers.cfm?abstract_id=1685855 "This leads me to the concluding suggestion that open access advocates might centre their vision on integrating open access with a new type of digital and global infrastructure that includes all research results in real time. Publishing research results then becomes a service whose rationale is to feed that infrastructure with valid and reliable results that may be used, as they emerge, in research, teaching and learning."This posting illustrates the “tweets” assigned to the hash tag #idcc10.
I more or less just got back from the 6th International Data Curation Conference that took place in Chicago (Illinois). Somewhere along the line I got the idea of applying digital humanities computing techniques against the conference’s Twitter feed — hash tag #idcc10. After installing a Perl module implementing the Twitter API (Net::Twitter::Lite), I wrote a quick hack, fed the results to Wordle, and got the following word cloud:
What sorts of conclusions can you make based on the content of the graphic?
The output static and rudimentary. What I’d really like to do is illustrate the tweets over time. Get the oldest tweets. Illustrate the result. Get the newer tweets. Update the illustration. Repeat for all the tweets. Done. In the end I see some sort of moving graphic where significant words represent bubbles. The size of the bubbles grow in size depending on number of times they are used. Each bubble is attached to other bubbles with a line representing associations. The color of the bubbles might represent parts of speech. Using this technique a person could watch the ebb and flow of the virtual conversation.
For a good time time, you can also download the Perl script used to create the textual output. Called twitter.pl, it is only forty-three lines long and many of those lines are comments.
2010-12-09T01:52:48+00:00 Mini-musings: Ruler & Compass by Andrew Sutton http://infomotions.com/blog/2010/12/ruler-compass-by-andrew-sutton/
I most thoroughly enjoyed reading and recently learning from a book called Ruler & Compass by Andrew Sutton.
The other day, while perusing the bookstore for a basic statistics book, I came across Ruler & Compass by Andrew Sutton. Having always been intrigued by geometry and the use of only a straight edge and compass to describe a Platonic cosmos, I purchased this very short book, a ruler, and a compass with little hesitation. I then rushed home to draw points, lines, and circles for the purposes of constructing angles, perpendiculars, bisected angles, tangents, all sorts of regular polygons, and combinations of all the above to create beautiful geometric patterns. I was doing mathematics, but not a single number was to be seen. Yes, I did create ratios but not with integers, and instead with the inherent lengths of lines. Facinating!
 |
||
| triangle | ||
 |
 |
|
| square | pentagon | |
 |
 |
 |
| hexagon | elipse | “golden” ratio |
Geometry is not a lot unlike both music and computer programming. All three supply the craftsman with a set of basic tools. Points. Lines. Circles. Tones. Durations. Keys. If-then statements. Variables. Outputs. Given these “things” a person is empowered to combine, compound, synthesize, analyze, create, express, and describe. They are mediums for both the artist and scientists. Using them effectively requires thinking as well as “thinquing“. All three are arscient processes.
Anybody could benefit by reading Sutton’s book and spending a few lovely hours practicing the geometric constructions contained therein. I especially recommend this activity to my fellow librarians. The process is not only intellectually stimulating but invigorating. Librarianship is not all about service or collections. It is also about combining and reconstituting core principles — collection, organization, preservation, and dissemination. There is an analogy to be waiting to be seen here. Reading and doing the exercises in Ruler & Compass will make this plainly visible.
2010-12-06T01:44:48+00:00 Mini-musings: Text mining Charles Dickens http://infomotions.com/blog/2010/12/text-mining-charles-dickens/This posting outlines how a person can do a bit of text mining against three works by Charles Dickens using a set of two Perl modules — Lingua::EN::Ngram and Lingua::Concordance.
I recently wrote a Perl module called Lingua::EN::Ngram. Its primary purpose is to count all the ngrams (two-word phrases, three-word phrases, n-word phrases, etc.) in a given text. For two-word phrases (bigrams) it will order the output according to a statistical probability (t-score). Given a number of texts, it will count the ngrams common across the corpus. As of version 0.02 it supports non-ASCII characters making it possible to correctly read and parse a greater number of Romantic languages — meaning it correctly interprets characters with diacritics. Lingua::EN::Ngram is available from CPAN.
Concordances are just about the oldest of textual analysis tools. Originally developed in the Late Middle Ages to analyze the Bible, they are essentially KWIC (keyword in context) indexes used to search and display ngrams within the greater context of a work. Given a text (such as a book or journal article) and a query (regular expression), Lingua::Concordance can display the occurrences of the query in the text as well as map their locations across the entire text. In a previous blog posting I used Lingua::Concordance to compare & contrast the use of the phrase “good man” in the works of Aristotle, Plato, and Shakespeare. Lingua::Concordance too is available from CPAN.
In keeping with the season, I wondered about Charles Dickens’s A Christmas Carol. How often is the word “Christmas” used in the work and where? In terms of size, how does A Christmas Carol compare to some of other Dickens’s works? Are there sets of commonly used words or phrases between those texts?
Answering the first question was relatively easy. The word “Christmas” is occurs eighty-six (86) times, and twenty-two (22) of those occurrences are in the the first ten percent (10%) of the story. The following bar chart illustrates these facts:

The length of books (or just about any text) measured in pages in ambiguous, at best. A much more meaningful measure is number of words. The following table lists the sizes, in words, of three Dickens stories:
| story | size in words |
|---|---|
| A Christmas Carol | 28,207 |
| Oliver Twist | 156,955 |
| David Copperfield | 355,203 |
For some reason I thought A Christmas Carol was much longer.
A long time ago I calculated the average size (in words) of the books in my Alex Catalogue. Once I figured this out, I discovered I could describe items in the collection based on relative sizes. The following “dial” charts bring the point home. Each one of the books is significantly different in size:
 A Christmas Carol |
 Oliver Twist |
 David Copperfield |
If a person were pressed for time, then which story would you be able to read?
After looking for common ngrams between texts, I discovered that “taken with a violent fit of” appears both David Copperfield and A Christmas Carol. Interesting!? Moreover, the phrase “violent fit” appears on all three works. Specifically, characters in these three Dickens stories have violent fits of laughter, crying, trembling, and coughing. By concatenating the stories together and applying concordancing methods I see there are quite a number of violent things in the three stories:
  n such breathless haste and violent agitation, as seemed to betoken so
  ood-night, good-night!' The violent agitation of the girl, and the app
  sberne) entered the room in violent agitation. 'The man will be taken,
  o understand that, from the violent and sanguinary onset of Oliver Twi
  one and all, to entertain a violent and deeply-rooted antipathy to goi
  eep a little register of my violent attachments, with the date, durati
  cal laugh, which threatened violent consequences. 'But, my dear,' said
  in general, into a state of violent consternation. I came into the roo
  artly to keep pace with the violent current of her own thoughts: soon
  ts and wiles have brought a violent death upon the head of one worth m
   There were twenty score of violent deaths in one long minute of that
  id the woman, making a more violent effort than before; 'the mother, w
   as it were, by making some violent effort to save himself from fallin
  behind. This was rather too violent exercise to last long. When they w
   getting my chin by dint of violent exertion above the rusty nails on
  en who seem to have taken a violent fancy to him, whether he will or n
  peared, he was taken with a violent fit of trembling. Five minutes, te
  , when she was taken with a violent fit of laughter; and after two or
  he immediate precursor of a violent fit of crying. Under this impressi
  and immediately fell into a violent fit of coughing: which delighted T
  of such repose, fell into a violent flurry, tossing their wild arms ab
   and accompanying them with violent gesticulation, the boy actually th
  ght I really must have laid violent hands upon myself, when Miss Mills
   arm tied up, these men lay violent hands upon him -- by doing which,
   every aggravation that her violent hate -- I love her for it now -- c
   work himself into the most violent heats, and deliver the most wither
  terics were usually of that violent kind which the patient fights and
   me against the donkey in a violent manner, as if there were any affin
   to keep down by force some violent outbreak. 'Let me go, will you,--t
  hands with me - which was a violent proceeding for him, his usual cour
  en.' 'Well, sir, there were violent quarrels at first, I assure you,'
  revent the escape of such a violent roar, that the abused Mr. Chitling
  t gradually resolved into a violent run. After completely exhausting h
  , on which he ever showed a violent temper or swore an oath, was this
  ullen, rebellious spirit; a violent temper; and an untoward, intractab
  fe of Oliver Twist had this violent termination or no. CHAPTER III REL
  in, and seemed to presage a violent thunder-storm, when Mr. and Mrs. B
  f the theatre, are blind to violent transitions and abrupt impulses of
  ming into my house, in this violent way? Do you want to rob me, or to
These observations simply beg other questions. Is violence a common theme in Dickens works? What other adjectives are used to a greater or lesser degree in Dickens works? How does the use of these adjectives differ from other authors of the same time period or within the canon of English literature?
The combination of the Internet, copious amounts of freely available full text, and ubiquitous as well as powerful desktop computing, it is now possible to analyze texts in ways that was not feasible twenty years ago. While the application of computing techniques against texts dates back to at least Father Busa’s concordance work in the 1960s, it has only been in the last decade that digital humanities has come into its own. The application of digital humanities to library work offers great opportunities for the profession. Their goals are similar and their tools are complementary. From my point of view, their combination is a marriage made in heaven.
A .zip file of the texts and scripts used to do the analysis is available for you to download and experiment with yourself. Enjoy.
2010-12-04T13:03:30+00:00 Mini-musings: AngelFund4Code4Lib http://infomotions.com/blog/2010/12/angelfund4code4lib/The second annual AngelFund4Code4Lib — a $1,500 stipend to attend Code4Lib 2011 — is now accepting applications.
These are difficult financial times, but we don’t want this to dissuade people from attending Code4Lib. [1] Consequently a few of us have gotten together, pooled our resources, and made AngelFund4Code4Lib available. Applying for the stipend is easy. In 500 words or less, write what you hope to learn at the conference and email it to angelfund4code4lib@infomotions.com. We will then evaluate the submissions and select the awardee. In exchange for the financial resources, and in keeping with the idea of giving back to the community, the awardee will be expected to write a travelogue describing their take-aways and post it to the Code4Lib mailing list.
The deadline for submission is 5 o’clock (Pacific Time), Thursday, December 17. The awardee will be announced no later than Friday, January 7.
Submit your application. We look forward to helping you out.
If you would like to become an “angel” too, then drop us a line. We’re open to possibilities.
P.S. Check out the additional Code4Lib scholarships. [2]
[1] Code4Lib 2011 – http://code4lib.org/conference/2011/
[2] addtional scholarships – http://bit.ly/dLGnnx
Eric Lease Morgan,
Michael J. Giarlo, and
Eric Hellman
This posting describes how crowd sourcing techniques are being used to determine the “greatness” of the Great Books.
The Great Books of the Western World is a set of books authored by “dead white men” — Homer to Dostoevsky, Plato to Hegel, and Ptolemy to Darwin. [1] In 1952 each item in the set was selected because the set’s editors thought the selections significantly discussed any number of their 102 Great Ideas (art, cause, fate, government, judgement, law, medicine, physics, religion, slavery, truth, wisdom, etc.). By reading the books, comparing them with one another, and discussing them with fellow readers, a person was expected to foster their on-going liberal arts education. Think of it as “life long learning” for the 1950s.
I have devised and implemented a mathematical model for denoting the “greatness” of any book. The model is based on term frequency inverse document frequency (TFIDF). It is far from complete, nor has it been verified. In an effort to address the later, I have created the Great Books Survey. Specifically, I am asking people to vote on which books they consider greater. If the end result is similar to the output of my model, then the model may be said to represent reality.
 The survey itself is an implementation of the Condorcet method. (“Thanks Andreas.”) First, I randomly select one of the Great Ideas. I then randomly select two of the Great Books. Finally, I ask the poll-taker to choose the “greater” of the two books based on the given Great Idea. For example, the randomly selected Great Idea may be war, and the randomly selected Great Books may be Shakespeare’s Hamlet and Plato’s Republic. I then ask, “Which is book is ‘greater’ in terms of war?” The answer is recorded and an additional question is generated. The survey is never-ending. After 100’s of thousands of votes are garnered I hope too learn which books are the greatest because they got the greatest number of votes.
Because the survey results are saved in an underlying database, it is trivial to produce immediate feedback. For example, I can instantly return which books have been voted greatest for the given idea, how the two given books compare to the given idea, a list of “your” greatest books, and a list of all books ordered by greatness. For a good time, I am also geo-locating voters’ IP addresses and placing them on a world map. (“C’mon Antartica. You’re not trying!”)
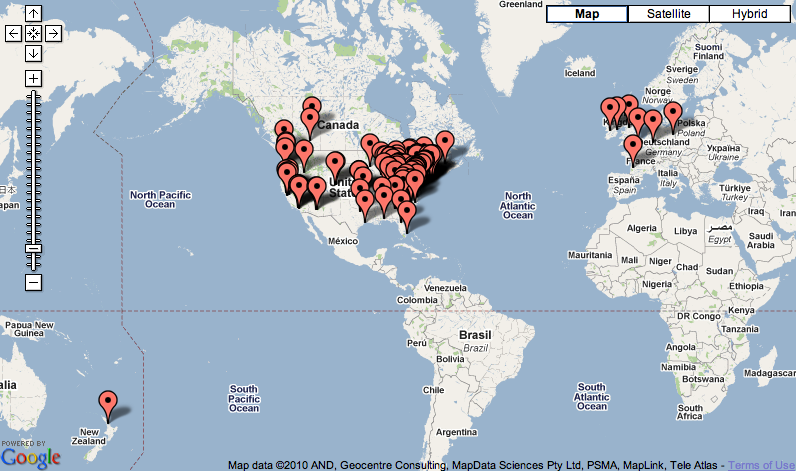 The survey was originally announced on Tuesday, November 2 on the Code4Lib mailing list, Twitter, and Facebook. To date it has been answered 1,247 times by 125 people. Not nearly enough. So far, the top five books are:
There are a number of challenging aspects regarding the validity of the survey. For example, many people feel unqualified to answer some of the randomly generated questions because they have not read the books. My suggestion is, “Answer the question anyway,” because given enough votes randomly answered questions will cancel themselves out. Second, the definition of “greatness” is ambiguous. It is not intended to be equated with popularity but rather the “imaginative or intellectual content” the book exemplifies. [2] Put in terms of a liberal arts education, greatness is the degree a book discusses, defines, describes, or alludes to the given idea more than the other. Third, people have suggested I keep track of how many times people answer with “I don’t know and/or neither”. This is a good idea, but I haven’t implemented it yet.
Please answer the survey 10 or more times. It will take you less than 60 seconds if you don’t think about it too hard and go with your gut reactions. There are no such things as wrong answers. Answer the survey about 100 times, and you will may get an idea of what types of “great books” interest you most.
Vote early. Vote often.
[1] Hutchins, Robert Maynard. 1952. Great books of the Western World. Chicago: Encyclopedia Britannica.
[2] Ibid. Volume 3, page 1220.
2010-11-06T16:16:24+00:00 Mini-musings: Great Books data set http://infomotions.com/blog/2010/11/great-books-data-set/
 This posting makes the Great Books data set freely available.
As described previously, I want to answer the question, “How ‘great’ are the Great Books?” In this case I am essentially equating “greatness” with statistical relevance. Specifically, I am using the Great Books of the Western World’s list of “great ideas” as search terms and using them to query the Great Books to compute a numeric value for each idea based on term frequency inverse document frequency (TFIDF). I then sum each of the great idea values for a given book to come up with a total score — the “Great Ideas Coefficient”. The book with the largest Coefficient is then considered the “greatest” book. Along the way and just for fun, I have also kept track of the length of each book (in words) as well as two scores denoting each book’s reading level, and one score denoting each book’s readability.
The result is a canonical XML file named great-books.xml. This file, primarily intended for computer-to-computer transfer contains all the data outlined above. Since most data analysis applications (like databases, spreadsheets, or statistical packages) do not deal directly with XML, the data was transformed into a comma-separated value (CSV) file — great-books.csv. But even this file, a matrix of 220 rows and 104 columns, can be a bit unwieldily for the uninitiated. Consequently, the CSV file has been combined with a Javascript library (called DataTables) and embedded into an HTML for file general purpose use — great-books.htm.
The HTML file enables you to sort the matrix by column values. Shift click on columns to do sub-sorts. Limit the set by entering queries into the search box. For example:
Even more interesting questions may be asked of the data set. For example, is their a correlation between greatness and readability? If a work has a high love score, then it is likely it will have a high (or low) score from one or more of the other columns? What is the greatness of the “typical” Great Book? Is this best represented as the average of the Great Ideas Coefficient or would it be better stated as the value of the mean of all the Great Ideas? In the case of the later, which books are greater than most, which books are typical, an which books are below typical? This sort of analysis, as well as the “kewl” Web-based implementation, is left up the the gentle reader.
Now ask yourself, “Can all of these sorts of techniques be applied to the principles and practices of librarianship, and if so, then how?”
2010-11-06T13:42:20+00:00 Life of a Librarian: Data tsunamis and explosions http://sites.nd.edu/emorgan/2010/10/data-tsunamis-and-explosions/Michelle Hudson and I have visited more teaching & research faculty across campus learning about their uses, needs, and wants when it comes to data. As one person put it, we are preparing for the “Data Tsunami”, or as another person put it — the “Data Explosion”. We have learned a few more things:
We are also learning that no one person or group seems to have a complete handle on the issues surrounding data. Michelle and I certainly don’t. Everybody knows a lot but not everything. Consquently, we are thinking of hosting “Data Day” — a time and place when many of the people who deal with data for teaching and research get together, share war stories, and learn from each others’ experience. In the end we may understand how to be more efficient and prepared with the “tsumami” is actually upon us.
Off to interview more people… ‘More later.
2010-10-29T00:24:53+00:00 Life of a Librarian: David Dickinson and New Testament manuscripts http://sites.nd.edu/emorgan/2010/10/david-dickinson-and-new-testament-manuscripts/Yesterday David Dickinson came to visit the libraries to share and discuss some of his work regarding optical character recognition of New Testament manuscripts.
David Dickinson is a South Bend resident and Renaissance Man with a multifaceted educational background and vocational history. Along the way he became keenly interested in religion as well as computer programming. On and off for the past five years or so, and working in conjunction with the Center for the Study of New Testament Manuscripts, he has been exploring the possibilities of optical character recognition against New Testament manuscripts. Input very large digitized images of a really, really old original New Testament manuscripts. Programmatically examine each man-made mark in the image. Use artificial intelligence computing techniques to determine (or guess) which “letter” the mark represents. Save the resulting transcription to a file. And finally, provide a means for the Biblical scholar to simultaneously compare the image with the resulting transcription and a “canonical” version of a displayed chapter/verse.
David’s goal is not so much to replace the work being done by scholars but rather to save their time. Using statistical techniques, he knows computer programs can work tirelessly to transcribe texts. These transcriptions are then expected to be reviewed by people. The results are then expected to be shared widely thus enabling other scholars to benefit.
David’s presentation was attended by approximately twenty people representing the Libraries, the Center for Social Research, and the Center for Research Computing. After the formal presentation a number of us discussed how David’s technology may or may not be applicable to the learning, teaching, and scholarship being done here at the University. For example, there are a number of Biblical scholars on campus, but many of them seem to focus on the Old Testament as opposed to the New Testament. The technology was deemed interesting but some people thought it could not replace man-made transcriptions. Others wondered about the degree the technology could be applied against manuscripts other the New Testament. In the end there were more questions than answers.
Next steps? Most of us thought David’s ideas were not dead-ends. Consequently, it was agreed that next steps will include presenting the technology to local scholars in an effort to learn whether or not it is applicable to their needs and the University’s.
2010-10-20T00:49:23+00:00 Life of a Librarian: Data curation at ECDL 2010 http://sites.nd.edu/emorgan/2010/10/data-curation-at-ecdl-2010/
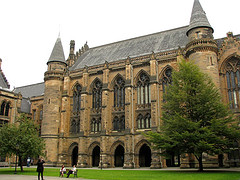
This posting outlines my experiences at the European Conference on Digital Libraries (ECDL), September 7-9, 2010 in Glasgow (Scotland). From my perspective, many of the presentations were about information retrieval and metadata, and the advances in these fields felt incremental at best. This does not mean I did not learn anything, but it does re-enforce my belief that find is no longer the current problem to be solved.
 University of Glasgow |
 vaulted ceiling |
 Adam Smith |
After the usual logistic introductions, the Conference was kicked off with a keynote address by Susan Dumais (Microsoft) entitled The Web changes everything: Understanding and supporting people in dynamic information environments. She began, “Change is the hallmark of digital libraries… digital libraries are dynamic”, and she wanted to talk about how to deal with this change. “Traditional search & browse interfaces only see a particular slice of digital libraries. An example includes the Wikipedia article about Bill Gates.” She enumerated at least two change metrics: the number of changes and the time between changes. She then went about taking snapshots of websites, measuring the changes, and ultimately dividing the observations into at least three “speeds”: fast, medium, and slow. In general the quickly changing sites (fast) had a hub & spoke architecture. The medium change speed represented popular sites such as mail and Web applications. The slowly changing sites were generally entry pages or sites accessed via search. “Search engines need to be aware of what people seek and what changes over time. Search engines need to take change into account.” She then demonstrated an Internet Explorer plug-in (DiffIE) which highlights the changes in a website over time. She advocated weighing search engine results based on observed changes in a website’s content.
Visualization was the theme of Sascha Tönnies‘s (L3S Research) Uncovering hidden qualities — Benefits of quality measures for automatic generated metadata. She described the use of tag clouds with changes in color and size. The experimented with “growbag” graphs which looked a lot of network graphs. She also explored the use of concentric circle diagrams (CCD), and based on her observations people identified with them very well. “In general, people liked the CDD graph the best because the radius intuitively represented a distance from the central idea.”
What appeared to me as the interpretation of metadata schemes through the use of triples, Panorea Gaitanou (Ionian University) described a way to query many cultural heritage institution collections in Query transformation in a CIDOC CRM Based cultural metadata integration environment. He called the approach MDL (Metadata Description Language). Lots of mapping and lots of XPath.
Michael Zarro (Drexel University) evaluated user comments written against the Library of Congress Flickr Commons Project in User-contributed descriptive metadata for libraries and cultural institutions. As a result, he was able to group the comments into at least four types. The first, personal/historical, were exemplified by things like, “I was there, and that was my grandfather’s house.” The second, links out, pointed to elaborations such as articles on Wikipedia. The third, corrections/translations, were amendments or clarifications. The last, links in, were pointers to Flickr groups. The second type of annotations, links out, were the most popular.
 thistle |
 rose |
 purple flower |
Developing services to support research data management and sharing was a panel discussion surrounding the topic of data curation. My take-away from Sara Jone‘s (DDC) remarks was, “There are no incentives for sharing research data”, and when given the opportunity for sharing data owners react by saying things like, “I’m giving my baby away… I don’t know the best practices… What are my roles and responsibilities?” Veerle Van den Eynden (United Kingdom Data Archive) outlined how she puts together infrastructure, policy, and support (such as workshops) to create successful data archives. “infrastructure + support + policy = data sharing” She enumerated time, attitudes and privacy/confidentiality as the bigger challenges. Robin Rice (EDINA) outlined services similar to Van den Eynden’s but was particularly interested in social science data and its re-use. There is a much longer tradition of sharing social science data and it is definitely not intended to be a dark archive. He enumerated a similar but different set of barriers to sharing: ownership, freedom of errors, fear of scooping, poor documentation, and lack of rewards. Rob Grim (Tilburg University) was the final panelist. He said, “We want to link publications with data sets as in Economists Online, and we want to provide a number of additional services against the data.” He described data sharing incentive, “I will only give you my data if you provide me with sets of services against it such as who is using it as well as where it is being cited.” Grim described the social issues surrounding data sharing as the most important. He compared & contrasted sharing with preservation, and re-use with archiving. “Not only is it important to have the data but it is also important to have the tools that created the data.”
From what I could gather, Claudio Gennaro (IST-CNR) in An Approach to content-based image retrieval based on the Lucene search engine library converted the binary content of images in to strings, indexed the strings with Lucene, and then used Lucene’s “find more like this one” features to… find more like this one.
Stina Westman (Aalto University) gave a paper called Evaluation constructs for visual video summaries. She said, “I want to summarize video and measure things like quality, continuity, and usefulness for users.” To do this she enumerated a number of summarizing types: 1) storyboard, 2) scene clips, 3) fast forward technologies, and 4) user-controlled fast forwarding. After measuring satisfaction, scene clips provided the best recognition but storyboards were more enjoyable. The clips and fast forward technologies were perceived as the best video surrogates. “Summaries’ usefulness are directly proportional to the effort to use them and the coverage of the summary… There is little difference between summary types… There is little correlation between the type of performance and satisfaction.”
Frank Shipman (Texas A&M University) in his Visual expression for organizing and accessing music collections in MusicWiz asked himself, “Can we provide access to music collections without explicit metadata; can we use implicit metadata instead?” The implementation of his investigation was an application called MusicWiz which is divided into a user interface and an inference engine. It consists of six modules: 1) artist, 2) metadata, 3) audio signal, 4) lyrics, 5) a workspace expression, and 6) similarity. In the end Shipman found “benefits and weaknesses to organizing personal music collections based on context-independent metadata… Participants found the visual expression facilitated their interpretation of mood… [but] the lack of traditional metadata made it more difficult to locate songs…”
 distillers |
 barrels |
 whiskey |
Liina Munari (European Commission) gave the second day’s keynote address called Digital libraries: European perspectives and initiatives. In it she presented a review of the Europeana digital library funding and future directions. My biggest take-aways was the following quote: “Orphan works are the 20th Century black hole.”
Stephan Strodl (Vienna University of Technology) described a system called Hoppla facilitating back-up and providing automatic migration services. Based on OAIS, it gets its input from email, a hard disk, or the Web. It provides data management access, preservation, and storage management. The system outsources the experience of others to implement these services. It seemingly offers suggestions on how to get the work done, but it does not actually do the back-ups. The title of his paper was Automating logical preservation for small institutions with Hoppla.
Alejandro Bia (Miguel Hernández University) in Estimating digitization costs in digital libraries using DiCoMo advocated making a single estimate for digitizing, and then making the estimate work. “Most of the cost in digitization is the human labor. Other things are known costs.” Based on past experience Bia graphed a curve of digitization costs and applied the curve to estimates. Factors that go into the curve includes: skill of the labor, familiarity with the material, complexity of the task, the desired quality of the resulting OCR, and the legibility of the original document. The whole process reminded me of Medieval scriptoriums.
 city hall |
 lion |
 stair case |
Andrew McHugh (University of Glasgow) presented In pursuit of an expressive vocabulary for preserved New Media art. He is trying to preserve (conserve) New Media art by advocating the creation of medium-independent descriptions written by the artist so the art can be migrated forward. He enumerated a number of characteristics of the art to be described: functions, version, materials & dependencies, context, stakeholders, and properties.
In An Analysis of the evolving coverage of computer science sub-fields in the DBLP digital library Florian Reitz (University of Trier) presented an overview of the Digital Bibliography & Library Project (DBLP) — a repository of computer science conference presentations and journal articles. The (incomplete) collection was evaluated, and in short he saw the strengths and coverage of the collection change over time. In a phrase, he did a bit of traditional collection analysis against is non-traditional library.
A second presentation, Analysis of computer science communities based on DBLP, was then given on the topic of the DBLP, this time by Maria Biryukov (University of Luxembourg). She first tried to classify computer science conferences into sets of subfields in an effort to rank which conferences were “better”. One way this was done was through an analysis of who participated, the number of citations, the number of conference presentations, etc. She then tracked where a person presented and was able to see flows and patterns of publishing. Her conclusion — “Authors publish all over the place.”
In Citation graph based ranking in Invenio by Ludmila Marian (European Organization for Nuclear Research) the question was asked, “In a database of citations consisting of millions of documents, how can good precision be achieved if users only supply approximately 2-word queries?” The answer, she says, may lie in citation analysis. She weighed papers based on the number and locations of citations in a manner similar to Google PageRank, but in the end she realized the imperfection of the process since older publications seemed to unnaturally float to the top.
Sandra Toze (Dalhousie University) wanted to know how digital libraries support group work. In her Examining group work: Implications for the digital library as sharium she described the creation of an extensive lab for group work. Computers. Video cameras. Whiteboards. Etc. Students used her lab and worked in a manner she expected doing administrative tasks, communicating, problem solving, and the generation of artifacts. She noticed that the “sharium” was a valid environment for doing work, but she noticed that only individuals did information seeking while other tasks were done by the group as a whole. I found this later fact particularly interesting.
In an effort to build and maintain reading lists Gabriella Kazai (Microsoft) presented Architecture for a collaborative research environment based on reading list sharing. The heart of the presentation was a demonstration of ScholarLynk as well as Research Desktop — tools to implement “living lists” of links to knowledge sources. I went away wondering whether or not such tools save people time and increase knowledge.
The last presentation I attended was by George Lucchese (Texas A&M University) called CritSpace: A Workplace for critical engagement within cultural heritage digital libraries where he described a image processing tool intended to be used by humanities scholars. The tool does image processing, provides a workspace, and allows researchers to annotate their content.
 Bothwell Castle |
 Stirling Castle |
 Doune Castle |
It has been just more than one month since I was in Glasgow attending the Conference, and much of the “glow” (all onomonopias intended) has worn off. The time spent was productive. For example, I was able to meet up with James McNulty (Open University) who spent time at Notre Dame with me. I attended eighteen presentations which were deemed innovative and scholarly by way of extensive review. I discussed digital library issues with numerous people and made an even greater number of new acquaintances. Throughout the process I did some very pleasant sight seeing both with conference attendees and on my own. At the same time I do not feel as if my knowledge of digital libraries was significantly increased. Yes, attendance was intellectually stimulating demonstrated by the number of to-do list items written in my notebook during the presentations, but the topics of discussion seemed worn out and not significant. Interesting but only exemplifying subtle changes from previous research.
My attendance was also a mission. More specifically, I wanted to compare & contrast the work going on here with the work being done at the 2010 Digital Humanities conference. In the end, I believe the two groups are not working together but rather, as one attendee put it, “talking past one another.” Both groups — ECDL and Digital Humanities — have something in common — libraries and librarianship. But on one side are computer scientists, and on the other side are humanists. The first want to implement algorithms and apply them to many processes. If such a thing gets out of hand, then the result is akin to a person owning a hammer and everything looking like a nail. The second group is ultimately interested in describing the human condition and addressing questions about values. This second process is exceedingly difficult, if not impossible, to measure. Consequently any sort of evaluation is left up to a great deal of subjectivity. Many people would think these two processes are contradictory and/or conflicting. In my opinion, they are anything but in conflict. Rather, these two processes are complementary. One fills the deficiencies of the other. One is more systematic where the other is more judgmental. One relates to us as people, and the other attempts to make observations devoid of human messiness. In reality, despite the existence of these “two cultures”, I see the work of the scientists and the work of the humanists to be equally necessary in order for me to make sense of the world around me. It is nice to know libraries and librarianship seem to represent a middle ground in this regard. Not ironically, that is one of most important reasons I explicitly chose my profession. I desired to practice both art and science — arscience. It is just too bad that these two groups do not work more closely together. There seems to be too much desire for specialization instead. (Sigh.)
Because of a conflict in acronyms, the ECDL conference has all but been renamed to Theory and Practice of Digital Libraries (TPDL), and next year’s meeting will take place in Berlin. Despite the fact that this was my third for fourth time attending ECDL, and I doubt I will attend next year. I do not think information retrieval and metadata standards are as important as they have been. Don’t get me wrong. I didn’t say they were unimportant, just not as important as they used to be. Consequently, I think I will be spending more of my time investigating the digital humanities where content has already been found and described, and is now being evaluated and put to use.
 River Clyde |
 River Teith |
 Dan Marmion recruited and hired me to work at the University of Notre Dame during the Summer of 2001. The immediate goal was to implement a “database-driven website”, which I did with the help of the Digital Access and Information Architecture Department staff and MyLibrary.
About eighteen months after I started working at the University I felt settled in. It was at that time when I realized I had accomplished all the goals I had previously set out for myself. I had a family. I had stuff. I had the sort of job I had always aspired to have in a place where I aspired to have it. I woke up one morning and asked myself, “Now what?”
After a few months of cogitation I articulated a new goal: to raise a happy, healthy, well-educated child. (I only have one.) By now my daughter is almost eighteen years old. She is responsible and socially well-adjusted. She is stands up straight and tall. She has a pretty smile. By this time next year I sincerely believe she will be going to college with her tuition paid for by Notre Dame. Many of the things that have been accomplished in the past nine years and many of the things to come are results from Dan hiring me.
Dan Marmion died Wednesday, September 22, 2010 from brain cancer. “Dan, thank you for the means and the opportunities. You are sorely missed.”
2010-10-03T20:09:30+00:00 Readings: Interpreting MARC: Where’s the Bibliographic Data? http://journal.code4lib.org/articles/3832 "Programmers who must write the code to interpret MARC have the daunting task of trying to understand a data format that is inherently alien to them. The aforementioned fact and insight can, perhaps, help make MARC seem slightly less alien to the programming mind—specifically upon examining the implications... First, a MARC record does contain an explicit structure. It contains fields, subfields, and indicators, and our tools for processing MARC give us the ability to extract discrete, granular chunks of data just as we would from, e.g., a database. Concrete rules and semantics define the data that goes into a MARC record and dictate the use of the fields and subfields. When we must interpret, extract, or otherwise act upon the data, the documented rules and semantics can help guide our interpretation... Second, data within a single MARC field often behaves like document markup. Unlike data occurring in a database, data expressed through document markup gains some degree of meaning based upon its context within the document and its relation to other data within the document. In MARC, punctuation that appears in one subfield can subtly change the meaning of data in a different subfield; changing subfield order can also subtly change the data’s meaning.Michele Hudson and I have begun visiting faculty across campus in an effort to learn about data needs and desires. We’re diddling with data. To date, we have only visited two (and a half) people, but I have learned a few things:
That is what I’ve learned so far. ‘More later.
2010-09-30T00:39:06+00:00 Mini-musings: Great Books data dictionary http://infomotions.com/blog/2010/09/great-books-data-dictionary/This is a sort of Great Books data dictionary in that it describes the structure and content of two data files containing information about the Great Books of the Western World.
The data set is manifested in two files. The canonical file is great-books.xml. This XML file consists of a root element (great-books) and many sub-elements (books). The meat of the file resides in these sub-elements. Specifically, with the exception of the id attribute, all the book attributes enumerate integers denoting calculated values. The attributes words, fog, and kincaid denote the length of the work, two grade levels, and a readability score, respectively. The balance of the attributes are “great ideas” as calculated through a variation Term Frequency Inverse Document Frequency (TFIDF) cumulating in a value called the Great Ideas Coefficient. Finally, each book element includes sub-elements denoting who wrote the work (author), the work’s name (title), the location of the file was used as the basis of the calculations (local_url), and the location of the original text (original_url).
The second file (great-books.csv) is a derivative of the first file. This comma-separated file is intended to be read by something like R or Excel for more direct manipulation. It includes all the information from great-books.xml with the exception of the author, title, and URLs.
Given either one of these two files the developer or statistician is expected to evaluate or re-purpose the results of the calculations. For example, given one or the other of these files the following questions could be answered:
The really adventurous developer will convert the XML file into JSON and then create a cool (or “kewl”) Web interface allowing anybody with a browser to do their own evaluation and presentation. This is an exercise left up to the reader.
2010-09-24T11:13:27+00:00 Life of a Librarian: Data curation in Purdue http://sites.nd.edu/emorgan/2010/09/data-curation-in-purdue/On Wednesday, September 22, 2010 a number of us from Notre Dame (Eric Morgan, Julie Arnott, Michelle Hudson, and Rick Johnson) went on a road trip to visit a number of people from Purdue (Christopher Miller, Dean Lingley, Jacob Carlson, Mark Newton, Matthew Riehle, Michael Witt, and Megan Sapp Nelson). Our joint goal was to share with each other our experiences regarding data curation.

After introductions, quite a number of talking points were enumerated (Purdue’s IMLS project, their E-Data Taskforce and data repository prototype, data literacy, data citation, and electronic theses & dissertation data curation). But we spent the majority of our formal meeting talking about their Data Curation Profile toolkit. Consisting of a number of questions, the toolkit is intended to provide the framework for discussions with data creators (researchers, scholars, graduate students, faculty, etc.). “It is a way to engage the faculty… It is generic (modular) and intended to form a baseline for understanding… It is used as a guide to learn about the data and the researcher’s needs.” From the toolkit’s introduction:
A completed Data Curation Profile will contain two types of information about a data set. First, the Profile will contain information about the data set itself, including its current lifecycle, purpose, forms, and perceived value. Second, a Data Curation Profile will contain information regarding a researcher’s needs for the data including how and when the data should be made accessible to others, what documentation and description for the data are needed, and details regarding the need for the preservation of the data.
The Purdue folks are tentatively scheduled to give workshops around the country on the use of the toolkit, and I believe one of those workshops will be at the upcoming International Digital Curation Conference taking place in Chicago (December 6-8).
We also talked about infrastructure — both technical and human. We agreed that the technical infrastructure, while not necessarily trivial, could be created and maintained. On the other hand the human infrastructure may be more difficult to establish. There are hosts of issues to address listed here in no priority order: copyright & other legal issues, privacy & anonymity, business models & finances, workflows & true integration of services, and the articulation of roles played by librarians, curators, faculty, etc. “There is a need to build lots of infrastructure, both technical as well as human. The human infrastructure does not scale as well as the technical infrastructure.” Two examples were outlined. One required a couple of years of relationship building, and the other required cultural differences to be bridged.
We then retired to lunch and shared more of our experiences in a less formal atmosphere. We discussed “micro curation services”, data repository bibliographies, and the need to do more collaboration since our two universities have more in common than differences. Ironically, one of the projects being worked on at Purdue involves Notre Dame faculty, but alas, none of us from Notre Dame knew of the project’s specifics.
Yes, the drive was long and the meeting relatively short, but everybody went away feeling like their time was well-spent. “Thank you for hosting us!”
2010-09-23T05:28:40+00:00 Mini-musings: Twitter, Facebook, Delicious, and Alex http://infomotions.com/blog/2010/09/twitter-facebook-delicious-and-alex/I spent time last evening and this afternoon integrating Twitter, Facebook, and Delicious into the my Alex Catalogue. The process was (almost) trivial:
Because of this process I am able to “tweet” from Alex, its search results, any of the etexts in the collection, as well as any results from the use of the concordances. These tweets then get echoed to Facebook.
(I tried to link directly to Facebook using their Like Button, but the process was cumbersome. Iframes. Weird, Facebook-specific Javascript. Pulling too much content from the header of my pages. Considering the Twitter application for Facebook, the whole thing was not worth the trouble.)
I find it challenging to write meaningful 140 character comments on the Alex Catalogue, especially since the URLs take up such a large number of the characters. Still, I hope to regularly find interesting things in the collection and share them with the wider audience. To see the fruits of my labors to date, see my Twitter feed — http://twitter.com/ericleasemorgan.
Only time will tell whether or not this “social networking” thing proves to be beneficial to my library — all puns intended.
2010-09-18T23:20:20+00:00 Mini-musings: Where in the world are windmills, my man Friday, and love? http://infomotions.com/blog/2010/09/where-in-the-world-are-windmills-my-man-friday-and-love/This posting describes how a Perl module named Lingua::Concordance allows the developer to illustrate where in the continum of a text words or phrases appear and how often.
When it comes to Western literature and windmills, we often think of Don Quiote. When it comes to “my man Friday” we think of Robinson Crusoe. And when it comes to love we may very well think of Romeo and Juliet. But I ask myself, “How often do these words and phrases appear in the texts, and where?” Using digital humanities computing techniques I can literally illustrate the answers to these questions.
Lingua::Concordance is a Perl module (available locally and via CPAN) implementing a simple key word in context (KWIC) index. Given a text and a query as input, a concordance will return a list of all the snippets containing the query along with a few words on either side. Such a tool enables a person to see how their query is used in a literary work.
Given the fact that a literary work can be measured in words, and given then fact that the number of times a particular word or phrase can be counted in a text, it is possible to illustrate the locations of the words and phrases using a bar chart. One axis represents a percentage of the text, and the other axis represents the number of times the words or phrases occur in that percentage. Such graphing techniques are increasingly called visualization — a new spin on the old adage “A picture is worth a thousand words.”
In a script named concordance.pl I answered such questions. Specifically, I used it to figure out where in Don Quiote windmills are mentiond. As you can see below they are mentioned only 14 times in the entire novel, and the vast majority of the time they exist in the first 10% of the book.
  $ ./concordance.pl ./don.txt 'windmill'
  Snippets from ./don.txt containing windmill:
	* DREAMT-OF ADVENTURE OF THE WINDMILLS, WITH OTHER OCCURRENCES WORTHY TO
	* d over by the sails of the windmill, Sancho tossed in the blanket, the
	* thing is ignoble; the very windmills are the ugliest and shabbiest of
	* liest and shabbiest of the windmill kind. To anyone who knew the count
	* ers say it was that of the windmills; but what I have ascertained on t
	* DREAMT-OF ADVENTURE OF THE WINDMILLS, WITH OTHER OCCURRENCES WORTHY TO
	* e in sight of thirty forty windmills that there are on plain, and as s
	* e there are not giants but windmills, and what seem to be their arms a
	* t most certainly they were windmills and not giants he was going to at
	*  about, for they were only windmills? and no one could have made any m
	* his will be worse than the windmills," said Sancho. "Look, senor; thos
	* ar by the adventure of the windmills that your worship took to be Bria
	*  was seen when he said the windmills were giants, and the monks' mules
	*  with which the one of the windmills, and the awful one of the fulling

  A graph illustrating in what percentage of ./don.txt windmill is located:
	 10 (11) #############################
	 20 ( 0)
	 30 ( 0)
	 40 ( 0)
	 50 ( 0)
	 60 ( 2) #####
	 70 ( 1) ##
	 80 ( 0)
	 90 ( 0)
	100 ( 0)
If windmills are mentioned so few times, then why do they play so prominently in people’s minds when they think of Don Quiote? To what degree have people read Don Quiote in its entirity? Are windmills as persistent a theme throughout the book as many people may think?
What about “my man Friday”? Where does he occur in Robinson Crusoe? Using the concordance features of the Alex Catalogue of Electronic Texts we can see that a search for the word Friday returns 185 snippets. Mapping those snippets to percentages of the text results in the following bar chart:

Friday in Robinson Crusoe
Obviously the word Friday appears towards the end of the novel, and as anybody who has read the novel knows, it is a long time until Robinson Crusoe actually gets stranded on the island and meets “my man Friday”. A concordance helps people understand this fact.
What about love in Romeo and Juliet? How often does the word occur and where? Again, a search for the word love returns quite a number of snippets (175 to be exact), and they are distributed throughout the text as illustrated below:

love in Romeo and Juliet
“Maybe love is a constant theme of this particular play,” I state sarcastically, and “Is there less love later in the play?”
Given the current environment, where full text literature abounds, digital humanities and librarianship are a match made in heaven. Our library “discovery systems” are essencially indexes. They enable people to find data and information in our collections. Yet find is not an end in itself. In fact, it is only an activity at the very beginning of the learning process. Once content is found it is then read in an attempt at understanding. Counting words and phrases, placing them in the context of an entire work or corpus, and illustrating the result is one way this understanding can be accomplished more quickly. Remember, “Save the time of the reader.”
Integrating digital humanities computing techniques, like concordances, into library “discovery systems” represent a growth opportunity for the library profession. If we don’t do this on our own, then somebody else will, and we will end up paying money for the service. Climb the learning curve now, or pay exorbitant fees later. The choice is ours.
2010-09-12T22:32:19+00:00 Water collection: River Teith at Doune Castle (Scotland) http://infomotions.com/water/index.xml?cmd=getwater&id=106 Map it |
This has got to be one the waters I have owned the least amount of time.
I went to a digital library conference (ECDL 2010) and met up with James McNulty who previously came to visit me at Notre Dame. While at the conference I convinced him to do a bit of sight seeing with me. We went to Stirling Castle and Doune Castle. While at the later I went over the (very) steep bank to collect my water. When I came back up less than ten minutes later I had lost the bottle. I went back down, could not find the bottle, and returned a second time. James thought I was a bit loony.
Doune Castle was the most original of the castles I saw in and around Glasgow. I wish I could have stayed longer.
2010-09-09T04:00:00+00:00 Water collection: River Clyde at Bothwell Castle (Scotland) http://infomotions.com/water/index.xml?cmd=getwater&id=105 Map it |
I attended a digital library confernece (ECDL 2010), and after carefully looking at the conference schedule as well as the train schedule, I figured I could duck out of the meeting, go to Bothwell Castle, and return to the conference in time for the next set of presentations. My timing was perfect. "Subway" to train station. Train to town. Walk a mile to the castle. Play tourist. Return. The weather was glorious. The castle was authentic. Locals -- including a few school boys -- were enjoying the monument. I took some time to scetch the castle in my notebook. I purchased a Robert the Bruce wine bottle holder. Even I think it is cute. I like castles!
2010-09-08T04:00:00+00:00 Mini-musings: Ngrams, concordances, and librarianship http://infomotions.com/blog/2010/08/ngrams-concordances-and-librarianship/This posting describes how the extraction of ngrams and the implementation of concordances are integrated into the Alex Catalogue of Electronic Texts. Given the increasing availability of full-text content in libraries, the techniques described here could easily be incorporated into traditional library “discovery systems” and/or catalogs, if and only if the library profession were to shift its definition of what it means to practice librarianship.
During the past couple of weeks, in fits of creativity, one of the things I spent some of my time on was a Perl module named Lingua::EN::Bigram. At version 0.03, it now supports not only bigrams, trigrams, and quadgrams (two-, three-, and four-word phrases, respectively), but also ngrams — multi-word phrases of an arbitrary length.
Given this enhanced functionality, and through the use of a script called ngrams.pl, I learned that the 10 most frequently used 5-word phrases and the number of times they occur in Henry David Thoreau’s Walden seem to surround spacial references:
Whereas the same process applied to Thoreau’s A Week on the Concord and Merrimack Rivers returns lengths and references to flowing water, mostly:
While not always as clear cut as the examples outlined above, the extraction and counting of ngrams usually supports the process of “distant reading” — a phrase coined by Franco Moretti in Graphs, Maps, Trees: Abstract Models for Literary History (2007) to denote the counting, graphing, and mapping of literary texts. With so much emphasis on reading in libraries, I ask myself, “Ought the extraction of ngrams be applied to library applications?”
Concordances are literary tools used to evaluate texts. Dating back to as early as the 12th or 13th centuries, they were first used to study religious materials. Concordances take many forms, but they usually list all the words in a text, the number of times each occurs, and most importantly, places where each word within the context of its surrounding text — a key-word in context (KWIC) index. Done by hand, the creation of concordances is tedious and time consuming, and therefore very expensive. Computers make the work of creating a concordance almost trivial.
Each of the full text items in the Alex Catalogue of Electronic Texts (close to 14,000 of them) is accompanied with a concordance. They support the following functions:
Such functionality allows people to answer many questions quickly and easily, such as:
The counting of words, the enumeration of ngrams, and the use of concordances are not intended to short-circuit traditional literary studies. Instead, they are intended to supplement and enhance the process. Traditional literary investigations, while deep and nuanced, are not scalable. A person is not able to read, compare & contrast, and then comprehend the essence of all of Shakespeare, all of Plato, and all of Charles Dickens through “close reading”. An individual simply does not have enough time. In the words of Gregory Crane, “What do you do with a million books?” Distant reading, akin to the proceses outlined above, make it easier to compare & contrast large corpora, discover patterns, and illustrate trends. Moreover, such processes are reproducible, less prone to subjective interpretation, and not limited to any particular domain. The counting, graphing, and mapping of literary texts makes a lot of sense.
The home page for the concordances is complete with a number of sample texts. Alternatively, you can search the Alex Catalogue and find an item on your own.
The amount of full text content available to libraries has never been greater than it is today. Millions of books have been collectively digitized through Project Gutenberg, the Open Content Alliance, and the Google Books Project. There are thousands of open access journals with thousands upon thousands of freely available scholarly articles. There are an ever-growing number of institutional repositories both subject-based as well as institutional-based. These too are rich with full text content. None of this even considers the myriad of grey literature sites like blogs and mailing list archives.
Library “discovery systems” and/or catalogs are designed to organize and provide access to the materials outlined above, but they need to do more. First of all, the majority of the profession’s acquisitions processes assume collections need to be paid for. With the increasing availability of truly free content on the Web, greater emphasis needs to be placed on harvesting content as opposed to purchasing or licensing it. Libraries are expected to build collections designed to stand the test of time. Brokering access to content through licensing agreements — one of the current trends in librarianship — will only last as long as the money lasts. Licensing content makes libraries look like cost centers and negates the definition of “collections”.
Second, library “discovery systems” and/or catalogs assume an environment of sacristy. They assume the amount of accessible, relevant data and information needed by students, teachers, and researchers is relatively small. Thus, a great deal of the profession’s efforts go into enabling people to find their particular needle in one particular haystack. In reality, current indexing technology makes the process of finding relavent materials trivial, almost intelligent. Implemented correctly, indexers return more content than most people need, and consequently they continue to drink from the proverbial fire hose.
Let’s turn these lemons into lemonade. Let’s redirect some of the time and money spent on purchasing licenses towards the creation of full text collections by systematic harvesting. Let’s figure out how to apply “distant reading” techniques to the resulting collections thus making them, literally, more useful and more understandable. These redirections represent a subtle change in the current direction of librarianship. At the same time, they retain the core principles of the profession, namely: collection, organization, preservation, and dissemination. The result of such a shift will result in an increased expertise on our part, the ability to better control our own destiny, and contribute to the overall advancement of our profession.
What can we do to make these things come to fruition?
2010-08-30T05:08:47+00:00 Mini-musings: Lingua::EN::Bigram (version 0.03) http://infomotions.com/blog/2010/08/linguaenbigram-version-0-03/I uploaded version 0.03 of Lingua::EN::Bigram to CPAN today, and it now supports not just bigrams, trigrams, quadgrams, but ngrams — an arbitrary phrase length.
In order to test it out, I quickly gathered together some of my more recent essays, concatonated them together, and applied Lingua::EN::Bigram against the result. Below is a list of the top 10 most common bigrams, trigrams, and quadgrams:
  bigrams                 trigrams                  quadgrams
  52  great ideas         36  the number of         25  the number of times
  43  open source         36  open source software  13  the total number of
  38  source software     32  as well as            10  at the same time
  29  great books         28  number of times       10  number of words in
  24  digital humanities  27  the use of            10  when it comes to
  23  good man            25  the great books       10  total number of documents
  22  full text           23  a set of              10  open source software is
  22  search results      20  eric lease morgan      9  number of times a
  20  lease morgan        20  a number of            9  as well as the
  20  eric lease          19  total number of        9  through the use of
Not surprising since I have been writing about the Great Books, digital humanities, indexing, and open source software. Re-affirming.
Lingu::EN::Bigram is available locally as well as from CPAN.
2010-08-24T02:37:39+00:00 Mini-musings: Lingua::EN::Bigram (version 0.02) http://infomotions.com/blog/2010/08/linguaenbigram-version-0-02/I have written and uploaded to CPAN version 0.02 of my Perl module Lingua::EN::Bigram. From the README file:
This module is designed to: 1) pull out all of the two-, three-, and four-word phrases in a given text, and 2) list these phrases according to their frequency. Using this module is it possible to create lists of the most common phrases in a text as well as order them by their probable occurrence, thus implying significance. This process is useful for the purposes of textual analysis and “distant reading”.
Using this module I wrote a script called n-grams.pl. Feed it a plain text file, and it will return the top 10 most significant bigrams (as calculated by T-Score) as well as the top 10 most common trigrams and quadgrams. For example, here is the output of n-grams.pl when Henry David Thoreau’s Walden is input:
  Bi-grams (T-Score, count, bigram)
  4.54348783312048  22  one day
  4.35133234596553  19  new england
  3.705427371426    14  walden pond
  3.66575742655033  14  one another
  3.57857056272537  13  many years
  3.55592136768501  13  every day
  3.46339791276118  12  fair haven
  3.46101939872834  12  years ago
  3.38519781332654  12  every man
  3.29818626191729  11  let us

  Tri-grams (count, trigram)
  41  in the woods
  40  i did not
  28  i do not
  28  of the pond
  27  as well as
  27  it is a
  26  part of the
  25  that it was
  25  as if it
  25  out of the

  Quad-grams (count, quadgram)
  20  for the most part
  16  from time to time
  15  as if it were
  14  in the midst of
  11  at the same time
   9  the surface of the
   9  i think that i
   8  in the middle of
   8  worth the while to
   7  as if they were
The whole thing gets more interesting when you compare that output to another of Thoreau’s works — A Week on the Concord and Merrimack Rivers:
  Bi-grams (T-Score, count, bi-gram)
  4.62683939320543  22  one another
  4.57637831535376  21  new england
  4.08356124174142  17  let us
  3.86858364314677  15  new hampshire
  3.43311180449584  12  one hundred
  3.31196701774012  11  common sense
  3.25007069543896  11  can never
  3.15955504269006  10  years ago
  3.14821552996352  10  human life
  3.13793008615654  10  told us

  Tri-grams (count, tri-gram)
  41  as well as
  38  of the river
  34  it is a
  30  there is a
  30  one of the
  28  it is the
  27  as if it
  26  it is not
  26  if it were
  24  it was a

  Quad-grams (count, quad-gram)
  21  for the most part
  20  as if it were
  17  from time to time
   9  on the bank of
   8  the bank of the
   8  in the midst of
   8  a quarter of a
   8  the middle of the
   8  quarter of a mile
   7  at the same time
Ask yourself, “Are their similarities between the outputs? How about differences? Do you notice any patterns or anomalies? What sorts of new discoveries might be made if n-grams.pl where applied to the entire corpus of Thoreau’s works? How might the output be different if a second author’s works were introduced?” Such questions are the core of digital humanities research. With the increasing availability of full text content in library collections, such are the questions the library profession can help answer if the profession were to expand it’s definition of “service”.
Search and retrieve are not the pressing problems to solved. People can find more data and information than they know what to do with. Instead, the pressing problems surround use and understanding. Lingua::EN::Bigram is an example of how these newer and more pressing problems can be addressed. The module is available for downloading (locally as well as from CPAN). Also for your perusal is n-grams.pl.
2010-08-23T00:02:45+00:00 Mini-musings: Cool URIs http://infomotions.com/blog/2010/08/cool-uris/I have started implementing “cool” URIs against the Alex Catalogue of Electronic Texts.
As outlined in Cool URIs for the Semantic Web, “The best resource identifiers… are designed with simplicity, stability and manageability in mind…” To that end I have taken to creating generic URIs redirecting user-agents to URLs based on content negotiation — 303 URI forwarding. These URIs also provide a means to request specific types of pages. The shapes of these URIs follow, where “key” is a foreign key in my underlying (MyLibrary) database:
For example, the following URIs return different versions/interfaces of Henry David Thoreau’s Walden:
This whole thing makes my life easier. No need to remember complicated URLs. All I have to remember is the shape of my URI and the foreign key. Through the process this also makes the URLs easier to type, shorten, distribute, and display.
The downside of this implementation is the need for an always-on intermediary application doing the actual work. The application, implemented as mod_perl module, is called Apache2::Alex::Dereference and available for your perusal. Another downside is the need for better, more robust RDF, but that’s for later.
2010-08-22T18:07:42+00:00 Life of a Librarian: Hello world! http://sites.nd.edu/emorgan/2010/08/hello-world/Welcome to Notre Dame Blogs. This is your first post. Edit or delete it, then start blogging!
2010-08-19T17:15:54+00:00 Mini-musings: rsync, a really cool utility http://infomotions.com/blog/2010/08/rsync-a-really-cool-utility/Without direct physical access to my co-located host, backing up and preserving the Infomotions’ 150 GB of website is challenging, but through the use of rsync things are a whole lot easier. rsync is a really cool utility, and thanks go to Francis Kayiwa who recommended it to me in the first place. “Thank you!”
Here is my rather brain-dead back-up utility:
# rsync.sh - brain-dead backup of wilson

# change directories to the local store
cd /Users/eric/wilson

# get rid of any weird Mac OS X filenames
find ./ -name '.DS_Store' -exec rm -rf {} \;

# do the work for one remote file system...
rsync --exclude-from=/Users/eric/etc/rsync-exclude.txt \
    -avz wilson:/disk01/ \
    ./disk01/

# ...and then another
rsync --exclude-from=/Users/eric/etc/rsync-exclude.txt \
    -avz wilson:/home/eric/ \
    ./home/eric/
After I run this code my local Apple Macintosh Time Capsule automatically copies my content to yet a third spinning disk. I feel much better about my data now that I have started using rsync.
2010-08-19T01:42:18+00:00 Readings: Social Side of Science Data Sharing: Distilling Past Efforts http://www.ukoln.ac.uk/events/pv-2005/pv-2005-final-poster-papers/040-poster-1.pdf "Our purpose is to review the suitability and generality of data curation practices and principles developed in the social, political and economic sciences for use in the life and physical sciences." I had the recent honor, privilege, and pleasure of attending WiLSWorld (July 21-22, 2010 in Madison, Wisconsin), and this posting outlines my experiences there. In a sentence, I was pleased so see the increasing understanding of “discovery” interfaces defined as indexes as opposed to databases, and it is now my hope we — as a profession — can move beyond search & find towards use & understand.
With an audience of about 150 librarians of all types from across Wisconsin, the conference began with a keynote speech by Tim Spalding (LibraryThing) entitled “Social cataloging and the future”. The heart of his presentation was a thing he called the Ladder of Social Cataloging which has six “rungs”: 1) personal cataloging, 2) sharing, 3) implicit social cataloging, 4) social networking, 5) explicitly social cataloging, and 6) collaboration. Much of what followed were demonstrations of how each of these things are manifested in LibraryThing. There were a number meaty quotes sprinkled throughout the talk:
…We [LibraryThing] are probably not the biggest book club anymore… Reviews are less about buying books and more about sharing minds… Tagging is not about something for everybody else, but rather about something for yourself… LibraryThing was about my attempt to discuss the things I wanted to discuss in graduate school… We have “flash mobs” cataloging peoples’ books such as the collections of Thomas Jefferson, John Adams, Ernest Hemingway, etc… Traditional subject headings are not manifested in degrees; all LCSH are equally valid… Library data can be combined but separate from patron data.
I was duly impressed with this presentation. It really brought home the power of crowd sourcing and how it can be harnessed in a library setting. Very nice.
Peter Gilbert (Lawrence University) then gave a presentation called “Resource discovery: I know it when I see it”. In his words, “The current problem to solve is to remove all of the solos: books, articles, digitized content, guides to subjects, etc.” The solution, in his opinion, is to implement “discovery systems” similar to Blacklight, eXtensible Catalog, Primo & Primo Central, Summon, VUFind, etc. I couldn’t have said it better myself. He gave a brief overview of each system.
Ken Varnum (University of Michigan Library) described a website redesign process in “Opening what’s closed: Using open source tools to tear down vendor silos”. As he said, “The problem we tried to solve in our website redesign was the overwhelming number of branch library websites. All different. Almost schizophrenic.” The solution grew out of a different premise for websites. “Information not location.” He went on to describe a rather typical redesign process complete with focus group interviews, usability studies, and advisory groups, but there were a couple of very interesting tidbits. First, inserting the names and faces of librarian in search results has proved popular with students. Second, I admired the “participatory design” process he employed. Print a design. Allow patrons to use pencils to add, remove, or comment on aspects of the layout. I also think the addition of a professional graphic designer helped their process.
I then attended Peter Gorman‘s (University of Wisconsin-Madison) “Migration of digital content to Fedora”. Gorman had the desire to amalgamate institutional content, books, multimedia and finding aids (EAD files) into a single application… yet another “discovery system” description. His solution was to store content into Fedora, index the content, and provide services against the index. Again, a presenter after my own heart. Better than anyone had done previously, Gorman described Fedora’s content model complete with identifiers (keys), a sets of properties (relationships, audit trails, etc.), and a data streams (JPEG, XML, TIFF, etc.). His description was clear and very easy to digest. The highlight was a description of Fedora “behaviors”. These are things people are intended to do with data streams. Examples include enlarging a thumbnail image or transforming a online finding aid into something designed for printing. These “behaviors” are very much akin — if not exactly like — the “services against texts” I have been advocating for a few years.
The next day I gave a presentation called “Electronic texts and the evolving definition of librarianship”. This was an extended version of my presentation at ALA given a few weeks ago. To paraphrase, “As we move from databases towards indexes to facilitate search, the problems surrounding find are not as acute. Given the increasing availability of digitized full text content, library systems have the opportunity to employ ‘digital humanities computing techniques’ against collections and enable people to do ‘distant reading’.” I then demonstrated how the simple counting of words and phrases, the use of concordances, and the application of TFIDF can facilitate rudimentary comparing & contrasting of corpora. Giving this presentation was an enjoyable experience because it provided me the chance to verbalize and demonstrate much of my current “great books” research.
Later in the morning helped facilitate a discussion on the process a library could go through to implement the ideas outlined in my presentation, but the vast majority of people attended the presentation by Keith Mountin (Apple Computer, Inc.) called “The iPad and its application in libraries”.
Madison was just as nice as I remember. Youthful. Liberal. Progressive. Thanks go to Deb Shapiro and Mark Beatty. They invited me to sit with them on the capitol lawn and listen to the local orchestra play Beatles music. The whole thing was very refreshing.
The trip back from the conference was a hellacious experience in air travel, but it did give me the chance to have an extended chat with Tim Spalding in the airport. We discussed statistics and statistical measures that can be applied to content we are generating. Many of the things he is doing with metadata I may be able to do with full text. The converse is true as well. Moreover, by combining our datasets we may find that the sum is greater than the parts — all puns intended. Both Tim and I agreed this is something we should both work towards. Afterwards I ate macaroni & cheese with a soft pretzel and a beer. It seemed apropos for Wisconsin.
This was my second or third time attending WiLSWorld. Like the previous meetings, the good folks at WiLS — specifically Tom Zilner, Mark Beatty, and Shirley Schenning — put together a conference providing librarians from across Wisconsin with a set of relatively inexpensive professional development opportunities. Timely presentations. Plenty of time for informal discussions. All in a setting conducive to getting away and thinking a bit outside the box. “Thank you.”
2010-08-06T17:04:39+00:00 Mini-musings: Digital Humanities 2010: A Travelogue http://infomotions.com/blog/2010/07/digital-humanities-2010-a-travelogue/I was fortunate enough to be able to attend a conference called Digital Humanities 2010 (London, England) between July 4th and 10th. This posting documents my experiences and take-aways. In a sentence, the conference provided a set of much needed intellectual stimulation and challenges as well as validated the soundness of my current research surrounding the Great Books.


All day Monday, July 5, I participated in a workshop called Text mining in the digital humanities facilitated by Marco Büchler, et al. of the University of Leipzig. A definition of “e-humanities” was given, “The application of computer science to do qualitative evaluation of texts without the use of things like TEI.” I learned that graphing texts illustrates concepts quickly — “A picture is worth a thousand words.” Also, I learned I should consider creating co-occurrence graphs — pictures illustrating what words co-occur with a given word. Finally, according to the Law of Least Effort, the strongest content words in a text are usually the ones that do not occur most frequently, nor the ones occurring the least, but rather the words occurring somewhere in between. A useful quote includes, “Text mining allows one to search even without knowing any search terms.” Much of this workshop’s content came from the eAQUA Project.
On Tuesday I attended the first half of a THATCamp led by Dan Cohen (George Mason University) where I learned THATCamps are expected to be: 1) fun, 2) productive, and 3) collegial. The whole thing came off as a “bar camp” for scholarly conferences. As a part of the ‘Camp I elected to participate in the Developer’s Challenge and submitted an entry called “How ‘great’ is this article?“. My hack compared texts from the English Women’s Journal to the Great Books Coefficient in order to determine “greatness”. My entry did not win. Instead the prize went to Patrick Juola with honorable mentions going to Loretta Auvil, Marco Büchler, and Thomas Eckart.
Wednesday morning I learned more about text mining in a workshop called Introduction to text analysis using JiTR and Voyeur led by Stéfan Sinclair (McMaster University) and Geoffrey Rockwell (University of Alberta). The purpose of the workshop was “to learn how to integrate text analysis into a scholar’s/researcher’s workflow.” More specifically, we learned how to use a tool called Voyeur, an evolution of the TAPoR. The “kewlest” thing I learned was the definition of word density, (U / W) 1000, where U is the total number of unique words in a text and W is the total number of words in a text. The closer the result is to 1000 the richer and more dense a text is. In general, denser documents are more difficult to read. (For a good time, I wrote density.pl — a program to compute density given an arbitrary plain text file.)
In keeping with the broad definition of humanities, I was “seduced” in the afternoon by listening to recordings of a website called CHARM (Center for History and Analysis of Recorded Music). The presentation described and presented digitized classical music from the very beginnings of recorded music. All apropos since the BBC was located just across the street from King’s College where the conference took place. When this was over we retired to the deck for tea and cake. There I learned the significant recording time differences between 10″ and 12″ 78/rpm records. Like many mediums, the recording artist needed to make accommodations accordingly.


The conference officially began Wednesday evening and ended Saturday afternoon. According to my notes, I attended at many as eighteen sessions. (Wow!?) Listed below are summaries of most of the ones I attended:


In the spirit of British fast food, I have a number of take-aways. First and foremost, I learned that my current digital humanities research into the Great Books is right on target. It asks questions of the human condition and tries to answer them through the use of computing techniques. This alone was the worth the total cost of my attendance.
Second, as a relative outsider to the community, I percieved a pervasive us versus them mentality being described. Us digital humanists and those traditional humanists. Us digital humanists and those computer programmers and systems administrators. Us digital humanists and those librarians and archivists. Us digital humanists and those academic bureaucrats. If you consider yourself a digital humanist, then please don’t take this observation the wrong way. I believe communities inherently do this as a matter of fact. It is a process used to define one’s self. The heart of much of this particular differenciation seems to be yet another example of C.P. Snow‘s The Two Cultures. As a humanist myself, I identify with the perception. I think the processes of art and science complement each other, not contradict nor conflict. A balance of both are needed in order to adequantly create a cosmos out of the apparent chaos of our existance — a concept I call arscience.
Third, I had ample opportunities to enjoy myself as a tourist. The day I arrived I played frisbee disc golf with a few “cool dudes” at Lloyd Park in Croydon. On the Monday I went to the National Theater and saw Welcome to Thebes — a depressing tragedy where everybody dies. On the Tuesday I took in Windsor Castle. Another day I carried my Culver Citizen newspaper to have its photograph taken in front of Big Ben. Throughout my time there I experienced interesting food, a myriad of languages & cultures, and the almost overwhelming size of London. Embarassingly, I had forgotten how large the city really is.
Finally, I actually enjoyed reading the formally published conference abstracts — all three pounds and 400 pages of it. It was thorough, complete, and even included an author index. More importantly, I discovered more than a few quotes supporting an idea for library systems that I have been calling “services against texts”:
The challenge is to provide the researcher with a means to perceiving or specifying subsets of data, extracting the relevent information, building the nodes and edges, and then providing the means to navigate the vast number of nodes and edges. (Susan Brown in “How do you visualize a million links” on page 106)
However, current DL [digital library] systems lack critical features: they have too simple a model of documents, and lack scholarly apparatus. (George Buchanan in “Digital libraries of scholarly editions” on page 108.)
This approach takes us to the what F. Moretti (2005) has termed ‘distant reading,’ a method that stresses summarizing large bodies of text rather than focusing on a few texts in detail. (Ian Gregory in “GIS, texts and images: New approaches to landscape appreciation in the Lake District” on page 159).
And the best quote is:
In smart digital libraries, a text should not only be an object but a service: not a static entity but an interactive method. The text should be computationally exploitable so that it can be sampled and used, not simply reproduced in its entirety… the reformulation of the dictionary not as an object, but a service. (Toma Tasovac in “Reimaging the dictionary, or why lexicography needs digital humanities” on page 254)
In conclusion, I feel blessed with the ability to attended the conference. I learned a lot, and I will recommend it to any librarian or humanist.
2010-07-25T16:52:10+00:00 Readings: Digital Repository Strategic Information Gathering Project http://wiki.nd.edu/x/YZFjAQ Describes how the Libraries Repository Working Group proposes to get student and faculty input regarding its repository application/system.During Digital Humanities 2010 I participated in the THATCamp London Developers’ Challenge and tried to answer the question, “How ‘great’ is this article?” This posting outlines the functionality of my submission, links to a screen capture demonstrating it, and provides access to the source code.
 Given any text file — say an article from the English Women’s Journal — my submission tries to answer the question, “How ‘great’ is this article?” It does this by:
Functions #1, #2, #3, and #5 are relatively straight-forward and well-understood. Function #4 needs some explanation.
In the 1960’s a set of books was published called the Great Books. The set is based on a set of 102 “great ideas” (such as art, love, honor, truth, justice, wisdom, science, etc.). By summing the TFIDF scores of each of these ideas for each of the books, a “great ideas coefficient” can be computed. Through this process we find that Shakespeare wrote seven of the top ten books when it comes to love. Kant wrote the “greatest book”. The American State’s Articles of Confederation ranks the highest when it come to war. This “coefficient” can then be used as a standard — an index — for comparing other documents. This is exactly what this program does. (See the screen capture for a demonstration.)
The program can be improved a number of ways:
Thanks to Gerhard Brey and the folks of the Nineteenth Century Serials Editions for providing the data. Very interesting.
2010-07-09T07:33:34+00:00 Water collection: River Thames at Windsor Castle http://infomotions.com/water/index.xml?cmd=getwater&id=103 Map it |
 This is the briefest of travelogues describing my experience at the 2010 ALA Annual Meeting in Washington (DC).
Pat Lawton and I gave a presentation at the White House Four Points Hotel on the “Catholic Portal“. Essentially it was a status report. We shared the podium with Jon Miller (University of Southern California) who described the International Mission Photography Archive — an extensive collection of photographs taken by missionaries from many denominations.
I then took the opportunity to visit my mother in Pennsylvania, but the significant point is the way I got out of town. I had lost my maps, and my iPad came to the rescue. The Google Maps application was very, very useful.
On Monday I shared a podium with John Blyberg (Darien Library) and Tim Spalding (LibraryThing) as a part of a Next-Generation Library Catalog Special Interest Group presentation. John provided an overview of the latest and greatest features of SOPAC. He emphasized a lot of user-centered design. Tim described library content and services as not (really) being a part of the Web. In many ways I agree with him. I outlined how a few digital humanities computing techniques could be incorporated into library collections and services in a presentation I called “The Next Next-Generation Library Catalog“. That afternoon I participated in a VUFind users-group meeting, and I learned that I am pretty much on target in regards to the features of this “discovery system”. Afterwards a number of us from the Catholic Research Resources Alliance (CRRA) listened to folks from Crivella West describe their vision of librarianship. The presentation was very interesting because they described how they have taken many collections of content and mined them for answers to questions. This is digital humanities to the extreme. Their software — the Knowledge Kiosk — is being used to analyze the content of John Henry Newman at the Newman Institute.
Tuesday morning was spent more with the CRRA. We ratified next year’s strategic plan. In the afternoon I visited a few of my friends at the Library of Congress (LOC). There I learned a bit how the LOC may be storing and archiving Twitter feeds. Interesting.
2010-06-30T19:42:05+00:00 Readings: Principles and Good Practice for Preserving Data http://ihsn.org/home/download.php?file=IHSN-WP003.pdf "This document provides basic guidance for managers in statistical agencies who are responsible for preserving data using the principles and good practice defined by the digital preservation community. The guidance in this paper defines the rationale for preserving data and the principles and standards of good practice as applied to data preservation, documents the development of a digital preservation policy and uses digital archive audit principles to suggest good practice for data."I “own” a mailing list called NCG4Lib. It’s purpose is to provide a forum for the discussion of all things “next generation library catalog”. As of this writing, there are about 2,000 subscribers.
Lately I have been asking myself, “What sorts of things get discussed on the list and who participates in the discussion?” I thought I’d try to answer this question with a bit of text mining. This analysis only covers the current year to date, 2010.
Even though there are as many as 2,000 subscribers, only a tiny few actually post comments. The following pie and line charts illustrate the point without naming any names. As you can see, eleven (11) people contribute 50% of the postings.

11 people post 50% of the messages
The lie chart illustrates the same point differently; a few people post a lot. We definitely have a long tail going on here.

They definitely represent a long tail
The most frequently used individual subject line words more or less reflect traditional library cataloging practices. MARC. MODS. Cataloging. OCLC. But also notice how the word “impasse” is included. This may reflect something about the list.

The subject words look “traditional”
I’m not quite sure what to make of the most commonly used subject word bigrams.

‘Don’t know what to make of these bigrams
The most frequently used individual words in the body of the postings tell a nice story. Library. Information. Data. HTTP. But notice what is not there — books. I also don’t see things like collections, acquisitions, public, services, nor value or evaluation. Hmm…
The most frequently used bigrams in the body of the messages tell an even more interesting story because the they are dominated by the names of people and things.
The phrases “information services” and “technical services” do not necessarily fit my description. Using a concordance to see how these words were being used, I discovered they were overwhelmingly a part of one or more persons’ email signatures or job descriptions. Not what I was hoping for. (Sigh.)
Based on these observations, as well as my personal experience, I believe the NGC4Lib mailing list needs more balance. It needs more balance in a couple of ways:
As the owner of the list, what will I do? Frankly, I don’t know. Your thoughts and comments are welcome.
With the advent of the Internet and wide-scale availability of full-text content, people are overwhelmed with the amount of accessible data and information. Library catalogs can only go so far when it comes to delimiting what is relevant and what is not. Even when the most exact searches return 100’s of hits what is a person to do? Services against texts — digital humanities computing techniques — represent a possible answer. Whether the content is represented by novels, works of literature, or scholarly journal articles the methods of the digital humanities can provide ways to compare & contrast, analyze, and make more useful any type of content. This essay elaborates on these ideas and describes how they can be integrated into the “next, next-generation library catalog”.
(Because this essay is the foundation for a presentation at the 2010 ALA Annual Meeting, this presentation is also available as a one-page handout designed for printing as well as bloated set of slides.)
Find is not the problem to be solved. At most, find is a means to an end and not the end itself. Instead, the problem to solve surrounds use. The profession needs to implement automated ways to make it easier users do things against content.
The library profession spends an inordinate amount of time and effort creating catalogs — essentially inventory lists of things a library owns (or licenses). The profession then puts a layer on top of this inventory list — complete with authority lists, controlled vocabularies, and ever-cryptic administrative data — to facilitate discovery. When poorly implemented, this discovery layer is seen by the library user as an impediment to their real goal. Read a book or article. Verify a fact. Learn a procedure. Compare & contrast one idea with another idea. Etc.
In just the past few years the library profession has learned that indexers (as opposed to databases) are the tools to facilitate find. This is true for two reasons. First, indexers reduce the need for users to know how the underlying data is structured. Second, indexers employ statistical analysis to rank it’s output by relevance. Databases are great for creating and maintaining content. Indexers are great for search. Both are needed in equal measures in order to implement the sort of information retrieval systems people have come to expect. For example, many of the profession’s current crop of “discovery” systems (VUFind, Blacklight, Summon, Primo, etc.) all use an open source indexer called Lucene to drive search.
This being the case, we can more or less call the problem of find solved. True, software is never done, and things can always be improved, but improvements in the realm of search will only be incremental.
Instead of focusing on find, the profession needs to focus on the next steps in the process. After a person does a search and gets back a list of results, what do they want to do? First, they will want to peruse the items in the list. After identifying items of interest, they will want to acquire them. Once the selected items are in hand users may want to print, but at the very least they will want to read. During the course of this reading the user may be doing any number of things. Ranking. Reviewing. Annotating. Summarizing. Evaluating. Looking for a specific fact. Extracting the essence of the author’s message. Comparing & contrasting the text to other texts. Looking for sets of themes. Tracing ideas both inside and outside the texts. In other words, find and acquire are just a means to greater ends. Find and acquire are library goals, not the goals of users.
People want to perform actions against the content they acquire. They want to use the content. They want to do stuff with it. By expanding our definition of “information literacy” to include things beyond metadata and bibliography, and by combining it with the power of computers, librarianship can further “save the time of the reader” and thus remain relevant in the current information environment. Focusing on the use and evaluation of information represents a growth opportunity for librarianship.
The availability of full text content in the form of plain text files combined with the power of computing empowers one to do statistical analysis against corpora. Put another way, computers are great at counting words, and once sets of words are counted there are many things one can do with the results, such as but not limited to:
For example, suppose you did the perfect search and identified all of the works of Plato, Aristotle, and Shakespeare. Then, if you had the full text, you could compute a simple table such as Table 1.
| Author | Works | Words | Average | Grade | Flesch |
| Plato | 25 | 1,162,46 | 46,499 | 12-15 | 54 |
| Aristotle | 19 | 950,078 | 50,004 | 13-17 | 50 |
| Shakespeare | 36 | 856,594 | 23,794 | 7-10 | 72 |
The table lists who wrote how many works. It lists the number of words in each set of works and the average number of words per work. Finally, based on things like sentence length, it estimates grade and reading levels for the works. Given such information, a library “catalog” could help the patron could answer questions such as:
Given the full text, a trivial program can then be written to count the number of words existing in a corpus as well as the number of times each word occurs, as shown in Table 2.
| Plato | Aristotle | Shakespeare |
| will | one | thou |
| one | will | will |
| socrates | must | thy |
| may | also | shall |
| good | things | lord |
| said | man | thee |
| man | may | sir |
| say | animals | king |
| true | thing | good |
| shall | two | now |
| like | time | come |
| can | can | well |
| must | another | enter |
| another | part | love |
| men | first | let |
| now | either | hath |
| also | like | man |
| things | good | like |
| first | case | one |
| let | nature | upon |
| nature | motion | know |
| many | since | say |
| state | others | make |
| knowledge | now | may |
| two | way | yet |
Table 2, sans a set of stop words, lists the most frequently used words in the complete works of Plato, Aristotle, and Shakespeare. The patron can then ask and answer questions like:
Notice how the words “one”, “good” and “man” appear in all three columns. Does that represent some sort of shared quality between the works?
If one word contains some meaning, then do two words contain twice as much meaning? Here is a list of the most common two-word phrases (bigrams) in each author corpus, Table 3.
| Plato | Aristotle | Shakespeare |
| let us | one another | king henry |
| one another | something else | thou art |
| young socrates | let uses | thou hast |
| just now | takes place | king richard |
| first place | one thing | mark antony |
| every one | without qualification | prince henry |
| like manner | middle term | let us |
| every man | first figure | king lear |
| quite true | b belongs | thou shalt |
| two kinds | take place | duke vincentio |
| human life | essential nature | dost thou |
| one thing | every one | sir toby |
| will make | practical wisdom | art thou |
| human nature | will belong | henry v |
| human mind | general rule | richard iii |
| quite right | anything else | toby belch |
| modern times | one might | scene ii |
| young men | first principle | act iv |
| can hardly | good man | iv scene |
| will never | two things | exeunt king |
| will tell | two kinds | don pedro |
| dare say | first place | mistress quickly |
| will say | like manner | act iii |
| false opinion | one kind | thou dost |
| one else | scientific knowledge | sir john |
Notice how the names of people appear frequently in Shakespeare’s works, but very few names appear in the lists of Plato and Aristotle. Notice how the word “thou” appears a lot in Shakespeare’s works. Ask yourself the meaning of the word “thou”, and decide whether or not to update the stop word list. Notice how the common phrases of Plato and Aristotle are akin to ideas, not tangible things. Examples include: human nature, practical wisdom, first principle, false opinion, etc. Is there a pattern here?
If “a picture is worth a thousand words”, then there are about six thousand words represented by Figures 1 through 6.
Words used by Plato |
Phrases used by Plato |
Words used by Aristotle |
Phrases used by Aristotle |
Words used by Shakespeare |
Phrases used by Shakespeare |
Word clouds — “tag clouds” — are an increasingly popular way to illustrate the frequency of words or phrases in a corpus. Because a few of the phrases in a couple of the corpuses were considered outliers, phrases such as “let us”, “one another”, and “something else” are not depicted.
Even without the use of statistics, it appears the use of the phrase “good man” by each author might be interestingly compared & contrasted. A concordance is an excellent tool for such a purpose, and below are a few of the more meaty uses of “good man” by each author.
| List 1 – “good man” as used by Plato |
ngth or mere cleverness. To the good man, education is of all things the most pr Nothing evil can happen to the good man either in life or death, and his own de but one reply: 'The rule of one good man is better than the rule of all the rest SOCRATES: A just and pious and good man is the friend of the gods; is he not? P ry wise man who happens to be a good man is more than human (daimonion) both in |
| List 2 – “good man” as used by Aristotle |
ons that shame is felt, and the good man will never voluntarily do bad actions. reatest of goods. Therefore the good man should be a lover of self (for he will hat is best for itself, and the good man obeys his reason. It is true of the goo theme If, as I said before, the good man has a right to rule because he is bette d prove that in some states the good man and the good citizen are the same, and |
| List 3 – “good man” as used by Shakespeare |
r to that. SHYLOCK Antonio is a good man. BASSANIO Have you heard any imputation p out, the rest I'll whistle. A good man's fortune may grow out at heels: Give y t it, Thou canst not hit it, my good man. BOYET An I cannot, cannot, cannot, An hy, look where he comes; and my good man too: he's as far from jealousy as I am mean, that married her, alack, good man! And therefore banish'd -- is a creatur |
What sorts of judgements might the patron be able to make based on the snippets listed above? Are Plato, Aristotle, and Shakespeare all defining the meaning of a “good man”? If so, then what are some of the definitions? Are there qualitative similarities and/or differences between the definitions?
Sometimes being as blunt as asking a direct question, like “What is a man?”, can be useful. Lists 4 through 6 try to answer it.
| List 4 – “man is” as used by Plato |
stice, he is met by the fact that man is a social being, and he tries to harmoni ption of Not-being to difference. Man is a rational animal, and is not -- as man ss them. Or, as others have said: Man is man because he has the gift of speech; wise man who happens to be a good man is more than human (daimonion) both in lif ied with the Protagorean saying, 'Man is the measure of all things;' and of this |
| List 5 – “man is” as used by Aristotle |
ronounced by the judgement 'every man is unjust', the same must needs hold good ts are formed from a residue that man is the most naked in body of all animals a ated piece at draughts. Now, that man is more of a political animal than bees or hese vices later. The magnificent man is like an artist; for he can see what is lement in the essential nature of man is knowledge; the apprehension of animal a |
| List 6 – “man is” as used by Shakespeare |
what I have said against it; for man is a giddy thing, and this is my conclusio of man to say what dream it was: man is but an ass, if he go about to expound t e a raven for a dove? The will of man is by his reason sway'd; And reason says y n you: let me ask you a question. Man is enemy to virginity; how may we barricad er, let us dine and never fret: A man is master of his liberty: Time is their ma |
In the 1950s Mortimer Adler and a set of colleagues created a set of works they called The Great Books of the Western World. This 80-volume set included all the works of Plato, Aristotle, and Shakespeare as well as some of the works of Augustine, Aquinas, Milton, Kepler, Galileo, Newton, Melville, Kant, James, and Frued. Prior to the set’s creation, Adler and colleagues enumerated 102 “greatest ideas” including concepts such as: angel, art, beauty, honor, justice, science, truth, wisdom, war, etc. Each book in the series was selected for inclusion by the committee because of the way the books elaborated on the meaning of the “great ideas”.
Given the full text of each of the Great Books as well as a set of keywords (the “great ideas”), it is relatively simple to calculate a relevancy ranking score for each item in a corpus. Love is one of the “great ideas”, and it just so happens it is used most significantly by Shakespeare compared to the use of the other authors in the set. If Shakespeare has the highest “love quotient”, then what does Shakespeare have to say about love? List 7 is a brute force answer to such a question.
| List 7 – “love is” as used by Shakespeare |
y attempted? Love is a familiar; Love is a devil: there is no evil angel but Lov er. VALENTINE Why? SPEED Because Love is blind. O, that you had mine eyes; or yo that. DUKE This very night; for Love is like a child, That longs for every thin n can express how much. ROSALIND Love is merely a madness, and, I tell you, dese of true minds Admit impediments. Love is not love Which alters when it alteratio |
Do these definitions coincide with expectations? Maybe further reading is necessary.
The previous section is just about the most gentle introduction to digital humanities computing possible, but can also be an introduction to a new breed of library science and library catalogs.
It began by assuming the existence of full text content in plain text form — an increasingly reasonable assumption. After denoting a subset of content, it compared & contrasted the sizes and reading levels of the content. By counting individual words and phrases, patterns were discovered in the texts and a particular idea was loosely followed — specifically, the definition of a good man. Finally, the works of a particular author were compared to the works of a larger whole to learn how the author defined a particular “great idea”.
The fundamental tools used in this analysis were a set of rudimentary Perl modules: Lingua::EN::Fathom for calculating the total number of words in a document as well as a document’s reading level, Lingua::EN::Bigram for listing the most frequently occurring words and phrases, and Lingua::Concordance for listing sentence snippets. The Perl programs built on top of these modules are relatively short and include: fathom.pl, words.pl, bigrams.pl and concordance.pl. (If you really wanted to download the full text versions of Plato, Aristotle, and Shakespeare‘s works used in this analysis.) While the programs themselves are really toys, the potential they represent are not. It would not be too difficult to integrate their functionality into a library “catalog”. Assume the existence of significant amount of full text content in a library collection. Do a search against the collection. Create a subset of content. Click a few buttons to implement statistical analysis against the result. Enable the user to “browse” the content and follow a line of thought.
The process outlined in the previous section is not intended to replace rigorous reading, but rather to supplement it. It enables a person to identify trends quickly and easily. It enables a person to read at “Web scale”. Again, find is not the problem to be solved. People can find more information than they require. Instead, people need to use and analyze the content they find. This content can be anything from novels to textbooks, scholarly journal articles to blog postings, data sets to collections of images, etc. The process outlined above is an example of services against texts, a way to “Save the time of the reader” and empower them to make better and more informed decisions. The fundamental processes of librarianship (collection, preservation, organization, and dissemination) need to be expanded to fit the current digital environment. The services described above are examples of how processes can be expanded.
The next “next generation library catalog” is not about find, instead it is about use. Integrating digital humanities computing techniques into library collections and services is just one example of how this can be done.
This posting describes how I am assigning quantitative characteristics to texts in an effort to answer the question, “How ‘great’ are the Great Books?” In the end I make a plea for library science.
With the advent of copious amounts of freely available plain text on the ‘Net comes the ability of “read” entire corpora with a computer and apply statistical processes against the result. In an effort to explore the feasibility of this idea, I am spending time answering the question, “How ‘great’ are the Great Books?”
More specifically, want to assign quantitative characteristics to each of the “books” in the Great Books set, look for patterns in the result, and see whether or not I can draw any conclusions about the corpus. If such processes are proven effective, then the same processes may be applicable to other corpora such as collections of scholarly journal articles, blog postings, mailing list archives, etc. If I get this far, then I hope to integrate these processes into traditional library collections and services in an effort to support their continued relevancy.
On my mark. Get set. Go.
The Great Books set posits 102 “great ideas” — basic, foundational themes running through the heart of Western civilization. Each of the books in the set were selected for inclusion by the way they expressed the essence of these great ideas. The ideas are grand and ambiguous. They include words such as angel, art, beauty, courage, desire, eternity, god, government, honor, idea, physics, religion, science, space, time, wisdom, etc. (See Appendix B of “How ‘great’ are the Great Books?” for the complete list.)
In a previous posting, “Great Ideas Coefficient“, I outlined the measure I propose to use to determine the books’ “greatness” — essentially a sum of all TFIDF (term frequency / inverse document frequency) scores as calculated against the list of great ideas. TFIDF is defined as:
( c / t ) * log( d / f )
where:
Thus, the problem boils down to determining the values for c, t, d, and f for a given great idea, 2) summing the resulting TFIDF scores, 3) saving the results, and 4) repeating the process for each book in the corpus. Here, more exactly, is how I am initially doing such a thing:
Of course I didn’t do all of this by hand, and the program I wrote to do the work is called measure.pl.
The result is my pseudo database file — great-books.xml. This is my data set. It keeps track all of my information in a human-readable, application- and operating system-independent manner. Very nice. If there is only one file you download from this blog posting, then it should be this file. Using it you will be able to create your own corpus and do your own analysis.
The process outlined above is far from perfect. First, there are a few false negatives. For example, the great idea “universe” returned a TFIDF value of zero (0) for every document. Obviously is is incorrect, and I think the error has something to do with the stemming and/or indexing subprocesses. Second, the word “being”, as calculated by TFIDF, is by far and away the “greatest” idea. I believe this is true because the word “being” is… being counted as both a noun as well as a verb. This points to a different problem — the ambiguity of the English language. While all of these issues will knowingly skew the final results, I do not think they negate the possibility of meaningful statistical investigation. At the same time it will be necessary to refine the measurement process to reduce the number of “errors”.
Measurement is one of the fundamental qualities of science. The work of Archimedes is the prototypical example. Kepler and Galileo took the process to another level. Newton brought it to full flower. Since Newton the use of measurement — the assignment of mathematical values — applied against observations of the natural world and human interactions have given rise to the physical and social sciences. Unlike studies in the humanities, science is repeatable and independently verifiable. It is objective. Such is not a value judgment, merely a statement of fact. While the sciences seem cold, hard, and dry, the humanities are subjective, appeal to our spirit, give us a sense of purpose, and tend to synthesis our experiences into a meaningful whole. Both of the scientific and humanistic thinking processes are necessary for us to make sense of the world around us. I call these combined processes “arscience“.
The library profession could benefit from the greater application of measurement. In my opinion, too much of the profession’s day-to-day as well as strategic decisions are based on antidotal evidence and gut feelings. Instead of basing our actions on data, actions are based on tradition. “This is the way we have always done it.” This is medieval, and consequently, change comes very slowly. I sincerely believe libraries are not going away any time soon, but I do think the profession will remain relevant longer if librarians were to do two things: 1) truly exploit the use of computers, and 2) base a greater number of their decisions on data — measurment — as opposed to opinion. Let’s call this library science.
2010-06-15T16:48:56+00:00 Mini-musings: Collecting the Great Books http://infomotions.com/blog/2010/06/collecting-the-great-books/In an effort to answer the question, “How ‘great’ are the Great Books?“, I need to mirror the full texts of the Great Books. This posting describes the initial process I am using to do such a thing, but the imporant thing to note is that this process is more about librarianship than it is about software.
The Great Books is/was a 60-volume set of content intended to further a person’s liberal arts education. About 250 “books” in all, it consists of works by Homer, Aristotle, Augustine, Chaucer, Cervantes, Locke, Gibbon, Goethe, Marx, James, Freud, etc. There are a few places on the ‘Net where the complete list of authors/titles can be read. One such place is a previous blog posting of mine. My goal is to use digital humanities computing techniques to statistically describe the works and use these descriptions to supplement a person’s understanding of the texts. I then hope to apply these same techniques to other corpora. To accomplish this goal I first need to acquire full text versions of the Great Books. This posting describes how I am initially going about it.
All of the books of the Great Books were written by “old dead white men”. It is safe to assume the texts have been translated into a myriad of languages, including English, and it is safe to assume the majority exist in the public domain. Moreover, with the advent of the Web and various digitizing projects, it is safe to assume quality information gets copied forward and will be available for downloading. All of this has proven to be true. Through the use of Google and a relatively small number of repositories (Project Gutenberg, Alex Catalogue of Electronic Texts, Internet Classics Archive, Christian Classics Ethereal Library, Internet Archive, etc.), I have been able to locate and mirror 223 of the roughly 250 Great Books. Here’s how:
The results of this 5-step process include:
The most important file, by far, is the metadata file. It is intended to be a sort of application- and operating system-independent database. Given this file, anybody ought to be able to duplicate the analysis I propose to do later. If there is only one file you download from this blog posting, it should be the metadata file — great-books.xml.
The collection process is not perfect. I was unable to find many of the works of Archimedes, Copernicus, Kepler, Newton, Galileo, or Freud. For all but Freud, I attribute this to the lack of translations, but I suppose I could stoop to the use of poorly OCR’ed texts from Google Books. I attribute the unavailability of Freud to copyright issues. There’s no getting around that one. A few times I located HTML versions of desired texts, but HTML will ultimately skew my analysis. Consequently I used a terminal-based program called lynx to convert and locally save the remote HTML to a plain text file. I then included that file into my corpus. Alas, there are always ways to refine collections. Like software, they are are never done.
The process outlined above is really about librarianship and not software. Specifically, it is about collection development, acquisitions, and cataloging. I first needed to articulate a development policy. While it did not explicitly describe the policy it did outline why I wanted to create the collection as well as a few of each item’s necessary qualities. The process above implemented a way to actually get the content — acquisitions. Finally, I described — “cataloged” — my content, albiet in a very rudimentary form.
It is an understatement to say the Internet has changed the way data, information, and knowledge are collected, preserved, organized, and disseminated. By extension, librarianship needs to change in order to remain relevant with the times. Our profession spends much of its time trying to refine old processes. It is like trying to figure out how to improve the workings of a radio when people have moved on to the use of televisions instead. While traditional library processes are still important, they are not as important as the used to be.
The processes outline above illustrate one possible way librarianship can change the how’s of its work while retaining it’s what’s.
2010-06-13T23:17:11+00:00 Mini-musings: Inaugural Code4Lib “Midwest” Regional Meeting http://infomotions.com/blog/2010/06/inaugural-code4lib-midwest-regional-meeting/I believe the Inaugural Code4Lib “Midwest” Regional Meeting (June 11 & 12, 2010 at the University of Notre Dame) was a qualified success.
About twenty-six people attended. (At least that was the number of people who went to lunch.) They came from Michigan, Ohio, Iowa, Indiana, and Illinois. Julia Bauder won the prize for coming the furthest distance away — Grinnell, Iowa.

Day #1
We began with Lightning Talks:
We dined in the University’s South Dining Hall, and toured a bit of the campus on the way back taking in the “giant marble”, the Architecture Library, and the Dome.
In the afternoon we broke up into smaller groups and discussed things including institutional repositories, mobile devices & interfaces, ePub files, and FRBR. In the evening we enjoyed varieties of North Carolina barbecue, and then retreated to the campus bar (Legend’s) for a few beers.
I’m sorry to say the Code4Lib Challenge was not successful. Us hackers were either to engrossed to notice whether or not anybody came to the event, or nobody showed up to challenge us. Maybe next time.

Day #2
There were fewer participants on Day #2. We spent the time listening to Ken elaborate on the uses and benefits of jQuery. I hacked at something I’m calling “The Great Books Survey”.
The event was successful in that it provided plenty of opportunity to discuss shared problems and solutions. Personally, I learned I need to explore statistical correlations, regressions, multi-varient analysis, and principle component analysis to a greater degree.
A good time was had by all, and it is quite possible the next “Midwest” Regional Meeting will be hosted by the good folks in Chicago.
For more detail about Code4Lib “Midwest”, see the wiki: http://wiki.code4lib.org/index.php/Midwest.
2010-06-12T20:17:46+00:00 Mini-musings: How “great” are the Great Books? http://infomotions.com/blog/2010/06/how-great-are-the-great-books/In the 1952 a set of books called the Great Books of the Western World was published. It was supposed to represent the best of Western literature and enable the reader to further their liberal arts education. Sixty volumes in all, it included works by Plato, Aristotle, Shakespeare, Milton, Galileo, Kepler, Melville, Darwin, etc. (See Appendix A.) These great books were selected based on the way they discussed a set of 102 “great ideas” such as art, astronomy, beauty, evil, evolution, mind, nature, poetry, revolution, science, will, wisdom, etc. (See Appendix B.) How “great” are these books, and how “great” are the ideas expressed in them?
Given full text versions of these books it would be almost trivial to use the “great ideas” as input and apply relevancy ranking algorithms against the texts thus creating a sort of score — a “Great Ideas Coefficient”. Term Frequency/Inverse Document Frequency is a well-established algorithm for computing just this sort of thing:
relevancy = ( c / t ) * log( d / f )
where:
Thus, to calculate our Great Ideas Coefficient we would sum the relevancy score for each “great idea” for each “great book”. Plato’s Republic might have a cumulative score of 525 while Aristotle’s On The History Of Animals might have a cumulative score of 251. Books with a larger Coefficient could be considered greater. Given such a score a person could measure a book’s “greatness”. We could then compare the score to the scores of other books. Which book is the “greatest”? We could compare the score to other measurable things such as book’s length or date to see if there were correlations. Are “great books” longer or shorter than others? Do longer books contain more “great ideas”? Are there other books that were not included in the set that maybe should have been included? Instead of summing each relevancy score, maybe the “great ideas” can be grouped into gross categories such as humanities or sciences, and we can sum those scores instead. Thus we may be able to say one set of book is “great” when it comes the expressing the human condition and these others are better at describing the natural world. We could ask ourselves, which number of books represents the best mixture of art and science because their humanities score is almost equal to its sciences score. Expanding the scope beyond general education we could create an alternative set of “great ideas”, say for biology or mathematics or literature, and apply the same techniques to other content such as full text scholarly journal literatures.
The initial goal of this study is to examine the “greatness” of the Great Books, but the ultimate goal is to learn whether or not this quantitative process can be applied other bodies of literature and ultimately assist the student/scholar in their studies/research
Wish me luck.
angel • animal • aristocracy • art • astronomy • beauty • being • cause • chance • change • citizen • constitution • courage • custom & convention • definition • democracy • desire • dialectic • duty • education • element • emotion • eternity • evolution • experience • family • fate • form • god • good & evil • government • habit • happiness • history • honor • hypothesis • idea • immortality • induction • infinity • judgment • justice • knowledge • labor • language • law • liberty • life & death • logic • love • man • mathematics • matter • mechanics • medicine • memory & imagination • metaphysics • mind • monarchy • nature • necessity & contingency • oligarchy • one & many • opinion • opposition • philosophy • physics • pleasure & pain • poetry • principle • progress • prophecy • prudence • punishment • quality • quantity • reasoning • relation • religion • revolution • rhetoric • same & other • science • sense • sign & symbol • sin • slavery • soul • space • state • temperance • theology • time • truth • tyranny • universal & particular • virtue & vice • war & peace • wealth • will • wisdom • world
2010-06-11T01:08:17+00:00 Mini-musings: Not really reading http://infomotions.com/blog/2010/06/not-really-reading/Using a number of rudimentary digital humanities computing techniques, I tried to practice what I preach and extract the essence from a set of journal articles. I feel like the process met with some success, but I was not really reading.
A set of twenty-one (21) essays on the future of academic librarianship was recently brought to my attention:
Leaders Look Toward the Future – This site compiled by Camila A. Alire and G. Edward Evans offers 21 essays on the future of academic librarianship written by individuals who represent a cross-section of the field from the largest institutions to specialized libraries.
Since I was too lazy to print and read all of the articles mentioned above, I used this as an opportunity to test out some of my “services against text” ideas.
Specifically, I used a few rudimentary digital humanities computing techniques to glean highlights from the corpus. Here’s how:

Yes, there may very well be some subtle facts I missed by not reading the full texts, but I think I got a sense of what the articles discussed. It would be interesting to sit a number of people down, have them read the articles, and then have them list out a few salient sentences. To what degree would their result be the same or different from mine?
I was able to write the programs from scratch, do the analysis, and write the post in about two hours, total. It would have taken me that long to read the articles. Just think what a number of librarians could do, and how much time could be saved if this system were expanded to support just about any plain text data.
2010-06-10T03:35:16+00:00 Mini-musings: Cyberinfrastructure Days at the University of Notre Dame http://infomotions.com/blog/2010/05/cyberinfrastructure-days-at-the-university-of-notre-dame/
 On Thursday and Friday, April 29 and 30, 2010 I attended a Cyberinfrastructure Days event at the University of Notre Dame. Through this process my personal definition of “cyberinfrastructure” was updated, and my basic understanding of “digital humanities computing” was confirmed. This posting documents the experience.
The first day was devoted to cyberinfrastructure and the humanities.
After all of the necessary introductory remarks, John Unsworth (University of Illinois – Urbana/Champagne) gave the opening keynote presentation entitled “Reading at library scale: New methods, attention, prosthetics, evidence, and argument“. In his talk he posited the impossibility of reading everything currently available. There is just too much content. Given some of the computing techniques at our disposal, he advocated additional ways to “read” material, but cautioned the audience in three ways: 1) there needs to be an attention to prosthetics, 2) an appreciation for evidence and statistical significance, and 3) a sense of argument so the skeptic may be able to test the method. To me this sounded a whole lot like applying scientific methods to the process of literary criticism. Unsworth briefly described MONK and elaborated how part of speech tagging had been done against the corpus. He also described how Dunning’s Log-Likelihood statistic can be applied to texts in order to determine what a person does (and doesn’t) include in their writings.
Stéfan Sinclair (McMaster University) followed with “Challenges and opportunities of Web-based analytic tools for the humanities“. He gave a brief history of the digital humanities in terms of computing. Mainframes and concordances. Personal computers and even more concordances. Webbed interfaces and locally hosted texts. He described digital humanities as something that has evolved in cycles since at least 1967. He advocated the new tools will be Web apps — things that can be embedded into Web pages and used against just about any text. His Voyeur Tools were an example. Like Unsworth, he advocated the use of digital humanities computing techniques because they can supplement the analysis of texts. “These tools allow you to see things that are not evident.” Sinclair will be presenting a tutorial at the annual digital humanities conference this July. I hope to attend.
In a bit of change of pace, Russ Hobby (Internet2) elaborated on the nuts & bolts of cyberinfrastructure in “Cyberinfrastructure components and use“. In this presentation I learned that many scientists are interested in the… science, and they don’t really care about the technology supporting it. They have an instrument in the field. It is collecting and generating data. They want to analyze that data. They are not so interested in how it gets transported from one place to another, how it is stored, or in what format. As I knew, they are interested in looking for patterns in the data in order to describe and predict events in the natural world. “Cyberinfrastructure is like a car. ‘Car, take me there.'” Cyberinfrastructure is about controls, security systems, storage sets, computation, visualization, support & training, collaboration tools, publishing, communication, finding, networking, etc. “We are not there to answer the question, but more to ask them.”
In the afternoon I listened to Richard Whaling (University of Chicago) present on “Humanities computing at scale“. Given from the point of view of a computer scientist, this presentation was akin to Hobby’s. On one hand there are people do analysis and there are people who create the analysis tools. Whaley is more like the later. I thought his discussion on the format of texts was most interesting. “XML is good for various types of rendering, but not necessarily so good for analysis. XML does not necessarily go deep enough with the encoding because the encoding is too expensive; XML is not scalable. Nor is SQL. Indexing is the way to go.” This perspective jives with my own experience. Encoding texts in XML (TEI) is so very tedious and the tools to do any analysis against the result are few and far between. Creating the perfect relational database (SQL) is like seeking the Holy Grail, and SQL is not designed to do full text searching nor “relevancy ranking”. Indexing texts and doing retrieval against the result has proven to be much more fruitful or me, but such an approach is an example of “Bag of Words” computing, and thus words (concepts) often get placed out of context. Despite that, I think the indexing approach holds the most promise. Check out Perseus under Philologic and Digital South Asia Library to see some of Whaley’s handiwork.
Chris Clarke (University of Notre Dame), in “Technology horizons for teaching and learning“, enumerated ways the University of Notre Dame is putting into practice many of the things described in the most recent Horizon Report. Examples included the use of ebooks, augmented reality, gesture-based computing, and visual data analysis. I thought the presentation was a great way to bring the forward-thinking report down to Earth and place it into a local context. Very nice.
William Donaruma (also from the University of Notre Dame) described the process he was going through to create 3-D movies in a presentation called “Choreography in a virtual space“. Multiple — very expensive — cameras. Dry ice. Specific positioning of the dancers. Special glasses. All of these things played into the creation of an illusion of three-dimensions on a two-dimensional space. I will not call it three-dimensional until I can walk around the object in question. The definition of three-dimensional needs to be qualified.
The final presentation of the day took place after dinner. The talk, “The Transformation of modern science” was given virtually by Edward Seidel (National Science Foundation). Articulate. Systematic. Thorough. Insightful. These are the sorts of words I use to describe Seidel’s talk. Presented remotely through a desktop camera and displayed on a screen to the audience, we were given a history of science and a description of how it has changed from single-man operations to large-group collaborations. We were shown the volume of information created previously and compared it to the volume of information generated now. All of this led up to the most salient message — “All future National Science Foundation grant proposals must include a data curation plan.” Seidel mentioned libraries, librarians, and librarianship quite a number of times during the talk. Naturally my ears perked up. My profession is about the collection, preservation, organization, and dissemination of data, information, and knowledge. The type of content to which these processes are applied — books, journal articles, multi-media recordings, etc — is irrelevant. Given a collection policy, it can all be important. The data generated by scientists and their machines is no exception. Is our profession up to the challenge, or are we too much wedded to printed, bibliographic materials? It is time for librarians to aggressively step up to the plate, or else. Here is an opportunity being laid at our feet. Let’s pick it up!
The second day centered more around the sciences as opposed to the humanities.
The day began with a presentation by Tony Hey (Microsoft Research) called “The Fourth Paradigm: Data-intensive scientific discovery“. Hey described cyberinfrastructure as the new name for e-science. He then echoed much of content of Seidel’s message from the previous evening and described the evolution of science in a set of paradigms: 1) theoretical, 2) experimental, 3) computational, and 4) data-intensive. He elaborated on the infrastructure components necessary for data-intensive science: 1) acquisition, 2) collaboration & visualization, 3) analysis & mining, 4) dissemination & sharing, 5) archiving & preservation. (Gosh, that sounds a whole lot like my definition of librarianship!) He saw Microsoft’s role as one of providing the necessary tools to facilitate e-science (or cyberinfrastructure) and thus the Fourth Paradigm. Hey’s presentation sounded a lot like open access advocacy. More Association of Research Library library directors as well as university administrators need to hear what he has to say.
Boleslaw Syzmanski (Rensselaer Polytechnic Institute) described how better science could be done in a presentation called “Robust asynchronous optimization for volunteer computing grids“. Like Hobby and Whaley mentioned (above), Syzmanski separated the work of the scientist and the work of cyberinfrastructure. “Scientists do not want to be bothered with the computer science of their work.” He then went on to describe a distributed computing technique for studying the galaxy — MilkyWay@home. He advocated cloud computing as a form of asynchronous computing.
The third presentation of the day was entitled “Cyberinfrastructure for small and medium laboratories” by Ian Foster (University of Chicago). The heart of this presentation was advocacy for software as a service (SaaS) computing for scientific laboratories.
Ashok Srivastava (NASA) was the first up in the second session with “Using Web 2.0 and collaborative tools at NASA“. He spoke to one of the basic principles of good science when he said, “Reproducibility is a key aspect of science, and with access to the data this reproducibility is possible.” I’m not quite sure my fellow librarians and humanists understand the importance of such a statement. Unlike work in the humanities — which is often built on subjective and intuitive interpretation — good science relies on the ability for many to come to the same conclusion based on the same evidence. Open access data makes such a thing possible. Much more of Srivastava’s presentation was about DASHlink, “a virtual laboratory for scientists and engineers to disseminate results and collaborate on research problems in health management technologies for aeronautics systems.”
“Scientific workflows and bioinformatics applications” by Ewa Deelman (University of Southern California) was up next. She echoed many of the things I heard from library pundits a few years ago when it came to institutional repositories. In short, “Workflows are what are needed in order for e-science to really work… Instead of moving the data to the computation, you have to move the computation to the data.” This is akin to two ideas. First, like Hey’s idea of providing tools to facilitate cyberinfrastructure, Deelman advocates integrating the cyberinfrastructure tools into the work of scientists. Second, e-science is more than mere infrastructure. It also approaches the “services against text” idea which I have been advocating for a few years.
Jeffrey Layton (Dell, Inc.) rounded out the session with a presentation called “I/O pattern characterization of HPC applications“. In it he described how he used the output of strace commands — which can be quite voluminous — to evaluate storage input/output patterns. “Storage is cheap, but it is only one of a bigger set of problems in the system.”
By this time I was full, my iPad had arrived in the mail, and I went home.
It just so happens I was given the responsibility of inviting a number of the humanists to the event, specifically: John Unsworth, Stéphan Sinclair, and Richard Whaley. That is was an honor, and I appreciate the opportunity. “Thank you.”
I learned a number of things, and a few other things were re-enforced. First, the word “cyberinfrastructure” is the newly minted term for “e-science”. Many of the presenters used these two words interchangeably. Second, while my experience with the digital humanities is still in its infancy, I am definitely on the right track. Concordances certainly don’t seem to be going out of style any time soon, and my use of indexes is a movement in the right direction. Third, the cyberinfrastructure people see themselves as support to the work of scientists. This is similar to the work of librarians who see themselves supporting their larger communities. Personally, I think this needs to be qualified since I believe it is possible for me to expand the venerable sphere of knowledge too. Providing library (or cyberinfrastructure) services does not preclude me from advancing our understanding of the human condition and/or describing the natural world. Lastly, open source software and open access publishing were common underlying themes but not rarely explicitly stated. I wonder whether or not the the idea of “open” is a four letter word.
2010-05-23T14:46:08+00:00 Mini-musings: About Infomotions Image Gallery: Flickr as cloud computing http://infomotions.com/blog/2010/05/about-infomotions-image-gallery-flickr-as-cloud-computing/
 This posting describes the whys and wherefores behind the Infomotions Image Gallery.
I was introduced to photography during library school, specifically, when I took a multi-media class. We were given film and movie cameras, told to use the equipment, and through the process learn about the medium. I took many pictures of very tall smoke stacks and classical-looking buildings. I also made a stop-action movie where I step-by-step folded an origami octopus and underwater sea diver while a computer played the Beatles’ “Octopuses Garden” in the background. I’d love to resurrect that 16mm film.
I was introduced to digital photography around 1995 when Steve Cisler (Apple Computer) gave me a QuickTake camera as a part of a payment for writing a book about Macintosh-based HTTP servers. That camera was pretty much fun. If I remember correctly, it took 8-bit images and could store about twenty-four of them at a time. The equipment worked perfectly until my wife accidentally dropped it into a pond. I still have the camera, somewhere, but it only works if it is plugged into an electrical socket. Since then I’ve owned a few other digital cameras and one or two digital movie cameras. They have all been more than simple point-and-shoot devices, but at the same time, they have always had more features than I’ve ever really exploited.
Over the years I mostly used the cameras to document the places I’ve visited. I continue to photograph buildings. I like to take macro shots of flowers. Venuses are always appealing. Pictures of food are interesting. In the self-portraits one is expected to notice the background, not necessarily the subject of the image. I believe I’m pretty good at composition. When it comes to color I’m only inspired when the sun is shining bright, and that makes some of my shots overexposed. I’ve never been very good at photographing people. I guess that is why I prefer to take pictures of statues. All things library and books are a good time. I wish I could take better advantage of focal lengths in order blur the background but maintain a sharp focus in the foreground. The tool requires practice. I don’t like to doctor the photographs with effects. I don’t believe the result represents reality. Finally, I often ask myself an aesthetic question, “If I was looking through the camera to take the picture, then did I really see what was on the other side?” After all, my perception was filtered through an external piece of equipment. I guess I could ask the same question of all my perceptions since I always wear glasses.
The Infomotions Image Gallery is simply a collection of my photography, sans personal family photos. It is just another example of how I am trying to apply the principles of librarianship to the content I create. Photographs are taken. Individual items are selected, and the collection is curated. Given the available resources, metadata is applied to each item, and the whole is organized into sets. Every year the newly created images are archived to multiple mediums for preservation purposes. (I really ought to make an effort to print more of the images.) Finally, an interface is implemented allowing people to access the collection.
Enjoy.


This section describes how the Gallery is currently implemented.
About ten years ago I began to truly manage my photo collection using Apple’s iPhoto. At just about the same time I purchased an iPhoto add-on called BetterHTMLExport. Using a macro language, this add-on enabled me to export sets of images to index and detail pages complete with titles, dates, and basic numeric metadata such as exposure, f-stop, etc. The process worked but the software grew long in the tooth, was sold to another company, and was always a bit cumbersome. Moreover, maintaining the metadata was tedious inhibiting my desire to keep it up to date. Too much editing here, exporting there, and uploading to the third place. To make matters worse, people expect to comment on the photos, put them into their own sets, and watch some sort of slide show. Enter Flickr and a jQuery plug-in called ColorBox.
After learning how to use iPhoto’s ability to publish content to Flickr, and after taking a closer look at Flickr’s application programmer interace (API), I decided to use Flickr to host my images. The idea was to: 1) maintain the content on my local file system, 2) upload the images and metadata to Flickr, and 3) programmatically create in interface to the content on my website. The result was a more streamlined process and a set of Perl scripts implementing a cleaner user interface. I was entering the realm of cloud computing. The workflow is described below:
Using this process I can focus more on my content and less on my presentation. It makes it easier for me to focus on the images and their metadata and less on how the content will be displayed. Graphic design is not necessarily my forte.
Flickr2gallery is a suite of Perl scripts and plain text files:
img elements filled with links to random images.I know the Flickr API has been around for quite a while, and I know I’m a Johnny Come Lately when it comes to learning how to use it, but that does not mean it can’t be outlined here. The API provides a whole lot of functionality. Reading and writing of image content and metadata. Reading and writing information about users, groups, and places. Using the REST-like interface the programmer constructs a command in the form of a URL. The URL is sent to Flickr via HTTP. Responses are returned in easy-to-read XML.
A good example is the way I create my pages of images with a given tag. First I denote a constant which is the root of a Flickr tag search. Next, I define the location of the Infomotions pages on Flickr. Then, after getting a list of all of my tags, I search Flickr for images using each tag as a query. These results are then looped through, parsed, and built into a set of image links. Finally, the links are incorporated into a template and saved to a local file. Below lists the heart of the process:
  use constant S => 'http://api.flickr.com/services/rest/?
                                  method=flickr.photos.search&
                                  api_key=YOURKEY&user_id=YOURID&tags=';
  use constant F => 'http://www.flickr.com/photos/infomotions/';

  # get list of all tags here

  # find photos with this tag
  $request  = HTTP::Request->new( GET => S . $tag );
  $response = $ua->request( $request );

  # process each photo
  $parser    = XML::XPath->new( xml => $response->content );
  $nodes     = $parser->find( '//photo' );
  my $cgi    = CGI->new;
  my $images = '';
  foreach my $node ( $nodes->get_nodelist ) {

  # parse
  my $id     = $node->getAttribute( 'id' );
  my $title  = $node->getAttribute( 'title' );
  my $farm   = $node->getAttribute( 'farm' );
  my $server = $node->getAttribute( 'server' );
  my $secret = $node->getAttribute( 'secret' );

  # build image links
  my $thumb = "http://farm$farm.static.flickr.com/$server/$id" .
              '_' . $secret . '_s.jpg';
  my $full  = "http://farm$farm.static.flickr.com/$server/$id" .
              '_' . $secret . '.jpg';
  my $flickr = F . "$id/";

  # build list of images
  $images .= $cgi->a({ href => $full,
                       rel => 'slideshow',
                       title => "<a href='$flickr'>Details on Flickr</a>"
                      },
                      $cgi->img({ alt => $title, src => $thumb,
                      border => 0, hspace => 1, vspace => 1 }));

  }

  # save image links to file here
Notice the rel attribute (slideshow) in each of the images’ anchor elements. These attributes are used as selectors in a jQuery plug-in called ColorBox. In the head of each generated HTML file is a call to ColorBox:
  <script type="text/javascript">
    $(document).ready(function(){
      $("a[rel='slideshow']").colorbox({ slideshowAuto: false,
                                         current: "{current} of {total}",
                                         slideshowStart: 'Slideshow',
                                         slideshowStop: 'Stop',
                                         slideshow: true,
                                         transition:"elastic" });
      });
  </script>
Using this plug-in I am able to implement a simple slideshow when the user clicks on any image. Each slideshow display consists of simple navigation and title. In my case the title is really a link back to Flickr where the user will be able to view more detail about the image, comment, etc.


I am an amateur photographer, and the fruits of this hobby are online here for sharing. If you use them, then please give credit where credit is due.
The use of Flickr as a “cloud” to host my images is very useful. It enables me to mirror my content in more than one location as well as provide access in multiple ways. When the Library of Congress announced they were going to put some of their image content on Flickr I was a bit taken aback, but after learning how the Flickr API can be exploited I think there are many opportunities for libraries and other organizations to do the same thing. Using the generic Flickr interface is one way to provide access, but enhanced and customized access can be implemented through the API. Lots of food for thought. Now to apply the same process to my movies by exploiting YouTube.
2010-05-22T21:19:34+00:00 Mini-musings: Shiny new website http://infomotions.com/blog/2010/05/shiny-new-website/
 Infomotions has a shiny new website, and the process to create it was not too difficult.
A relatively long time ago (in a galaxy far far away), I implemented an Infomotions website look & feel. Tabbed interface across the top. Local navigation down the left-hand side. Content in the middle. Footer along the bottom. Typical. Everything was rather square. And even though I used pretty standard HTML and CSS, its implementation was not really conducive to Internet Explorer. My bad.
Moreover, people’s expectations have increased dramatically since I first implemented my site’s look & feel. Curved lines. Pop-up windows. Interactive AJAX-like user experiences. My site was definitely not Web 2.0 in nature. Static. Not like a desktop application.
Finally, as time went on my site’s look & feel was not as consistently applied as I had hoped. Things were askew and the whole thing needed refreshing.
 My ultimate solution is rooted in jQuery and its canned themes.
As you may or may not know, jQuery is a well-supported Javascript library supporting all sorts of cool things like drag ‘n drop, sliders, many animations, not to mention a myriad of ways to manipulate the Document Object Model (DOM) of HTML pages. An extensible framework, jQuery is also the foundation for many plug-in modules.
Just as importantly, jQuery supports a host of themes — CSS files implementing various looks & feels. These themes are very standards compliant and work well on all browsers. I was particularly enamored with the tabbed menu with rounded corners. (Under the hood, these rounded corners are implemented by a browser framework called Webkit. Let’s keep our eye on that one.) After learning how to implement the tabbed interface without the use of Javascript, I was finally on my way. As Dan Brubakerhorst said to me, “It is nothing but styling.”
None of Infomotions subsites are driven by hand-coded HTML. Everything comes from some sort of script. The Alex Catalogue is a database-driven website with mod-Perl modules. The water collection is supported by a database plus XSLT transformations of XML on the fly. The blog is WordPress. My “musings” are sets of TEI files converted in bulk into HTML. While it took a bit of tweaking in each of these subsites, the process was relatively painless. Insert the necessary divs denoting the menu bar, left-hand navigation, and content into my frameworks. Push the button. Enjoy. If I want to implement a different color scheme or typography, then I simply change a single CSS file for the entire site. In retrospect, the most difficult thing for me to convert was my blog. I had to design my own theme. Not too hard, but definitely a learning curve.
A feature I feel pretty strongly about is printing. The Web is one medium. Content on paper is another medium. They are not the same. In general, websites have more of a landscape orientation. Printed mediums more or less have portrait orientations. In the printed medium there is no need for global navigation, local navigation, nor hyperlinks. Silly. Margins need to be accounted for. Pages need to be signed, dated, and branded. Consequently, I wrote a single print-based CSS file governing the entire site. Pages print quite nicely. So nicely I may very well print every single page from my website and bind the whole thing into a book. Call it preservation.
In many ways I consider myself to be an artist, and the processes of librarianship are my mediums. Graphic design is not my forte, but I feel pretty good about my current implementation. Now I need to get back to the collection, organization, preservation, and dissemination of data, information, and knowledge.
2010-05-21T01:21:04+00:00 Water collection: Grand River at Grand Rapids (Michigan) http://infomotions.com/water/index.xml?cmd=getwater&id=104 Map it |
When I talk about “services against text” I usually get blank stares from people. When I think about it more, many of the services I enumerate are based on the counting of words. Consequently, I spent some time doing just that — counting words.
I wanted to analyze the content of a couple of the mailing lists I own/moderate, specifically Code4Lib and NGC4Lib. Who are the most frequent posters? What words are used most often in the subject lines, and what words are used most often in the body of the messages? Using a hack I wrote (mine-mail.pl) I was able to generate simple tables of data:
I then fed these tables to Wordle to create cool looking images. I also fed these tables to a second hack (dat2cloud.pl) to create not-even-close-to-valid HTML files in the form of hyperlinked tag clouds. Below is are the fruits of these efforts:
 image of names |
 tag cloud of names |
 image of subjects |
 tag cloud of subjects |
 image of words |
 tag cloud of words |
The next step is to plot the simple tables on a Cartesian plane. In other words, graph the data. Wish me luck.
This posting outlines a concept I call the Great Ideas Coefficient — an additional type of metadata used to denote the qualities of a text.
 Great Ideas Coefficient |
In the 1950s a man named Mortimer Adler and colleagues brought together what they thought were the most significant written works of Western civilization. They called this collection the Great Books of the Western World. Before they created the collection they outlined what they thought were the 100 most significant ideas of Western civilization. These are “great ideas” such as but not limited to beauty, courage, education, law, liberty, nature, sin, truth, and wisdom. Interesting.
Suppose you were able to weigh the value of a book based on these “great ideas”. Suppose you had a number of texts and you wanted to rank or list them according to the number of times they mentioned the “great ideas”. Such a thing can be done through the application of TFIDF. Here’s how:
Once the scores are calculated, they can be graphed, and once they are graphed they can be illustrated.
An example of this technique is shown above. For each item in a list of works by Aristotle a Great Ideas Coefficient has been calculated and assigned. The list was the ordered by the score. The score was then plotted graphically. Finally, all the graphs were joining together as an animated GIF image to show the range of scores in the list. Luckily the process seems to work because Aristotle’s Metaphysics ranks at the top with the highest Great Ideas Coefficient, and his History of Animals ranks the lowest. ‘Seems to make sense.
The concept behing the Great Ideas Coefficient is not limited to “great ideas”. Any set of words or phrases could be used. For example, one could create a list of “big names” (Plato, Shakespeare, Galileo, etc.) and calculate a Big Names Coefficient. Alternatively, a person could create a list of other words or phrases for any topic or genre to weigh a set of texts against biology, mathematics, literature, etc.
Find is not the problem that needs to be solved now-a-days. The problem of use and understanding is more pressing. People can find plenty of information. They need (want) assistance in putting the information into context. “Books are for use.” The application of something like the Great Ideas Coefficient may be just one example.
2010-03-27T11:58:07+00:00 Musings: Indexing and abstracting http://infomotions.com/musings/indexing-abstracting/ This presentation outlines sets of alternative processes for traditional library indexing and abstracting practices. To do this it first describes the apparent goal of indexing and abstracting. It then describes how these things have traditionally been manifested. Third, it outlines how the goals of indexing and abstract can be implemented through the exploitation of computer technology. Finally, it describes some ways computers can be used even more to go beyond traditional indexing and abstracting to provide services against texts.I made available my first ePub file today.
 Screen shot |
I created my first Apple Macintosh Widget today — Alex Catalogue Widget.

The tool is pretty rudimentary. Enter something into the field. Press return or click the Search button. See search results against the Alex Catalogue of Electronic Texts displayed in your browser. The development process reminded me of hacking in HyperCard. Draw things on the screen — buttons, fields, etc. — and assocate actions (events) with each of them.
Download it and try it for yourself.
2010-03-16T03:43:34+00:00 Mini-musings: Michael Hart in Roanoke (Indiana) http://infomotions.com/blog/2010/03/michael-hart-in-roanoke-indiana/On Saturday, February 27, Paul Turner and I made our way to Roanoke (Indiana) to listen to Michael Hart tell stories about electronic texts and Project Gutenberg. This posting describes our experience.
To celebrate its 100th birthday, the Roanoke Public Library invited Michael Hart of Project Gutenberg fame to share his experience regarding electronic texts in a presentation called “Books & eBooks: Past, Present & Future Libraries”. The presentation was scheduled to start around 3 o’clock, but Paul Turner and I got there more than an hour early. We wanted to have time to visit the Library before it closed at 2 o’clock. The town of Roanoke (Indiana) — a bit south west of Fort Wayne — was tiny by just about anybody’s standard. It sported a single blinking red light, a grade school, a few churches, one block of shops, and a couple of eating establishments. According to the man in the bar, the town got started because of the locks that had been built around town.
The Library was pretty small too, but it bursted with pride. About 1,800 square feet in size, it was overflowing with books and videos. There were a couple of comfy chairs for adults, a small table, a set of four computers to do Internet things, and at least a few clocks the wall. They were very proud of the fact that they had become an Evergreen library as a part Evergreen Indiana initiative. “Now is is possible to see what is owned in other, nearby libraries, and borrow things from them as well,” said the Library’s Board Director.
The presentation itself was not held in the Library but in a nearby church. About fifty (50) people attended. We sat in the pews and contemplated the symbolism of the stained glass windows and wondered how the various hardware placed around the alter was going to be incorporated into the presentation.
Full of smiles and joviality, Michael Hart appeared in a tailless tuxedo, cumber bun, and top hat. “I am now going to pull a library out of my hat,” he proclaimed, and proceeded to withdraw a memory chip. “This chip contains 10’s of thousands of books, and now I’m going to pull a million books out of my pocket,” and he proceed to display a USB drive. Before the year 2020 he sees us capable of carrying around a billion books on some sort of portable device. Such was the essence of his presentation — computer technology enables the distribution and acquisition of “books” in ways never before possible. Through this technology he wants to change the world. “I consider myself to be like Johnny Appleseed, and I’m spreading the word,” at which time I raised my hand and told him Johnny Appleseed (John Chapman) was buried just up the road in Fort Wayne.
Mr. Hart displayed and described a lot of antique hardware. A hard drive that must have weighed fifty (50) pounds. Calculators. Portable computers. Etc. He illustrated how storage mediums were getting smaller and smaller while being able to save more and more data. He was interested in the packaging of data and displayed a memory chip a person can buy from Walmart containing “all of the hit songs from the 50’s and 60’s”. (I wonder how the copyright issues around that one had been addressed.) “The same thing,” he said, “could be done for books but there is something wrong with the economics and the publishing industry.”
 Roanoke (Indiana) |
 public library |
He outlined how Project Gutenberg works. First a book is identified as a possible candidate for the collection. Second, the legalities of the making the book available are explored. Next, a suitable edition of the book is located. Fourth, the book’s content is transcribed or scanned. Finally, 100’s of people proof-read the result and ultimately make it available. Hart advocated getting the book out sooner rather than later. “It does not have to be perfect, and we can always the fix errors later.”
He described how the first Project Gutenberg item came into existence. In a very round-about and haphazard way, he enrolled in college. Early on he gravitated towards the computer room because it was air conditioned. Through observation he learned how to use the computer, and to do his part in making the expense of the computer worthwhile, he typed out the United States Declaration of the Independence on July 4th, 1971.
“Typing the books is fun,” he said. “It provides a means for reading in ways you had never read them before. It is much more rewarding than scanning.” As a person who recently learned how to bind books and as a person who enjoys writing in books, I asked Mr. Hart to compare & contrast ebooks, electronic texts, and codexes. “The things Project Gutenberg creates are electronic texts, not ebooks. They are small, portable, easily copyable, and readable by any device. If you can’t read a plain text document on your computer, then you have much bigger problems. Moreover, there is an enormous cost-benefit compared to printed books. Electronic texts are cheap.” Unfortunately, he never really answered the question. Maybe I should have phrased it differently and asked him, the way Paul did, to compare the experience of reading physical books and electronic texts. “I don’t care if it looks like a book. Electronic texts allow me to do more reading.”
“Two people invented open source. Me and Richard Stallman,” he said. Well, I don’t think this is exactly true. Rather, Richard Stahlman invented the concept of GNU software, and Michael Hart may have invented the concept of open access publishing. But the subtle differences between open source software and open access publishing are lost on most people. In both cases the content is “free”. I guess I’m too close to the situation. I too see open source software distribution and open access publishing having more things in common than differences.
 church |
 stained glass |
“I knew Project Gutenberg was going to be success when I was talking on the telephone with a representative of the Common Knowledge project and heard a loud crash on the other end of the line. It turns out the representative’s son and friends had broken an annorandak chair while clamoring to read an electronic text.” In any case, he was fanatically passionate about giving away electronic texts. He sited the World eBook Fair, and came to the presentation with plenty of CD’s for distribution.
In the end I had my picture taken with Mr. Hart. We then all retired to the basement for punch and cake where we sang Happy Birthday to Michael. Two birthdays celebrated at the same time.
 Michael and Eric |
Many people are drawn to the library profession as a matter of principle. Service to others. Academic freedom. Preservation of the historical record. I must admit that I am very much the same way. I was drawn to librarianship for two reasons. First, as a person with a BA in philosophy, I saw libraries as a places full of ideas, literally. Second, I saw the profession as a growth industry because computers could be used to disseminate the content of books. In many ways my gut feelings were accurate, but at the same time they were misguided because much of librarianship surrounds workflows, processes that are only a couple of steps away from factory work, and the curation of physical items. To me, just like Mr. Hart, the physical item is not as important as what it manifests. It is not about the book. Rather, it is what is inside the book. Us librarians have tied our identities to the physical book in such a way to be limiting. We have pegged ourselves, portrayed a short-sighted vision, and consequently painted ourselves into a corner. It the carpenter a hammer expert? Is the surgeon a scalpel technician? No, they are builders and healers, respectively. Why must librarianship be identified with books?
I have benefited from Mr. Hart’s work. My Alex Catalogue of Electronic Texts contains many Project Gutenberg texts. Unlike the books from the Internet Archive, the texts are much more amenable to digital humanities computing techniques because they have been transcribed by humans and not scanned by computers. At the same time, the Project Gutenberg texts are not formatted as well for printing or screen display as PDF versions of the same. This is why the use of electronic texts and ebooks is not an either/or situation but rather a both/and, especially when it comes to analysis. Read a well-printed book. Identify item of interest. Locate item in electronic version of book. Do analysis. Return to printed book. The process could work just as well the other way around. Ask a question of the electronic text. Get one or more answers. Examine them in the context of the printed word. Both/and, not either/or.
The company was great, and the presentation was inspiring. I applaud Michael Hart for his vision and seemingly undying enthusiasm. His talk made me feel like I really am on the right track, but change takes time. The free distribution of data and information — whether the meaning of free be denoted as liberty or gratis — is the right thing to do for society in general. We all benefit, and therefore the individual benefits as well. The political “realities” of the situation are more like choices and not Platonic truths. They represent immediate objectives as opposed to long-term strategic goals. I guess this is what you get when you mix the corporeal and ideal natures of humanity.
Who would have known that a trip to Roanoke would turn out to be a reflection of what it means to be human.
2010-03-07T21:54:18+00:00 Mini-musings: Preservationists have the most challenging job http://infomotions.com/blog/2010/01/preservationists-have-the-most-challenging-job/In the field of librarianship, I think the preservationists have the most challenging job because it is fraught with the greatest number of unknowns.
 mangled book |
As I am writing this posting, I am in the middle of an annual processes — archiving the data I created from the previous year. This is something I have been doing since 1986. It began by putting my writings on 3.5 inch “floppy” disks. After a few years, CDs became more feasible, and I have been using them ever since. The first few CDs contain multiple years’ worth of content. This year I will require 14 CDs, and considering the fact that I create duplicates of every CD, this year I will burn 28. It goes with too much saying, this process takes a long time.
Now, I’m not quite a prolific a writer as 28 CDs sound, but the type of content I archive is large and diverse. It begins with my email which I have been systematically collecting since 1997. (“Can you say, ‘Mr. Serials’?”) No, I do not have all of my email, just the email I think is important; email of a significant nature where I actually say something, or somebody actually says something to me. It includes some attachments in the form of PDF documents and image files. It includes, inquiries I get regarding my work and postings to mailing lists that are longer rather than shorter. By the way, I only send plain text email messages because MIME encodings — the process used to include other than plain text content — adds an extra layer of complexity when it comes to reading and parsing email (mbox) archives. How can I be sure future digital archeologists will be able to compute against such stuff? Likewise, nothing gets tape archived (“tarred”), and nothing gets compressed (“zipped”) for all for the same reasons — an extra layer of complexity. Since I am the “owner” of the Code4Lib, NGC4Lib, and Usability4Lib mailing lists, and since was used to be the official archivist for ACQNET, I systematically collect, organize, archive, index, and provide access to these mailing lists using Mr. Serials. Burning the raw (mbox) email files of these lists as well as their browsable HTML counterparts is a part of my annual email preservation process.
The proces continues with the various types of other writings. Each presentation I give has its own folder complete with invitation, logistics, bio & abstract, as well three versions of my presentation: 1) a plain-text version, a one-page handout in the form of a PDF file, and a Word document. (Ick!) If I’m lucky I will remember to archive the TEI version of my remarks which is always longer than one page long and lives in the Musings section of Infomotions. Other types of writings include the plain text versions of blog postings, various versions of essays for publication, etc. At the very least, everything is saved as plain text. Not Word. Not PDF. Not anything that is platform or software-title specific. Otherwise I can’t guarantee it will be readable into the next decade. I figure that if someone can’t read a plain text file, then they have much bigger problems.
Then there is the software. I write lots of software over the period of one year. At least a couple dozen programs. Some of them are simple hacks. Some of them are “studies”, experiments, or investigations. Some of them are extensive intermediaries between relational databases and people using Web browsers. While many of these programs come to me in bursts of creative energy, I would not have the ability to recreate them if they were lost and gone to Big Byte Heaven. When it comes to computers, your data is your most important assest. Not the hardware. Not the software. The data — the content you create. This is the content you can not get back again. This is the content that is unique. This is the content that needs to be backed up and saved against future calamity.
Because some of my data is saved in relational databases, the annual preservation process includes raw database dumps. Again, these are plain text files but in the form of SQL statements. Thank God for mysqldump. It gives me the opportunity to restore my Musings, my blog, my Alex Catalogue, my water collection, and now my Highlights & Annotations. (More on that later.)
 Biblioteca Valenciana |
All of the content above fits on a single CD. Easily. Again, I’m not that prolific of a writer.
The hard part is the multimedia. As a part of an Apple Library of Tomorrow grant awarded to me by Steve Cisler, I was given an Apple QuickTake camera in 1994 or so. It could store about 24 pictures in 256 colors. It broke when my wife accidentally dropped it into a pond. It still works, if you have the necessary Macintosh hardware and it is plugged in. Presently, I use a 5 megapixel camera. I take the pictures at the highest resolution. I take movies as well. The pictures get edited. The movies get edited as well. This content currently makes up the bulk of the CDs. Six for the movies saved in the Apple movie (.mov) format. One DVD for actual use. Three for the full-scale JPEG images. Three for the iPhoto CDs. While I feel confident the JPEG files will be readable into the future, I’m not so sure about the .mov files, let alone the DVD. I might feel better about some sort of MPEG format, but it seems to be continually changing. Similarly, I suppose I ought to be saving the JPEG files as PNG files. At least that way more of the metadata may be traveling along with the images. For even better preservation, I ought to be putting the movies on video tape. (There is no compression or encryption there). I ought to be printing the photographs on glossy paper and binding the whole lot into books.
This year I started saving my music. I’ve been recording myself playing guitar since 1984. It began with audio cassette tapes. I have about 30 of them labeled and stored away in plastic boxes. I’ve made a couple attempts to digitize them, but the process is very laborious. It is easier to record yourself digitally in the first place and save the resulting files. This year a rooted through my archives and found a number of recordings. Tests of new recording gear and software. Experiments in production techniques. Background music to home videos. Saved as AIFF files, I hope they will be readable in the future.
Once everything gets burnt to CDs, one copy becomes my working copy. The other copy goes to a CD case not to be touched. Soon I will need a new case.
Finally, everything is not digital. In fact, I print a lot. Print that thought-provoking email message. Print that essay. Print this blog posting. Print the code to that computer program. Sign and date the print out. Put it into the archival box. The number of boxes I’m accumulating is now up to about 10.
What can I say. I enjoy all aspects of librarianship.
My world of (digital) preservation is miniscule compared to work of academic preservationists, archivists, and curators. If it takes this much effort to systematically collect, organize, and archive one person’s content, then think how much effort would be required to apply the process against the intellectual output of an entire college or university!
 U of MN Archive |
Even if so much people-power were available, this is no insurance against the future. How do we go about preserving digital content? What formats should the content be manifested in? What hardware will be needed to read the media where the data is saved? What software will be necessary to read the data? Too many questions. Too many unknowns. Too many things that are unpredictable. Right now, there only seems to be two solutions, and the real solution is probably a combination of the two. First, make sincere efforts to copy non-proprietary formats of content to physical media — a storage artifact that can be read by the widest variety of computer hardware. Plan on migrating the content as well as the physical media forward as technology changes. Think this process as an a type of insurance. Second, make as many copies of the content as possible in as many formats as possible. Print it. Microfilm it. Put it on tape and spinning disks. Make it available on the Web. While the folks at LOCKSS may not have thought the expression would be used in this manner, it is still true — “Lot’s of copies keep stuff safe.”
I sincerely believe we are in the process of creating a Digital Dark Age. “No, you can not read or access that content. It was created during the late 20th and early 21st centuries. It was a time of prolific exploration, few standards, and many legal barriers.” Something needs to happen differently.
Maybe it doesn’t really matter. Maybe the content that is needed is the content that always lives on “spinning disks” and gets automatically migrated forward. Computers make it easier to create lots of junk. It certainly doesn’t all need to be preserved. On the other hand, those letters from the American Civil War were not necessarily considered important at the time. Many of them were written by unknown people. Yet, these letters are important to us today. Not because of who wrote them, but because they reflect the thinking of the time. They provide pieces of a puzzle that can verify facts or provide alternative perspectives. After years and years, information can grow in importance, and consequently, today, we run the risk of throwing away stuff this is of importance tomorrow.
Preservationists have the hardest job in the field of librarianship. More power to them.
2010-01-03T22:11:51+00:00 Mini-musings: How to make a book (#2 of 3) http://infomotions.com/blog/2010/01/how-to-make-a-book-2-of-3/This is the second of a three-part series on how to make a book.
The first posting described and illustrated how to use a thermo-binding machine to make a book. This posting describes and illustrates how to “weave” a book together — folding and cutting (or tearing). The process requires no tools. No glue. No sewing. Just paper. Ingenious. The third posting will be about traditional bookmaking.
Like so many things in my life, I learned how to do this by reading a… book, but alas, I have misplaced this particular book and I am unable to provide you with a title/citation. (Pretty bad for a librarian!) In any event, the author of the book explained her love of bookmaking. She described her husband as an engineer who thought all of the traditional cutting, gluing, and sewing were unnecessary. She challenged him to create something better. The result was the technique described below. While what he created was not necessarily “better”, it surely showed ingenuity.
Here is process outlined, but you can also see how it is done on YouTube:
The result of your labors should be a fully-functional book complete with 48 pages. I use them for temporary projects — notebooks. Yeah, the cover is not very strong. During the use of your book, put the whole thing in a manila or leather folder. Lastly, I know the process is difficult to understand without pictures. Watch the video.
2010-01-01T16:20:22+00:00 Mini-musings: Good and best open source software http://infomotions.com/blog/2009/12/good-and-best-open-source-software/What qualities and characteristics make for a “good” piece of open source software? And once that question is answered, then what pieces of library-related open source software can be considered “best”?
I do not believe there is any single, most important characteristic of open source software that qualifies it to be denoted as “best”. Instead, a number of characteristics need to be considered. For example, a program might do one thing and do it well, but if it is bear to install then that counts against it. Similarly, some software might work wonders but it is built on a proprietary infrastructure such as a closed source compiler. Can that software really be considered “open”?
For my own education and cogitation, I have begun to list questions to help me address what I think is the “best” library-related open source software. Your comments would be greatly appreciated. I have listed the questions in (more or less) priority order:
What sorts of things have I left out? Is there anything here that can be measurable or is everything left to subjective judgement? Just as importantly, can we as a community answer these questions in the list of specific software distributions to come up with the “best” of class?
‘More questions than answers.
2009-12-28T17:29:30+00:00 Mini-musings: Valencia and Madrid: A Travelogue http://infomotions.com/blog/2009/12/valencia-and-madrid-a-travelogue/I recently had the opportunity to visit Valencia and Madrid (Spain) to share some of my ideas about librarianship. This posting describes some of things I saw and learned along the way.
 La Capilla de San Francisco de Borja |
 Capilla del Santo Cáliz |
In Valencia I was honored to give the opening remarks at the 4th International LIS-EPI Meeting. Hosted by the Universidad Politécnica de Valencia and organized by Fernanda Mancebo as well as Antonia Ferrer, the Meeting provided an opportunity for librarians to come together and share their experiences in relation to computer technology. My presentation, “A few possibilities for librarianship by 2015” outlined a few near-term futures for the profession. From the introduction:
The library profession is at a cross roads. Computer technology coupled with the Internet have changed the way content is created, maintained, evaluated, and distributed. While the core principles of librarianship (collection, organization, preservation, and dissemination) are still very much apropos to the current milieu, the exact tasks of the profession are not as necessary as they once were. What is a librarian to do? In my opinion, there are three choices: 1) creating services against content as opposed to simply providing access to it, 2) curating collections that are unique to our local institutions, or 3) providing sets of services that are a combination of #1 and #2.
And from the conclusion:
If libraries are representing a smaller and smaller role in the existing information universe, then two choice present themselves. First, the profession can accept this fact, extend it out to its logical conclusion, and see that libraries will eventually play in insignificant role in society. Libraries will not be libraries at all but more like purchasing agents and middle men. Alternatively, we can embrace the changes in our environment, learn how to take advantage of them, exploit them, and change the direction of the profession. This second choice requires a period of transition and change. It requires resources spent against innovation and experimentation with the understanding that innovation and experimentation more often generate failures as opposed to successes. The second option carries with it greater risk but also greater rewards.
 toro |
 robot sculpture |
Providing a similar but different vision from my own, Josef Hergert (University of Applied Sciences HTW Chur) described how librarianship ought to be embracing Web 2.0 techniques in a presentation called “Learning and Working in Time of Web 2.0: Reconstructing Information and Knowledge”. To say Hergert was advocating information literacy would be to over-simplify his remarks, yet if you broaden the definition of information literacy to include the use of blogs, wikis, social bookmarking sites — Web 2.0 technologies — then the phrase information literacy is right on target. A number of notable quotes included:
As an aside, I have been using networked computer technologies for more than twenty years. Throughout that time a number of truisms have become apparent. “If you don’t want it copied, then don’t put it on the ‘Net; give back to the ‘Net”, “On the Internet nobody knows that you are a dog”, and “It is like trying to drink from a fire hose” are just a few. Hergert used the newest one, “If it is not on the Internet, then it doesn’t exist.” For better or for worse, I think this is true. Convenience is a very powerful elixer. The ease of acquiring networked data and information is so great compared the time and energy needed to get data and information in analog format that people will get what is simple “good enough”. In order to remain relevant, libraries must put their (full text) content on the ‘Net or be seen as an impediment to learning as opposed to learning’s facilitator.
While I would have enjoyed learning what the other Meeting presenters has to say, it was unrealistic for me to attend the balance of the conference. The translators were going back to Switzerland, and I would not have been able to understand what the presenters were saying. In this regard is sort of felt like the Ugly American, but I have come to realize that the use of English is a purely practical matter. It as nothing to do with a desire to understand American culture.
The next day I have a few others had the extraordinary opportunity to get an inside tour of the Bibliteca Valenciana (Valencia Library). Starting out as a monastery, it was transformed into quite a number of other things, such as a prison, before it became a library. We got to go into the archives, see of of their treasures, and learn about the library’s history. They were very proud of their Don Quixote collection, and we saw their oldest book — a treatise on the Black Death which included receipts for treatments.
In Madrid I believe visited the Biblioteca Nacional de España (National Library of Spain) and went to their museum. It was free, and I saw an exhibition of original Copernicus, Galileo, Brahe, Kepler, and Newton editions embodying Western scientific progress. Very impressive, and very well done, especially considering the admission fee.
 Biblioteca Nacional |
 statue |
Finally, I shared the presentation from the LIS-EPI Meeting at the International Institute. While I advocated changes in the way’s our profession do its work, the attendees at both venues wondered how to about these changes. “We are expected to provide a certain set of services to our patrons here and now. What do we do to learn these new skills?” My answer was grounded in applied research & development. Time must be spent experimenting and “playing” with the new technologies. This should be considered an investment in the profession and its personnel, an investment that will pay off later in new skills and greater flexibility. We work in academia. It behooves us to work academically. This includes explorations into applying our knowledge in new and different ways.
Many thanks go to many people for making this professional adventure possible. I am indebted to Monica Pareja from the United Stated Embassy in Madrid. She kept me out of trouble. I thank Fernanda Mancebo and Antonia Ferrer who invited me to the Meeting. Last and certainly not least, I thank my family for allowing to to go to Spain in the first place since the event happened over the Thanksgiving holiday. “Thank you, one and all.”
 alley |
 fountain |
On November 14-16, 2009 I attended the 4th Annual Chicago Colloquium on Digital Humanities and Computer Science at the Illinois Institute of Technology in Chicago. This posting outlines my experiences there, but in a phrase, I found the event to be very stimulating. In my opinion, libraries ought to be embracing the techniques described here and integrating them into their collections and services.
 IIT |
 Paul Galvin Library |
Upon arrival I made my way directly to a pre-conference workshop entitled “Machine Learning, Sequence Alignment, and Topic Modeling at ARTFUL” presented by Mark Olsen and Clovis Gladstone. In the workshop they described at least two applications they were using to discover common phrases between texts. The first was called Philomine and the second was called Text::Pair. Both work similarly but Philomine needs to be integrated with Philologic, and Text::Pair is a stand-alone Perl module. Using these tools n-grams are extracted from texts, indexed to the file system, and await searching. By entering phrases into a local search engine, hits are returned that include the phrases and the works where the phrase was found. I believe Text::Pair could be successfully integrated in my Alex Catalogue.
 orange, green, and gray |
 orange and green |
The Colloquium formally began the next day with an introduction by Russell Betts (Illinois Institute of Chicago). His most notable quote was, “We have infinite computer power at our fingertips, and without much thought you can create an infinite amount of nonsense.” Too true.
Marco Büchler (University of Leipzig) demonstrated textual reuse techniques in a presentation called “Citation Detection and Textual Reuse on Ancient Greek Texts”. More specifically, he used textual reuse to highlight differences between texts, graph ancient history, and explore computer science algorithms. Try www.eaqua.net for more.
Patrick Juola‘s (Duquesne University) “conjecturator” was the heart of the next presentation called “Mapping Genre Spaces via Random Conjectures”. In short, Juola generated thousands and thousands of “facts” in the form of [subject1] uses [subject2] more or less than [subject3]. He then tested each of these facts for truth against a corpus. Ironically, he was doing much of what Betts alluded to in the introduction — creating nonsense. On the other hand, the approach was innovative.
By exploiting a parts-of-speech (POS) parser, Devin Griffiths (Rutgers University) sought the use of analogies as described in “On the Origin of Theories: The Semantic Analysis of Analogy in Scientific Corpus”. Assuming that an analogy can be defined as a noun-verb-noun-conjunction-noun-verb-noun phrase, Griffith looked for analogies in Darwin’s Origin of Species, graphed the number of analogies against locations in the text, and made conclusions accordingly. He asserted that the use of analogy was very important during the Victorian Age, and he tried to demonstrate this assertion through a digital humanities approach.
The use of LSIDs (large screen information displays) was discussed by Geoffrey Rockwell (McMaster University). While I did not take a whole lot of notes from this presentation, I did get a couple of ideas: 1) figure out a way for a person to “step into” a book, or 2) display a graphic representation of a text on a planetarium ceiling. Hmm…
Kurt Fendt (MIT) described a number of ways timelines could be used in the humanities in his presentation called “New Insights: Dynamic Timelines in Digital Humanities”. Through the process I became aware of the SIMILE timeline application/widget. Very nice.
I learned of the existence of a number of digital humanities grants as described by Michael Hall (NEH). They are both start-up grants as well a grants on advanced topics. See: neh.gov/odh/.
The first keynote speech, “Humanities as Information Sciences”, was given by Vasant Honavar (Iowa State University) in the afternoon. Honavar began with a brief history of thinking and philosophy, which he believes lead to computer science. “The heart of information processing is taking one string and transforming it into another.” (Again, think the introductory remarks.) He advocated the creation of symbols, feeding them into a processor, and coming up with solutions out the other end. Language, he posited, is an information-rich artifact and therefore something that can be analyzed with computing techniques. I liked how he compared science with the humanities. Science observes physical objects, and the humanities observe human creations. Honavar was a bit arscient, and therefore someone to be admired.
 subway tunnel |
 skyscraper predecessor |
In “Computational Phonostylistics: Computing the Sounds of Poetry” Marc Plamondon (Nipissing University) described how he was counting phonemes in both Tennyson’s and Browning’s poetry to validate whether or not Tennyson’s poetry is “musical” or plosive sounding and Browning’s poetry is “harsh” or fricative. To do this he assumed one set of characters are soft and another set are hard. He then counted the number of times each of these sets of characters existed in each of the respective poets’ works. The result was a graph illustrating the “musical” or “harshness” of the poetry. One of the more interesting quotes from Plamondon’s presentation included, “I am interested in quantifying aesthetics.”
In C.W. Forstal‘s (SUNY Buffalo) presentation “Features from Frequency: Authorship and Stylistic Analysis Using Repetitive Sound” we learned how he too is counting sound n-grams to denote style. He applied the technique to D.H. Lawrence as well as to the Iliad and Odyssey, and to his mind the technique works to his satisfaction.
The second keynote presentation was give by Stephen Wolfram (Wolfram Research) via teleconference. It was called “What Can Be Made Computable in the Humanities?” He began by describing Mathematica as a tool he used to explore the world around him. All of this assumes that the world consists of patterns, and these patterns can be described through the use of numbers. He elaborated through something he called the Principle of Computational Equivalency — once you get to a certain threshold systems create a level of complexity. Such a principle puts pressure on having the simplest descriptive model as possible. (Such things are standard scientific/philosophic principles. Nothing new here.) Looking for patterns was the name of his game, and one such game was applied to music. Discover the patterns in a type of music. Feed the patterns to a computer. Have the computer generate the music. Most of the time the output works pretty well. He called this WolframTones. He went on to describe WolframAlpha as an attempt to make the world’s knowledge computable. Essentially a front-end to Mathematica, WolframAlpha is a vast collection of content associated with numbers: people and their birth dates, the agriculture output of countries, the price of gold over time, temperatures from across the world, etc. Queries are accepted into the system. Searches are done against its content. Results are returned in the form of best-guess answers complete with graphs and charts. WolframAlpha exposes mathematical processing to the general public in ways that have not been done previously. Wolfram described two particular challenges in the creation of WolframAlpha. One was the collection of content. Unlike Google, Wolfram Research does not necessarily crawl the Internet. Rather it selectively collects the content of a “reference library” and integrates it into the system. Second, and more challenging, has been the design of the user interface. People do not enter structured queries, but structured output is expected. Interpreting people’s input is a difficult task in and of itself. From my point of view, he is probably learning more about human thought processes than the natural world.
 red girder sculpture |
 gray sculpture |
This meeting was worth every single penny, especially considering the fact that there was absolutely no registration fee. Free, except of the my travel costs, hotel, and the price of the banquet. Unbelievable!
Just as importantly, the presentations given at this meeting demonstrate the maturity of the digital humanities. These things are not just toys but practical tools for evaluating (mostly) texts. Given the increasing amount of full text available in library collections, I see very little reason why these sorts of digital humanities applications could not be incorporate into library collections and services. Collect full text content. Index it. Provide access to the index. Get back a set of search results. Select one or more items. Read them. Select one or more items again, and then select an option such as graph analogies, graph phonemes, or list common phrases between texts. People need to do more than read the texts. People need to use the texts, to analyze them, to compare & contrast them with other texts. The tools described in this conference demonstrate that such things are more than possible. All that has to be done is to integrate them into our current (library) systems.
So many opportunities. So little time.
 Map it |
 Map it |
This page lists the guidelines for including texts in the Alex Catalogue of Electronic Texts. Originally written in 1994, much of it is still valid today.
The primary purpose of the Catalogue is to provide me with the means for demonstrating a concept I call arscience through American and English literature as well as Western philosophy. The secondary purpose of the Catalogue is to provide value-added access to some of the world’s great literature in turn providing the means for enhancing education. Consequently, the items in the collection must satisfy either of these two goals.
Listed in priority order, texts in the collection must have the following qualities:
Because of technical limitations and the potential long-term integrity of the Catalogue, texts in the collection, listed in order of preference, should have the following formats:
In all cases, text that have not been divided into parts are preferred over texts that have been divided. If a particular item is deemed especially valuable and the item has been divided into parts, then efforts will be made to concatenate the individual parts and incorporate the result into the collection. The items in the collection are not necessarily intended to be read online.
Created circa 1998, this movie describes the purpose and scope of the Alex Catalogue of Electronic Texts. While coming off rather pompous, the gist of what gets said is still valid and correct. Heck, the links even work. “Thanks Berkeley!”
2009-10-04T12:58:48+00:00 Mini-musings: Collecting water and putting it on the Web (Part III of III) http://infomotions.com/blog/2009/09/water-3-of-3/This is Part III of an essay about my water collection, specifically a summary, opportunities for future study, and links to the source code. Part I described the collection’s whys and hows. Part II described the process of putting it on the Web.
There is no doubt about it. My water collection is eccentric but through my life time I have encountered four other people who also collect water. At least I am not alone.
Putting the collection on the Web is a great study in current technology. It includes relational database design. Doing input/output against the database through a programming language. Exploiting the “extensible” in XML by creating my own mark-up language. Using XSLT to transform the XML for various purposes: display as well as simple transformation. Literally putting the water collection on the map. Undoubtably technology will change, but the technology of my water collection is a representative reflection of the current use of computers to make things available on the Web.
I have made all the software a part of this system available here:
My water also embodies characteristics of librarianship. Collection. Acquisition. Preservation. Organization. Dissemination. The only difference is that the content is not bibliographic in nature.
There are many ways access to the collection could be improved. It would be nice to sort by date. It would be nice to index the content and make the collection searchable. I have given thought to transforming the WaterML into FO (Formatting Objects) and feeding the FO to a PDF processor like FOP. This could give me a printed version of the collection complete with high resolution images. I could transform the WaterML into an XML file usable by Google Earth providing another way to view the collection. All of these things are “left up the reader for further study”. Software is never done, nor are library collections.
 River Lune |
 Roman Bath |
 Ogle Lake |
Finally, again, why do I do this? Why do I collect the water? Why have a spent so much time creating a system for providing access to the collection? Ironically, I am unable to answer succinctly. It has something to do with creativity. It has something to do with “arsience“. It has something to do with my passion for the library profession and my ability to manifest it through computers. It has something to do with the medium of my art. It has something to do with my desire to share and expand the sphere of knowledge. “Idea. To be an idea. To be an idea and an example to others… Idea”. I really don’t understand it through and through.
Read all the posts in this series:
Visit the water collection.
2009-09-03T14:25:29+00:00 Mini-musings: Collecting water and putting it on the Web (Part II of III) http://infomotions.com/blog/2009/09/water-2-of-3/This is Part II of an essay about my water collection, specifically the process of putting it on the Web. Part I describes the whys and hows of the collection. Part III is a summary, provides opportunities for future study, and links to the source code.
As a librarian, I am interested in providing access to my collection(s). As a librarian who has the ability to exploit the use of computers, I am especially interested in putting my collection(s) on the Web. Unfortunately, the process is not as easy as the actual collection process, and there have been a number of processes along the way. When I was really into HyperCard I created a “stack” complete with pictures of my water, short descriptions, and an automatic slide show feature that played the sound of running water in the background. (If somebody asks, I will dig up this dinosaur and make it available.) Later I created a Filemaker Pro database of the collection, but that wasn’t as cool as the HyperCard implementation.
 Mississippi River |
 Mississippi River |
 Mississippi River |
The current implementation is more modern. It takes advantage of quite a number of technologies, including:
The use of each of these technologies is described in the following sections.
 ER diagram |
Since 2002 I have been adding and maintaining newly acquired waters in a relational, MySQL, database. (Someday I hope to get the waters out of those cardboard boxes and add them to the database too. Someday.) The database itself is rather simple. Four tables: one for the waters, one for the collectors, a join table denoting who collected what, and a metadata table consisting of a single record describing the collection as a whole. The entity-relationship diagram illustrates the structure of the database in greater detail.
Probably the most interesting technical characteristic of the database is the image field of type mediumblob in the waters table. When it comes to digital libraries and database design, one of the perennial choices to make is where to save your content. Saving it outside your database makes your database smaller and more complicated but forces you to maintain links to your file system or the Internet where the actual content resides. This can be an ongoing maintenance nightmare and can side-step the preservation issues. On the other hand inserting your content inside the database allows you to keep your content all in once place while “marrying” it to up in your database application. Putting the content in the database also allows you to do raw database dumps making the content more portable and easier to back-up. I’ve designed digital library systems both ways. Each has its own strengths and weaknesses. This is one of the rarer times I’ve put the content into the database itself. Never have I solely relied on maintaining links to off-site content. Too risky. Instead I’ve more often mirrored content locally and maintained two links in the database: one to the local cache and another to the canonical website.
Sets of PHP scripts are used to create, maintain, and report against the waters database. Creating and maintaining database records is tedious but not difficult as long as you keep in mind that there are really only four things you need to do with any database: 1) create records, 2) find records, 3) edit records, and 4) delete records. All that is required is to implement each of these processes against each of the fields in each of the tables. Since PHP was designed for the Web, each of these processes is implemented as a Web page only accessible to myself. The following screen shots illustrate the appearance and functionality of the database maintenance process.
 Admin home |
 Admin waters |
 Edit water |
High-level menus on the right. Sub-menus and data-entry forms in the middle. Simple. One of the nice things about writing applications for oneself is the fact that you don’t have to worry about usability, just functionality.
The really exciting stuff happens when the reports are written against the database. Both of them are XML files. The first is a essentially a database dump — water.xml — complete with the collection’s over-arching metadata record, each of the waters and their metadata, and a list of collectors. The heart of the report-writing process includes:
There are two hard parts about this process. The first, “MOGRIFY”, is a shelled out hack to the operating system using an ImageMagik utility to convert the content of the image field into a thumbnail image. Without this utility saving the image from the database to the file system would be problematic. Second, the SELECT statement used to find all the collectors associated with a particular water is a bit tricky. Not really to difficult, just a typical SQL join process. Good for learning relational database design. Below is a code snippet illustrating the heart of this report-writing process:
  # process every found row
  while ($r = mysql_fetch_array($rows)) {

    # get, define, save, and convert the image -- needs error checking
    $image     = stripslashes($r['image']);
    $leafname  = explode (' ' ,$r['name']);
    $leafname  = $leafname[0] . '-' . $r['water_id'] . '.jpg';
    $original  = ORIGINALS  . '/' . $leafname;
    $thumbnail = THUMBNAILS . '/' . $leafname;
    writeReport($original, $image);
    copy($original, $thumbnail);
    system(MOGRIFY . $thumbnail);

    # initialize and build a water record
    $report .= '<water>';
    $report .= "<name water_id='$r[water_id]' lat='$r[lat]' lng='$r[lng]'>" .
               prepareString($r['name']) . '</name>';
    $report .= '<date_collected>';
    $report .= "<year>$r[year]</year>";
    $report .= "<month>$r[month]</month>";
    $report .= "<day>$r[day]</day>";
    $report .= '</date_collected>';

    # find all the COLLECTORS associated with this water, and...
    $sql = "SELECT c.*
            FROM waters AS w, collectors AS c, items_for_collectors AS i
            WHERE w.water_id   = i.water_id
            AND c.collector_id = i.collector_id
            AND w.water_id     = $r[water_id]
            ORDER BY c.last_name, c.first_name";
    $all_collectors = mysql_db_query ($gDatabase, $sql);
    checkResults();

    # ...process each one of them
    $report .= "<collectors>";
    while ($c = mysql_fetch_array($all_collectors)) {

      $report .= "<collector collector_id='$c[collector_id]'><first_name>
                 $c[first_name]</first_name>
                 <last_name>$c[last_name]</last_name></collector>";

    }
    $report .= '</collectors>';

    # finish the record
    $report .= '<description>' . stripslashes($r['description']) .
               '</description></water>';

  }
The result is the following “WaterML” XML content — a complete description of a water, in this case water from Copenhagen:
  <water>
    <name water_id='87' lat='55.6889' lng='12.5951'>Canal
      surrounding Kastellet, Copenhagen, Denmark
    </name>
    <date_collected>
      <year>2007</year>
      <month>8</month>
      <day>31</day>
    </date_collected>
    <collectors>
      <collector collector_id='5'>
        <first_name>Eric</first_name>
        <last_name>Morgan</last_name>
    </collector>
    </collectors>
    <description>I had the opportunity to participate in the
      Ticer Digital Library School in Tilburg, The Netherlands.
      While I was there I also had the opportunity to visit the
      folks at
      <a href="http://indexdata.com">Index Data</a>, a company
      that writes and supports open source software for libraries.
      After my visit I toured around Copenhagen very quickly. I
      made it to the castle (Kastellet), but my camera had run out
      of batteries. The entire Tilburg, Copenhagen, Amsterdam
      adventure was quite informative.
    </description>
  </water>
When I first created this version of the water collection RSS was just coming on line. Consequently I wrote an RSS feed for the water, but then I got realistic. How many people want to get an RSS feed of my water. Crazy?!
Now that the XML file has been created an the images are saved to the file system, the next step is to make a browser-based interface. This is done though an XSLT style sheet and XSL processor called Apache2::TomKit.
Apache2::TomKit is probably the most eclectic component of my online water collection application. Designed to be a replacement for another XSL processor called AxKit, Apache2::TomKit enables the developer to create CGI-like applications, complete with HTTP GET parameters, in the form of XML/XSLT combinations. Specify the location of your XML files. Denote what XSLT files to use. Configure what XSLT processor to use. (I use LibXSLT.) Define an optional cache location. Done. The result is on-the-fly XSL transformations that work just like CGI scripts. The hard part is writing the XSLT.
The logic of my XSLT style sheet — waters.xsl — goes like this:
Of all the XSLT style sheets I’ve written in my career, waters.xsl is definitely the most declarative in nature. This is probably because the waters.xml file is really data driven as opposed mixed content. The XSLT file is very elegant but challenging for the typical Perl or PHP hacker to quickly grasp.
Once the integration of the XML file, the XSLT style sheet, and Apache2::TomKit is complete, I was able to design URL’s such as the following:
Okay. So its not very REST-ful; the URLs are not very “cool”. Sue me. I originally designed this in 2002.
In 2006 I used my water collection to create my first mash-up. It combined latitudes and longitudes with the Google Maps API.
Inserting maps into your Web pages via the Google API is a three-step process: 1) create an XML file containing latitudes and longitudes, 2) insert a call to the Google Maps javascript into the head of your HTML, and 3) call the javascript from within the body of your HTML.
For me, all I had to do was: 1) create new fields in my database for latitudes and longitudes, 2) go through each record in the database doing latitude and longitude data-entry, 3) write a WaterML file, 4) write an XSLT file transforming the WaterML into an XML file expected of Google Maps, 5) write a CGI script that takes latitudes and longitudes as input, 6) display a map, and 7) create links from my browser-based interface to the maps.
It may sound like a lot of steps, but it is all very logical, and taken bit by bit is relatively easy. Consequently, I am able to display a world map complete with pointers to all of my water. Conversely, I am able to display a water record and link its location to a map. The following two screen dumps illustrate the idea, and I try to get as close to the actual collection point as possible:
 World map |
 Single water |
Read all the posts in this series:
Visit the water collection.
2009-09-03T14:25:16+00:00 Mini-musings: Collecting water and putting it on the Web (Part I of III) http://infomotions.com/blog/2009/09/water-1-of-3/This is Part I of an essay about my water collection, specifically the whys and hows of it. Part II describes the process of putting the collection on the Web. Part III is a summary, provides opportunities for future study, and links to the source code.
It may sound strange, but I have been collecting water since 1978, and to date I believe I have around 200 bottles containing water from all over the world. Most of the water I’ve collected myself, but much of it has also been collected by friends and relatives.
The collection began the summer after I graduated from high school. One of my best friends, Marlin Miller, decided to take me to Ocean City (Maryland) since I had never seen the ocean. We arrived around 2:30 in the morning, and my first impression was the sound. I didn’t see the ocean. I just heard it, and it was loud. The next day I purchased a partially melted glass bottle for 59¢ and put some water, sand, and air inside. I was going keep some of the ocean so I could experience it anytime I desired. (Actually, I believe my first water is/was from the Pacific Ocean, collected by a girl named Cindy Bleacher. She visited there in the late Spring of ’78, and I asked her to bring some back so I could see it too. She did.) That is how the collection got started.
 Cape Cod Bay |
 Robins Bay |
 Gulf of Mexico |
The impetus behind the collection was reinforced in college — Bethany College (Bethany, WV). As a philosophy major I learned about the history of Western ideas. That included Heraclitus who believed the only constant was change, and water was the essencial element of the universe. These ideas were elaborated upon by other philosophers who thought there was not one essencial element, but four: earth, water, air, and fire. I felt like I was on to something, and whenever I heard of somebody going abroad I asked them bring me back some water. Burton Thurston, a Bethany professor, went to the Middle East on a diplomatic mission. He brought back Nile River water and water from the Red Sea. I could almost see Moses floating in his basket and escaping from the Egyptians.
The collection grew significantly in the Fall of 1982 because I went to Europe. During college many of my friends studied abroad. They didn’t do much studying as much as they did traveling. They were seeing and experiencing all of the things I was learning about through books. Great art. Great architecture. Cities whose histories go back millennia. Foreign languages, cultures, and foods. I wanted to see those things too. I wanted to make real the things I learned about in college. I saved my money from my summer peach picking job. My father cashed in a life insurance policy he had taken out on me when I was three weeks old. Living like a turtle with its house on its back, I did the back-packing thing across Europe for a mere six weeks. Along the way I collected water from the Seine at Notre Dame (Paris), the Thames (London), the Eiger Mountain (near Interlaken, Switzerland) where I almost died, the Agean Sea (Ios, Greece), and many other places. My Mediterranean Sea water from Nice is the prettiest. Because of the all the alge, the water from Venice is/was the most biologically active.
Over the subsequent years the collection has grown at a slower but regular pace. Atlantic Ocean (Myrtle Beach, South Carolina) on a day of playing hooky from work. A pond at Versailles while on my honeymoon. Holy water from the River Ganges (India). Water from Lock Ness. I’m going to grow a monster from DNA contained therein. I used to have some of a glacier from the Canadian Rockies, but it melted. I have water from Three Mile Island (Pennsylvania). It glows in the dark. Amazon River water from Peru. Water from the Missouri River where Lewis & Clarke decided it began. Etc.
Many of these waters I haven’t seen in years. Moves from one home to another have relegated them to cardboard boxes that have never been unpacked. Most assuredly some of the bottles have broken and some of the water has evaporated. Such is the life of a water collection.
 Lake Huron |
 Trg Bana Jelacica |
 Jimmy Carter Water |
Why do I collect water? I’m not quite sure. The whole body of water is the second largest thing I know. The first being the sky. Yet the natural bodies of water around the globe are finite. It would be possible to collect water from everywhere, but very difficult. Maybe I like the challenge. Collecting water is cheap, and every place has it. Water makes a great souvenir, and the collection process helps strengthen my memories. When other people collect water for me it builds between us a special relationship — a bond. That feels good.
What do I do with the water? Nothing. It just sits around my house occupying space. In my office and in the cardboard boxes in the basement. I would like to display it, but over all the bottles aren’t very pretty, and they gather dust easily. I sometimes ponder the idea of re-bottling the water into tiny vials and selling it at very expensive prices, but in the process the air would escape, and the item would lose its value. Other times I imagine pouring the water into a tub and taking a bath it it. How many people could say they bathed in the Nile River, Amazon River, Pacific Ocean, Atlantic Ocean, etc. all at the same time.
The actual process of collecting water is almost trivial. Here’s how:
Who can collect water for me? Not just anybody. I have to know you. Don’t take it personally, but remember, part of the goal is relationship building. Moreover, getting water from strangers would jeopardize the collection’s authenticity. Is this really the water they say it is? Call it a weird part of the “collection development policy”.
 Pacific Ocean |
 Rock Run |
 Salton Sea |
Read all the posts in this series:
Visit the water collection.
2009-09-03T11:23:29+00:00 Mini-musings: Web-scale discovery services http://infomotions.com/blog/2009/08/web-scale-discovery-services/Last week (Tuesday, August 18) Marshall Breeding and I participated in a webcast sponsored by Serials Solutions and Library Journal on the topic of “‘Web-scale’ discovery services”.
Our presentations complimented one another in that we both described the current library technology environment and described how the creation of amalgamated indexes of book and journal article content have the potential to improve access to library materials.
Dodie Ownes summarized the event in an article for Library Journal. From there you can also gain access to an archive of the one-hour webcast. (Free registration required.) I have made my written remarks available on the Hesburgh Libraries website as well as mirrored them locally. From the remarks:
It is quite possible the do-it-yourself creation and maintenance of an index to local book holdings, institutional repository content, and articles/etexts is not feasible. This may be true for any number of reasons. You may not have the full complement of resources to allocate, whether that be time, money, people, or skills. You and your library may have a set of priorities forcing the do-it-yourself approach lower on the to-do list. You might find yourself stuck in never-ending legal negotiations for content from “closed” access providers. You might liken the process of normalizing myriads of data formats into a single index to Hercules cleaning the Augean stables.
technical expertise
money
people with vision
energyIf this be the case, then the purchasing (read, “licensing”) of a single index service might be the next best thing — Plan B.
I sincerely believe the creation of these “Web-scale” indexes is a step in the right direction, but I believe just as strongly that the problem to be solved now-a-days does not revolve around search and discovery, but rather use and context.
“Thank you Serials Solutions and Library Journal for the opportunity to share some of my ideas.”
2009-08-27T14:25:32+00:00 Mini-musings: How to make a book (#1 of 3) http://infomotions.com/blog/2009/08/how-to-make-a-book-1-of-3/This is a series of posts where I will describe and illustrate how to make books. In this first post I will show you how to make a book with a thermo-binding machine. In the second post I will demonstrate how to make a book by simply tearing and folding paper. In the third installment, I will make a traditional book with a traditional cover and binding. The book — or more formally, the codex — is a pretty useful format for containing information.
The number of full text books found on the Web is increasing at a dramatic pace. A very large number of these books are in the public domain and freely available for downloading. While computers make it easy to pick through smaller parts of books, it is diffcult to read and understand them without printing. Once they are printed you are then empowered to write in the margins, annotate them as you see fit, and share them with your friends. On the other hand, reams of unbound paper is difficult to handle. What to do?
Enter a binding machine, specifically a thermo-binding machine like the Fellowes TB 250. This handy-dandy gizmo allows you to print bunches o’ stuff, encase it in inexpensive covers, and bind it into books. Below is an outline of the binding process and a video demonstration is also available online:
The Alex Catalogue of Electronic Texts is a collection of fulltext books brought together for the purposes of furthering a person’s liberal arts eduction. While it supports tools for finding, analyzing, and comparing texts, the items are intended to be read in book form as well. Consider printing and binding the PDF or fully transcribed versions of the texts. Your learning will be much more thorough, and you will be able to do more “active” reading.
Binding machines are cheap, and they facilitate a person’s learning by enabling users to organize their content. Maybe providing a binding service for library patrons is apropos? Make it easy for people to print things they find in a library. Make it easy for them to use some sort of binding machine. Enable them to take more control over the stuff of their learning, teaching, and research. It certainly sounds like good idea to me. After all, in this day and age, libraries aren’t so much about providing access to information as they are about making information more useful. Binding — books on demand — is just one example.
2009-08-23T21:13:55+00:00 Mini-musings: Book review of Larry McMurtry’s Books http://infomotions.com/blog/2009/08/book-review-of-larry-mcmurtrys-books/I read with interest Larry McMurtry’s Books: A Memoir (Simon & Schuster, 2008), but from my point of view, I would be lying if I said I thought the book had very much to offer.
The book’s 259 pages are divided into 109 chapters. I was able to read the whole thing in six or seven sittings. It is an easy read, but only because the book doesn’t say very much. I found the stories rarely engaging and never very deep. They were full of obscure book titles and the names of “famous” book dealers.
Much of this should not be a surprise, since the book is about one person’s fascination with books as objects, not books as containers of information and knowledge. From page 38 of my edition:
Most young dealers of the Silicon Chip Era regard a reference library as merely a waste of space. Old-timers on the West Coast, such as Peter Howard of Serendipity Books in Berkeley or Lou and Ben Weinstein of the (recently closed) Heritage Books Shop in Los Angeles, seem to retain a fondness of reference books that goes beyond the practical. Everything there is to know about a given volume may be only a click away, but there are still a few of us who’d rather have the book than the click. A bookman’s love of books is a love of books, not merely the information in them.
Herein lies the root of my real problem with the book, it shares with the reader one person’s chronology of a love of books and book selling. It describes various used bookstores and give you an idea of what it is like to be a book dealer. Unfortunately, I believe McMurtry misses the point about books. They are essentially a means to an end. A tool. A medium for the exchange of ideas. The ideas they contain and the way they contain them are the important thing. There are advantages & disadvantages to the book as a technology, and these advantages & disadvantages ought not be revered or exaggerated to dismiss the use of books or computers.
I also think McMurtry’s perception of libraries, which seems to be commonly held in and outside my profession, points to one of librarianship’s pressing issues. From page 221:
But they [computers] don’t really do what books do, and why should they usurp the chief function of a public library, which is to provide readers access to books? Books can accommodate the proximity of computers but it doesn’t seem to work the other way around. Computers now literally drive out books from the place they should, by definition, be books’ own home: the library.
Is the chief function of a public library to provide readers access to books? Are libraries defined as the “home” of books? Such a perception may have been more or less true in an environment where data, information, and knowledge were physically manifested, but in an environment where the access to information is increasingly digital the book as a thing is not as important. Books are not central to the problems to be solved.
Can computers do what books do? Yes and no. Computers can provide access to information. They make it easier to “slice and dice” their content. They make it easier to disseminate content. They make information more findable. The information therein is trivial to duplicate. On the other hand, books require very little technology. They are relatively independent of other technologies, and therefore they are much more portable. Books are easy to annotate. Just write on the text or scribble in the margin. A person can browse the contents of a book much faster than the contents of electronic text. Moreover, books are owned by their keepers, not licensed, which is increasingly the case with digitized material. There are advantages & disadvantages to both computers and books. One is not necessarily better than the other. Each has their place.
As a librarian, I had trouble with the perspectives of Larry McMurtry’s Books: A Memoir. It may be illustrative of the perspectives of book dealers, book sellers, etc., but I think the perspective misses the point. It is not so much about the book as much as it is about what the book contains and how those contents can be used. In this day and age, access to data and information abounds. This is a place where libraries increasingly have little to offer because libraries have historically played the role of middleman. Producers of information can provide direct access to their content much more efficiently than libraries. Consequently a different path for libraries needs to be explored. What does that path look like? Well, I certainly have ideas about that one, but that is a different essay.
The Alex Catalogue is browsable by author names, subject tags, and titles. Just select a browsable list, then a letter, and finally an item.
Browsability is an important feature of any library catalog. It gives you an opportunity to see what the collection contains without entering a query. It is also possible to use browsability to identify similar names, terms, or titles. “Oh look, I hadn’t thought of that idea, and look at the alternative spellings I can use.”
Creating the browsable list is rather trivial. Since all of the underlying content is saved in a relational database, it is rather easy to loop through the fields of “controlled” vocabulary terms and “authority” lists to identify matching etext titles. These lists include:
The later is probably the most interesting since it gives you an idea of the most common words and two-word phrases used in the corpus. For example, look at the list of words starting with the letter “k” and all the ways the word “kant” has been extracted from collection
2009-08-22T01:51:44+00:00 Mini-musings: Indexing and searching the Alex Catalogue http://infomotions.com/blog/2009/08/indexing-and-searching-the-alex-catalogue/The Alex Catalogue of Electronic Texts uses state-of-the-art software to index both the metadata and full text of its content. While the interface accepts complex Boolean queries, it is easier to enter a single word, a number of words, or a phrase. The underlying software will interpret what you enter and do much of hard query syntax work for you.
The Catalogue consists of a number of different types of content harvested from different repositories. Most of the content is in the form of electronic texts (“etexts” as opposed to “ebooks”). Think Project Gutenberg, but also items from a defunct gopher archive from Virginia Tech, and more recently digitized materials from the Internet Archive. All of these items benefit from metadata and full text indexing. In other words, things like title words, author names, and computer-generated subject tags are made searchable as well as the full texts of the items.
The collection is supplemented with additional materials such as open access journal titles, open access journal article titles, some content from the HaitiTrust, as well as photographs taken by myself. Presently the full text of these secondary items is not included, just metadata: titles, authors, notes, and subjects. Search results return pointers to the full texts.
Regardless of content type, all metadata and full text is managed in an underlying MyLibrary database. To make the content searchable reports are written against the database and fed to Solr/Lucene for indexing. The Solr/Lucene data structure is rather simple consisting only of a number of Dublin Core-like fields, a default search field, and three facets (creator, subject/tag, and sub-collection). From a 30,000 foot view, this is the process used to index the content of the Catalogue:
Solr/Lucene works pretty well, and interfacing with it was made much simpler through the use of a set of Perl modules called WebService::Solr. On the other hand, there are many ways the index could be improved such as implementing facilitates for sorting and adding weights to various fields. An indexer’s work is never done.
Because of people’s expectations, searching the index is a bit more complicated and not as straight-forward, but only because the interface is trying to do you some favors.
Solr/Lucene supports single-word, multiple-word, and phrase searches through the use of single or double quote marks. If multi-word queries are entered without Boolean operators, then a Boolean and is assumed.
Since people often enter multiple-word queries, and it is difficult to know whether or not they are really wanting to do a phrase search, the Alex Catalogue converts ambiguous multiple-word queries into more robust Boolean queries. For example a search for “william shakespeare” (sans the quote marks) will get converted into “(william AND shakespeare) OR ‘william shakespeare'” (again, sans the double quote marks) on behalf of the user. This is considered a feature of the Catalogue.
To some degree Solr/Lucene tokenizes query terms, and consequently searches for “book” and “books” return the same number of hits.
Search results are returned in a relevance ranked order. Some time in the future there will be the option of sorting results by date, author, title, and/or a couple of other criteria. Unlike other catalogs, Alex only has a single display — search results. There is no intermediary detailed display; the Catalogue only displays search results or the full text of the item.
In the hopes of making it easier for the user to refine their search, the results page allows the user to automatically turn queries into subject, author, or title searches. It takes advantage of a thesaurus (WordNet) to suggest alternative queries. The system returns “facets” (author names, subject tags, or material types) allowing the user to limit their query with additional terms and narrow search results. The process is not perfect and there are always ways of improving the interface. Usability is never done either.
Do not try to out think the Alex Catalogue. Enter a word or two. Refine your query using the links on the resulting page. Read & enjoy the discovered texts. Repeat.
2009-08-18T01:23:59+00:00 Readings: History of Science http://en.wikipedia.org/wiki/History_of_science This article gives a descent overview of the history of science. I am using it to refresh my memory and prepare for an exhibit I hope to do for the Libraries someday.Me and a number of colleagues from the University of Notre Dame visited folks from Ball State University and Ohio State University to see, touch, and discuss all things Microsoft Surface.
There were plenty of demonstrations surrounding music, photos, and page turners. The folks of Ball State were finishing up applications for the dedication of the new “information commons”. These applications included an exhibit of orchid photos and an interactive map. Move the scroll bar. Get a differnt map based on time. Tap locations. See pictures of buildings. What was really interesting about the later was the way it pulled photographs from the library’s digital repository through sets of Web services. A very nice piece of work. Innovative and interesting. They really took advantage of the technology as well as figured out ways to reuse and repurpose library content. They are truly practicing digital librarianship.
The information commons was nothing to sneeze at either. Plenty of television cameras, video screens, and multi-national news feeds. Just right for a school with a focus on broadcasting.
Ball State University. Hmm…
2009-08-14T19:17:21+00:00 Readings: What's needed next: A Culture of candor http://hbr.org/2009/06/a-culture-of-candor/ar/1 Discusses shared values, the expense of acting too quickly, creating transparency, speaking the truth, and, in general, sharing informationI have been having a great deal of success extracting keywords and two-word phrases from documents and assigning them as “subject headings” to electronic texts — automatic metadata generation. In many cases but not all, the set of assigned keywords I’ve created are just as good if not better as the controlled vocabulary terms assigned by librarians.
The Alex Catalogue is a collection of roughly 14,000 electronic texts. The vast majority come from Project Gutenberg. Some come from the Internet Archive. The smallest number come from a defunct etext collection of Virginia Tech. All of the documents are intended to surround the themes of American and English literature and Western philosophy.
With the exception of the non-fiction works from the Internet Archive, none of the electronic texts were associated with subject-related metadata. With the exception of author names (which are yet to be “well-controlled”), it has been difficult learn the “aboutness” of each of the documents. Such a thing is desirable for two reasons: 1) to enable the reader to evaluate the relevance of document, and 2) to provide a browsable interface to the collection. Without some sort of tags, subject headings, or application of clustering techniques, browsability is all but impossible. My goal was to solve this problem in an automated manner.
A couple of years ago I used tools such as Lingua::EN::Summarize and Open Text Summarizer to extract keywords and summaries from the etexts and assign them as subject terms. The process worked, but not extraordinarily well. I then learned about Term Frequency Inverse Document Frequency (TFIDF) to calculate “relevance”, and T-Score to calculate the probability of two words appearing side-by-side — bi-grams or two-word phrases. Applying these techniques to the etexts of the Alex Catalogue I have been able to create and add meaningful subject “tags” to each of my documents which then paves the way to browsability. Here is the algorithm I used to implement the solution:
Through this process I discovered a number of things.
First, in regards to fictional works, the words or phrases returned are often pronouns, and these were usually the names of characters from the work. An excellent example is Mark Twain’s Adventures of Huckleberry Finn whose currently assigned terms include: huck, tom, joe, injun joe, aunt polly, tom sawyer, muff potter, and injun joe’s.
Second, in regards to works of non-fiction, the words and phrases returned are also nouns, and these are objects referred to often in the etext. A good example includes John Stuart Mill’s Auguste Comte and Positivism where the assigned words are: comte, phaenomena, metaphysical, science, mankind, social, scientific, philosophy, and sciences.
Third, automatically generated keywords and phrases were many times just as useful as the librarian-assigned Library of Congress Subject headings. Many of the items harvested from the Internet Archive were complete with MARC records. Some of those records included subject headings. During Step #5 (above), I spent time observing the output and comparing it to previously assigned terms. Take for example a work called Universalism in America: A History by Richard Eddy. Its assigned headings included:
My automatically generated terms/phrases are:
Granted, the generated list is not perfect. For example, Hosea Ballou is mentioned twice, and the second was probably caused by an OCR error. On the other hand, how was a person to know that Hosea Ballou was even a part of the etext if it weren’t for this process? The same goes for the other people: Thomas Whittemore, Abner Kneeland, and Edward Turner. In defense of controlled vocabulary, the terms “church”, “sermon”, “doctrine”, and “american” could all be assumed from the (rather) hierarchal nature of LCSH, but unless a person understands the nature of LCSH such a thing is not obvious.
As a librarian I understand the power of a controlled vocabulary, but since I am not limited to three to five subject headings per entry, and because controlled vocabularies are often very specific, I have retained the LCSH in each record whenever possible. The more the merrier.
Now that the collection has richer metadata, the next steps will be to exploit it. Some of those nexts steps include:
Fun! Combining traditional librarianship with computer applications; not automating existing workflows as much as exploiting the inherent functions of a computer. Using mathematics to solve large-scale problems. Making it easier to do learning and research. It is the not what of librarianship that needs to change as much as the how.
2009-07-31T02:22:02+00:00 Readings: Linked data applications http://linkeddata.deri.ie/sites/linkeddata.deri.ie/files/lod-app-tr-2009-07-26_0.pdf Strong on history. So so on examples. Outlines what a LOD application might look like -- "We are writing the year 2009. Three years after the linked data principles have been formulated by Tim Berners-Lee and two years after the grass-root community project “Linking Open Data” has started to apply them to publicly available datasets such as Wikipedia, DBLP, and GeoNames, we are still at the very incept to understand how to use linked data in order to build Web applications and Web services. This memo outlines the current state-of-the-art, highlights (research) issues and tries to anticipate some of the future developments of linked data." I don’t exactly know how or why Google sometimes creates nice little screen shots of Web home pages, but it created one for my Alex Catalogue of Electronic Texts. I’ve seen them for other sites on the Web, and some of them even contain search boxes.
I wish I could get Google to make one of these for a greater number of my sites, and I wish I could get the Google Search Appliance to do the same. It is a nifty feature, to say the least.
2009-07-24T11:41:06+00:00 Mini-musings: Top Tech Trends for ALA Annual, Summer 2009 http://infomotions.com/blog/2009/07/top-tech-trends-for-ala-annual-summer-2009/This is a list of Top Tech Trends for the ALA Annual Meeting, Summer 2009.*
The amount of computing that gets done on our planet has a measurable carbon footprint, and many of us, myself included, do not know exactly how much heat our computers put off and how much energy they consume. With the help from some folks from the University of Notre Dame’s Center for Research Computing, I learned my laptop computer spikes at 30 watts on boot, slows down to 20 watts during normal use, idles at 2 watts during sleep, and zooms up to 34 watts when the screen saver kicks in. Just think how much energy and heat your computer consumes and generates while waiting for the nightly update from your systems department. But realistically, it is our servers that make the biggest impact, and while energy consumption is one way to be more green, another is to figure out ways to harness the heat the computers generate. One trend is to put computers in places that need to be heated up, like green houses in the winter. Another idea is to put them in places where cool air is exhausted, like building ventilation ducks. What can you do? Turn your computer off when it is not in use since the computer electronics and such are not as sensitive to power on, power off cycles as they used to be.
There seems to be a growing number of humanities scholars who understand that computers can be applied to their research. See the Digital Humanities Manifesto as an example. With the advent of all the electronic texts being made available, it is not possible to read each and every text individually. In an effort to analyze large copra more quickly, people can create word clouds against these documents to summarize them. They can extract the statistically significant words and phrases to determine their “aboutness”. They can easily compute Fog, Flesch, and Flesch-Kincaid scores denoting the complexity of documents. (“Remember, ‘Why Johnny can’t read’?”) These people understand that humanities scholarship is not necessarily done in isolation, and the codex is not necessarily the medium of the day. They understand the advantages of open access publishing. For our profession, it is difficult to overstate the number of opportunities this trend affords librarianship. Anybody can find information. What people need now are tools to make information easier to analyze and use.
Microblogging (think Twitter) is definitely hot. In some situations it can be a really useful application of computer technology. Frankly, I think the fascination will wear off and its functionality will become similar to the use of cellphone photographs at news-breaking events. Tweet, tweet, tweet.
If I were to pick the hottest trend in library technology, it would be fledgling implementation of large, all-encompassing indexes of journal and book content — integrating mega-indexes into the “discovery” interface. This is exemplified by Serials Solutions’ Summa, hinted at by an OCLC/EBSCO collaboration, and thought about by other library vendors. Google Scholar comes close but could benefit by adding more complete bibliographic data of books. OAIster worked for OAI-accessible content but needed to be indexed with a less proprietary tool. The folks at Index Data created something similar and included additional content, but the idea never seemed to catch on. Federated (broadcast) search tried and has yet to fulfill the promise. The driver behind this idea is the knowledge that many data silos don’t meet the needs of our users. Instead people want one box, one button, and one data set. Combine journal bibliographic data with book bibliographic data into a single index (not database). Sort search results by relevance. Provide a set of time-saving services against the result. In order for this technological technique to work each data set must be normalized into a single data structure and indexed (probably with an open source indexer called Lucene). In other words, there will be a large set of core elements such a title, author, note, subject, etc. All bibliographic data from all sets will be mapped to these fields and what doesn’t fall neatly into any one of them will be mapped to free text fields. Not perfect, not 100 percent, but hugely functional, and it meets user’s expectations. To see how this can be done with the volumes and volumes of medically-related open access content see the good work done by OpenPHI and their HealthLibrarian.
* This posting was originally “published” as a part of litablog.org, and it is duplicated here because many copies keep stuff safe.
2009-07-20T11:32:22+00:00 Mini-musings: Mass Digitization Mini-Symposium: A Reverse Travelogue http://infomotions.com/blog/2009/07/mass-digitization-mini-symposium-a-reverse-travelogue/The Professional Development Committee of the Hesburgh Libraries at the University of Notre Dame a “mini-symposium” on the topic of mass digitization on Thursday, May 21, 2009. This text documents some of what the speakers had to say. Given the increasingly wide availability of free full text information provided through mass digitization, the forum offered an opportunity for participants to learn how such a thing might affect learning, teaching, and scholarship. *
 Presenters and organizers |
After introductions by Leslie Morgan, I gave a talk called “Mass digitization in 15 minutes” where I described some of the types of library services and digital humanities processes that could be applied to digitized literature. “What might libraries be like if 51% or more of our collections were available in full text?”
The Symposium really got underway with the remarks of Maura Marx (Executive Director of the Open Knowledge Commons) in a talk called “Mass Digitization and Access to Books Online.” She began by giving an overview of mass digitization (such as the efforts of the Google Books Project and the Internet Archive) and compared it with large-scale digitization efforts. “None of this is new,” she said, and gave examples including Project Gutenberg, the Library of Congress Digital Library, and the Million Books Project. Because the Open Knowledge Commons is an outgrowth of the Open Content Alliance, she was able to describe in detail the mechanical digitizing process of the Internet Archive with its costs approaching 10¢/page. Along the way she advocated the HathiTrust as a preservation and sharing method, and she described it as a type of “radical collaboration.” “Why is mass digitization so important?” She went on to list and elaborate upon six reasons: 1) search, 2) access, 3) enhanced scholarship, 4) new scholarship, 5) public good, and 6) the democratization of information.
The second half of Ms. Marx’s presentation outlined three key issues regarding the Google Books Settlement. Specifically, the settlement will give Google a sort of “most favored nation” status because it prevents Google from getting sued in the future, but it does not protect other possible digitizers the same way. Second, it circumvents, through contract law, the problem of orphan works; the settlement sidesteps many of the issues regarding copyright. Third, the settlement is akin to a class action suit, but in reality the majority of people affected by the suit are unknown since they fall into the class of orphan works holders. To paraphrase, “How can a group of unknown authors and publishers pull together a class action suit?”
She closed her presentation with a more thorough description of Open Knowledge Commons agenda which includes: 1) the production of digitized materials, 2) the preservation of said materials, and 3) and the building of tools to make the materials increasingly useful. Throughout her presentation I was repeatedly struck by the idea of the public good the Open Knowledge Commons was trying to create. At the same time, her ideas were not so naive to ignore the new business models that are coming into play and the necessity for libraries to consider new ways to provide library services. “We are a part of a cyber infrastructure where the key word is ‘shared.’ We are not alone.”
Gary Charbonneau (Systems Librarian, Indiana University – Bloomington) was next and gave his presentation called “The Google Books Project at Indiana University“.
Indiana University, in conjunction with a number of other CIC (Committee on Institutional Cooperation) libraries have begun working with Google on the Google Books Project. Like many previous Google Book Partners, Charbonneau was not authorized to share many details regarding the Project; he was only authorized “to paint a picture” with the metaphoric “broad brush.” He described the digitization process as rather straightforward: 1) pull books from a candidate list, 2) charge them out to Google, 3) put the books on a truck, 4) wait for them to return in few weeks or so, and 5) charge the books back into the library. In return for this work they get: 1) attribution, 2) access to snippets, and 3) sets of digital files which are in the public domain. About 95% of the works are still under copyright and none of the books come from their rare book library — the Lilly Library.
Charbonneau thought the real value of the Google Book search was the deep indexing, something mentioned by Marx as well.
Again, not 100% of the library’s collection is being digitized, but there are plans to get closer to that goal. For example, they are considering plans to digitize their “Collections of Distinction” as well as some of their government documents. Like Marx, he advocated the HathiTrust but he also suspected commercial content might make its way into its archives.
One of the more interesting things Charbonneau mentioned was in regards to URLs. Specifically, there are currently no plans to insert the URLs of digitized materials into the 856 $u field of MARC records denoting the location of items. Instead they plan to use an API (application programmer interface) to display the location of files on the fly.
Indiana University hopes to complete their participation in the Google Books Project by 2013.
The final presentation of the day was given by Sian Meikle (Digital Services Librarian, University of Toronto Libraries) whose comments were quite simply entitled “Mass Digitization.”
The massive (no pun intended) University of Toronto library system consisting of a whopping 18 million volumes spread out over 45 libraries on three campuses began working with the Internet Archive to digitize books in the Fall of 2004. With their machines (the “scribes”) they are able to scan about 500 pages/hour and, considering the average book is about 300 pages long, they are scanning at a rate of about 100,000 books/year. Like Indiana and the Google Books Project, not all books are being digitized. For example, they can’t be too large, too small, brittle, tightly bound, etc. Of all the public domain materials, only 9% or so do not get scanned. Unlike the output of the Google Book Project, the deliverables from their scanning process include images of the texts, a PDF file of the text, an OCRed version of the text, a “flip book” version of the text, and a number of XML files complete with various types of metadata.
Considering Meikle’s experience with mass digitized materials, she was able to make a number of observations and distinctions. For example, we — the library profession — need to understand the difference between “born digital” materials and digitized materials. Because of formatting, technology, errors in OCR, etc, the different manifestations have different strengths and weaknesses. Some things are more easily searched. Some things are displayed better on screens. Some things are designed for paper and binding. Another distinction is access. According to some of her calculations, materials that are in electronic form get “used” more than their printed form. In this case “used” means borrowed or downloaded. Sometimes the ratio is as high as 300-to-1. There are three hundred downloads to one borrow. Furthermore, she has found that proportionately, English language items are not used as heavily as materials in other languages. One possible explanation is that material in other languages can be harder to locate in print. Yet another difference is the type of reading one format offers over another; compare and contrast “intentional reading” with “functional reading.” Books on computers make it easy to find facts and snippets. Books on paper tend to lend themselves better to the understanding of bigger ideas.
Lastly, Meikle alluded to ways the digitized content will be made available to users. Specifically, she imagines it will become a part of an initiative called the Scholar’s Portal — a single index of journal article literature, full text books, and bibliographic metadata. In my mind, such an idea is the heart of the “next generation” library catalog.
The symposium was attended by approximately 125 people. Most were from the Hesburgh Libraries of the University of Notre Dame. Some were from regional libraries. There were a few University faculty in attendance. The event was a success in that it raised the awareness of what mass digitization is all about, and it fostered communication during the breaks as well as after the event was over.
The opportunities for librarianship and scholarship in general are almost boundless considering the availability of full text content. The opportunities are even greater when the content is free of licensing restrictions. While the idea of complete collections totally free of restrictions is a fantasy, the idea of significant amounts of freely available full text content is easily within our grasp. During the final question and answer period, someone asked, “What skills and resources are necessary to do this work?” The answer was agreed upon by the speakers, “What is needed? An understanding that the perfect answer is not necessary prior to implementation.” There were general nods of agreement from the audience.
Now is a good time to consider the possibilities of mass digitization and to be prepared to deal with them before they become the norm as opposed to the exception. This symposium, generously sponsored by the Hesburgh Libraries Professional Development Committee, as well as library administration, provided the opportunity to consider these issues. “Thank you!”
* This posting was orignally “published” as a part of the Hesburgh Libraries of the University of Notre Dame website, and it is duplicated here because “Lot’s of copies keep stuff safe.”
 Map it |
I had the opportunity to give a hands-on workshop on XML to the folks at SEFLIN, and along the way I collected this water.
More specifically, I arrived a day early to check out and set up the venue. Not too difficult. The then drove like a bat out of Hell to Key Largo where I rented snorkeling equipment in at the John Pennekamp Coral Reef State Park. "We'going to be out about five miles, and the water is a bit choppy," and I thought, "I hope I don't get sick," but I really wanted to go snorkeling to see tropical fish. Seeing the statue was a bonus. I then drove to Coral Gables to see family. The next day the workshop went just fine, and in the evening I had dinner along the beach. Very nice.
2009-06-25T04:00:00+00:00 Mini-musings: Lingua::EN::Bigram (version 0.01) http://infomotions.com/blog/2009/06/linguaenbigram-version-001/Below is the POD (Plain O’ Documentation) file describing a Perl module I wrote called Lingua::EN::Bigram.
The purpose of the module is to: 1) extract all of the two-word phrases from a given text, and 2) rank each phrase according to its probability of occurance. Very nice for doing textual analysis. For example, by applying this module to Mark Twain’s Adventures of Tom Sawyer it becomes evident that the signifcant two-word phrases are names of characters in the story. On the other hand, Ralph Waldo Emerson’s Essays: First Series returns action statements — instructions. On the other hand Henry David Thoreau’s Walden returns “walden pond” and descriptions of pine trees. Interesting.
The code is available here or on CPAN.
Lingua::EN::Bigram – Calculate significant two-word phrases based on frequency and/or T-Score
  use Lingua::EN::Bigram;
  $bigram = Lingua::EN::Bigram->new;
  $bigram->text( 'All men by nature desire to know. An indication of this...' );
  $tscore = $bigram->tscore;
  foreach ( sort { $$tscore{ $b } <=> $$tscore{ $a } } keys %$tscore ) {

    print "$$tscore{ $_ }\t" . "$_\n";

  }
This module is designed to: 1) pull out all of the two-word phrases (collocations or “bigrams”) in a given text, and 2) list these phrases according to thier frequency and/or T-Score. Using this module is it possible to create list of the most common two-word phrases in a text as well as order them by their probable occurance, thus implying significance.
Create a new, empty bigram object:
  # initalize
  $bigram = Lingua::EN::Bigram->new;
Set or get the text to be analyzed:
  # set the attribute
  $bigram->text( 'All good things must come to an end...' );

  # get the attribute
  $text = $bigram->text;
Return a list of all the tokens in a text. Each token will be a word or puncutation mark:
  # get words
  @words = $bigram->words;
Return a reference to a hash whose keys are a token and whose values are the number of times the token occurs in the text:
  # get word count
  $word_count = $bigram->word_count;

  # list the words according to frequency
  foreach ( sort { $$word_count{ $b } <=> $$word_count{ $a } } keys %$word_count ) {

    print $$word_count{ $_ }, "\t$_\n";

  }
Return a list of all bigrams in the text. Each item will be a pair of tokens and the tokens may consist of words or puncutation marks:
  # get bigrams
  @bigrams = $bigram->bigrams;
Return a reference to a hash whose keys are a bigram and whose values are the frequency of the bigram in the text:
  # get bigram count
  $bigram_count = $bigram->bigram_count;

  # list the bigrams according to frequency
  foreach ( sort { $$bigram_count{ $b } <=> $$bigram_count{ $a } } keys %$bigram_count ) {

    print $$bigram_count{ $_ }, "\t$_\n";

  }
Return a reference to a hash whose keys are a bigram and whose values are a T-Score — a probabalistic calculation determining the significance of bigram occuring in the text:
  # get t-score
  $tscore = $bigram->tscore;

  # list bigrams according to t-score
  foreach ( sort { $$tscore{ $b } <=> $$tscore{ $a } } keys %$tscore ) {

    print "$$tscore{ $_ }\t" . "$_\n";

  }
Given the increasing availability of full text materials, this module is intended to help “digital humanists” apply mathematical methods to the analysis of texts. For example, the developer can extract the high-frequency words using the word_count method and allow the user to search for those words in a concordance. The bigram_count method simply returns the frequency of a given bigram, but the tscore method can order them in a more finely tuned manner.
Consider using T-Score-weighted bigrams as classification terms to supplement the “aboutness” of texts. Concatonate many texts together and look for common phrases written by the author. Compare these commonly used phrases to the commonly used phrases of other authors.
Each bigram includes punctuation. This is intentional. Developers may need want to remove bigrams containing such values from the output. Similarly, no effort has been made to remove commonly used words — stop words — from the methods. Consider the use of Lingua::StopWords, Lingua::EN::StopWords, or the creation of your own stop word list to make output more meaningful. The distribution came with a script (bin/bigrams.pl) demonstrating how to remove puncutation and stop words from the displayed output.
Finally, this is not the only module supporting bigram extraction. See also Text::NSP which supports n-gram extraction.
There are probably a number of ways the module can be improved:
T-Score is calculated as per Nugues, P. M. (2006). An introduction to language processing with Perl and Prolog: An outline of theories, implementation, and application with special consideration of English, French, and German. Cognitive technologies. Berlin: Springer. Page 109.
Eric Lease Morgan <eric_morgan@infomotions.com>
Below is a man page describing a Perl I module I recently wrote called Lingua::Concordance (version 0.01).
Given the increasing availability of full text books and journals, I think it behooves the library profession to aggressively explore the possibilities of providing services against text as a means of making the proverbial fire hose of information more useful. Providing concordance-like functions against texts is just one example.
The distribution is available from this blog as well as CPAN.
Lingua::Concordance – Keyword-in-context (KWIC) search interface
  use Lingua::Concordance;
  $concordance = Lingua::Concordance->new;
  $concordance->text( 'A long time ago, in a galaxy far far away...' );
  $concordance->query( 'far' );
  foreach ( $concordance->lines ) { print "$_\n" }
Given a scalar (such as the content of a plain text electronic book or journal article) and a regular expression, this module implements a simple keyword-in-context (KWIC) search interface — a concordance. Its purpose is to return lists of lines from a text containing the given expression. See the Discussion section, below, for more detail.
Create a new, empty concordance object:
$concordance = Lingua::Concordance->new;
Set or get the value of the concordance’s text attribute where the input is expected to be a scalar containing some large amount of content, like an electronic book or journal article:
  # set text attribute
  $concordance->text( 'Call me Ishmael. Some years ago- never mind how long...' );

  # get the text attribute
  $text = $concordance->text;
Note: The scalar passed to this method gets internally normalized, specifically, all carriage returns are changed to spaces, and multiple spaces are changed to single spaces.
Set or get the value of the concordance’s query attribute. The input is expected to be a regular expression but a simple word or phrase will work just fine:
  # set query attribute
  $concordance->query( 'Ishmael' );

  # get query attribute
  $query = $concordance->query;
See the Discussion section, below, for ways to make the most of this method through the use of powerful regular expressions. This is where the fun it.
Set or get the length of each line returned from the lines method, below. Each line will be padded on the left and the right of the query with the number of characters necessary to equal the value of radius. This makes it easier to sort the lines:
  # set radius attribute
  $concordance->radius( $integer );

  # get radius attribute
  $integer = $concordance->query;
For terminal-based applications it is usually not reasonable to set this value to greater than 30. Web-based applications can use arbitrarily large numbers. The internally set default value is 20.
Set or get the type of line sorting:
  # set sort attribute
  $concordance->sort( 'left' );

  # get sort attribute
  $sort = $concordance->sort;
Valid values include:
This is good for looking for patterns in texts, such as collocations (phrases, bi-grams, and n-grams). Again, see the Discussion section for hints.
Set or get the number of words to the left or right of the query to be used for sorting purposes. The internally set default value is 1:
  # set ordinal attribute
  $concordance->ordinal( 2 );

  # get ordinal attribute
  $integer = $concordance->ordinal;
Used in combination with the sort method, above, this is good for looking for textual patterns. See the Discussion section for more information.
Return a list of lines from the text matching the query. Our reason de existance:
@lines = $concordance->lines;
[Elaborate upon a number of things here such as but not limited to: 1) the history of concordances and concordance systems, 2) the usefulness of concordances in the study of linguistics, 3) how to exploit regular expressions to get the most out of a text and find interesting snippets, and 4) how the module might be implemented in scripts and programs.]
The internal _by_match subroutine, the one used to sort results by the matching regular expression, does not work exactly as expected. Instead of sorting by the matching regular expression, it sorts by the string exactly to the right of the matched regular expression. Consequently, for queries such as ‘human’, it correctly matches and sorts on human, humanity, and humans, but matches such as Humanity do not necessarily come before humanity.
The module implements, almost verbatim, the concordance programs and subroutines described in Bilisoly, R. (2008). Practical text mining with Perl. Wiley series on methods and applications in data mining. Hoboken, N.J.: Wiley. pgs: 169-185. “Thanks Roger. I couldn’t have done it without your book!”
2009-06-10T17:05:37+00:00 Water collection: Mississippi River at Gateway To The West (St. Louis, MO) http://infomotions.com/water/index.xml?cmd=getwater&id=99Map it |
I made it back to the Gateway.
The first time I visited the Gateway to the West was in 1986 or so when Mark Miller and I drove back from Mardi Gra. We were going through St. Louis and I insisted we stop. We did. We touched the arch around 10:30 at night. We were there for about twenty minutes. We go it on audio tape.
The good folks at MLNC offered me the opportunity to give a tele-conference presentation on the topic of open source software to interested librarians. The night before I was treated to dinner on The Hill, we ate ice cream at Ted Drewes, and the next morning I bought donuts from the Donut Drive-in. Heck I even got to play some disc golf! The presentation went well, and on the way out town I stopped at the Gateway, again, for twenty or thirty minutes. Only this time I got to see it in the day light.
2009-06-09T04:00:00+00:00 Mini-musings: EAD2MARC http://infomotions.com/blog/2009/06/ead2marc/This posting simply shares three hacks I’ve written to enable me to convert EAD files to MARC records, and ultimately add them to my “discovery” layer — VUFind — for the Catholic Portal:
The distribution is available in the archives, and distributed under the GNU Public License.
Now, off to go fishing.
2009-06-05T16:28:45+00:00 Mini-musings: Text mining: Books and Perl modules http://infomotions.com/blog/2009/06/text-mining-books-and-perl-modules/This posting simply lists some of the books I’ve read and Perl modules I’ve explored in regards to the field of text mining.
Through my explorations of term frequency/inverse document frequency (TFIDF) I became aware of a relatively new field of study called text mining. In many ways, text mining is similar to data mining only applied to unstructured texts instead of database rows and columns. Think plain text books such as items from Project Gutenberg or the Open Content Alliance. Text mining is a process including automatic classification, clustering (similar but distinct from classification), indexing and searching, entity extraction (names, places, organization, dates, etc.), statistically significant keyword and phrase extraction, parts of speech tagging, and summarization.
As a librarian, I found the whole thing extremely fascinating, consequently I read more.
I have found the following four books helpful. They have enabled me to learn about the principles of text mining.
When it comes to the process of text mining I found each of these books useful in their own right. Each provided me with ways to reading texts, parsing texts, counting words, counting phrases, and through the application of statistical analysis create lists and readable summaries denoting the “aboutness” of given documents.
As a Perl hacker I am interested in writing scripts putting into practice some of the things I learn. Listed here are a number of modules that have gotten me further along in regard to text mining:
Given the volume of “born digital” material being created, it is not possible to apply traditional library methods against them. The hand-crafted, heavy human touch process is not scalable. Given the amounts of mass digitized text being generated from the Google Books Project and the Open Content Alliance, new opportunities for literary analysis make themselves evident. Again, the traditional library processes can not fill the bill in these regards.
Text mining techniques offer possible solutions to these problems. Count words. Count phrases. Compare these words, phrases, and counts to other texts. Determine their statistical significance. Assign them to documents in the form of subject headings, keywords, author names, and other added entries in our metadata formats. Given large numbers of books, articles, and other “wordy” documents, learn how to “save the time of the reader” by summarizing these documents and ranking them in some sort of order in addition to alphabetical or date. Compare and contrast full text works by learning what words and types of words are used in documents. Are the words religious in nature? Mathematic and scientific? Poetic? Such things will provide additional means for understanding and interpreting everything from scholarly journal articles to works of classic fiction and philosophy. These techniques are not intended to replace existing methods of understanding and organization, but rather to supplement and build upon them. This is an evolutionary process.`
If libraries and librarians desire to remain relevant in the evolving information environment, then they will need to do the good work they do differently. The problem to be solved now-a-days is less about access and more about use. Text mining is one way of making the content of libraries more useful.
2009-06-04T02:14:55+00:00 Mini-musings: Interent Archive content in “discovery” systems http://infomotions.com/blog/2009/06/interent-archive-content-in-discovery-systems/This quick posting describes how Internet Archive content, specifically, content from the Open Content Alliance can be quickly and easily incorporated into local library “discovery” systems. VuFind is used here as the particular example:
Linked here is a small distribution of shell and Perl scripts that do this work for me and incorporate the content into VuFind. Here is how they can be used:
  $ getkeys.sh > catholic.keys
  $ keys2urls.pl catholic.keys > catholic.urls
  $ mirror.sh catholic.urls
  $ updatemarc.pl
  $ find /usr/var/html/etexts -name '*.marc' /
  -exec cat {} >> /usr/local/vufind/marc/archive.marc \;
  $ cd /usr/local/vufind
  $ ./import.sh marc/archive.marc
  $ sudo ./vufind.sh restart
Cool next steps would be use text mining techniques against the downloaded plain text versions of the documents to create summaries, extract named entities, and identify possible subjects. These items could then be inserted into the MARC records to enhance retrieval. Ideally the full text would be indexed, but alas, MARC does not accomodate that. “MARC must die.”
2009-06-02T12:59:08+00:00 Mini-musings: TFIDF In Libraries: Part III of III (For thinkers) http://infomotions.com/blog/2009/05/tfidf-in-libraries-part-iii-of-iii-for-thinkers/This is the third of the three-part series on the topic of TFIDF in libraries. In Part I the why’s and wherefore’s of TFIDF were outlined. In Part II TFIDF subroutines and programs written in Perl were used to demonstrate how search results can be sorted by relevance and automatic classification can be done. In this last part a few more subroutines and a couple more programs are presented which: 1) weigh search results given an underlying set of themes, and 2) determine similarity between files in a corpus. A distribution including the library of subroutines, Perl scripts, and sample data are available online.
As an intellectual humanist, I have always been interested in “great” ideas. In fact, one of the reasons I became I librarian was because of the profundity of ideas physically located libraries. Manifested in books, libraries are chock full of ideas. Truth. Beauty. Love. Courage. Art. Science. Justice. Etc. As the same time, it is important to understand that books are not source of ideas, nor are they the true source of data, information, knowledge, or wisdom. Instead, people are the real sources of these things. Consequently, I have also always been interested in “big names” too. Plato. Aristotle. Shakespeare. Milton. Newton. Copernicus. And so on.
As a librarian and a liberal artist (all puns intended) I recognize many of these “big names” and “great ideas” are represented in a set of books called the Great Books of the Western World. I then ask myself, “Is there someway I can use my skills as a librarian to help support other people’s understanding and perception of the human condition?” The simple answer is to collection, organize, preserve, and disseminate the things — books — manifesting great ideas and big names. This is a lot what my Alex Catalogue of Electronic Texts is all about. On the other hand, a better answer to my question is to apply and exploit the tools and processes of librarianship to ultimately “save the time of the reader”. This is where the use of computers, computer technology, and TFIDF come into play.
Part II of this series demonstrated how to weigh search results based on the relevancy ranked score of a search term. But what if you were keenly interested in “big names” and “great ideas” as they related to a search term? What if you wanted to know about librarianship and how it related to some of these themes? What if you wanted to learn about the essence of sculpture and how it may (or may not) represent some of the core concepts of Western civilization? To answer such questions a person would have to search for terms like sculpture or three-dimensional works of art in addition to all the words representing the “big names” and “great ideas”. Such a process would be laborious to enter by hand, but trivial with the use of a computer.
Here’s a potential solution. Create a list of “big names” and “great ideas” by copying them from a place such as the Great Books of the Western World. Save the list much like you would save a stop word list. Allow a person to do a search. Calculate the relevancy ranking score for each search result. Loop through the list of names and ideas searching for each of them. Calculate their relevancey. Sum the weight of search terms with the weight of name/ideas terms. Return the weighted list. The result will be a relevancy ranked list reflecting not only the value of the search term but also the values of the names/ideas. This second set of values I call the Great Ideas Coefficient.
To implement this idea, the following subroutine, called great_ideas, was created. Given an index, a list of files, and a set of ideas, it loops through each file calculating the TFIDF score for each name/idea:
  sub great_ideas {

    my $index = shift;
    my $files = shift;
    my $ideas = shift;

    my %coefficients = ();

    # process each file
    foreach $file ( @$files ) {

      my $words = $$index{ $file };
      my $coefficient = 0;

      # process each big idea
      foreach my $idea ( keys %$ideas ) {

        # get n and t for tdidf
        my $n = $$words{ $idea };
        my $t = 0;
        foreach my $word ( keys %$words ) { $t = $t + $$words{ $word } }

          # calculate; sum all tfidf scores for all ideas
          $coefficient = $coefficient + &tfidf( $n, $t, keys %$index, scalar @$files );

        }

      # assign the coefficient to the file
      $coefficients{ $file } = $coefficient;

    }

    return \%coefficients;

  }
A Perl script, ideas.pl, was then written taking advantage of the great_ideas subroutine. As described above, it applies the query to an index, calculates TFIDF for the search terms as well as the names/ideas, sums the results, and lists the results accordingly:
  # define
  use constant STOPWORDS => 'stopwords.inc';
  use constant IDEAS     => 'ideas.inc';

  # use/require
  use strict;
  require 'subroutines.pl';

  # get the input
  my $q = lc( $ARGV[ 0 ] );

  # index, sans stopwords
  my %index = ();
  foreach my $file ( &corpus ) { $index{ $file } = &index( $file, &slurp_words( STOPWORDS ) ) }

  # search
  my ( $hits, @files ) = &search( \%index, $q );
  print "Your search found $hits hit(s)\n";

  # rank
  my $ranks = &rank( \%index, [ @files ], $q );

  # calculate great idea coefficients
  my $coefficients = &great_ideas( \%index, [ @files ], &slurp_words( IDEAS ) );

  # combine ranks and coefficients
  my %scores = ();
  foreach ( keys %$ranks ) { $scores{ $_ } = $$ranks{ $_ } + $$coefficients{ $_ } }

  # sort by score and display
  foreach ( sort { $scores{ $b } <=> $scores{ $a } } keys %scores ) {

    print "\t", $scores{ $_ }, "\t", $_, "\n"

  }
Using the query tool described in Part II, a search for librarianship returns the following results:
  $ ./search.pl books
  Your search found 3 hit(s)
    0.00206045818083232   librarianship.txt
    0.000300606222548807  mississippi.txt
    5.91505974210339e-05  hegel.txt
Using the new program, ideas.pl, the same set of results are returned but in a different order, an order reflecting the existence of “big ideas” and “great ideas” in the texts:
  $ ./ideas.pl books
  Your search found 3 hit(s)
    0.101886904057731   hegel.txt
    0.0420767249559441  librarianship.txt
    0.0279062776599476  mississippi.txt
When it comes to books and “great” ideas, maybe I’d rather read hegel.txt as opposed to librarianship.txt. Hmmm…
Think of the great_ideas subroutine as embodying the opposite functionality as a stop word list. Instead of excluding the words in a given list from search results, use the words to skew search results in a particular direction.
The beauty of the the great_ideas subroutine is that anybody can create their own set of “big names” or “great ideas”. They could be from any topic. Biology. Mathematics. A particular subset of literature. Just as different sets of stop words are used in different domains, so can the application of a Great Ideas Coefficient.
TFIDF can be applied to the problem of finding more documents like this one.
The process of finding more documents like this is perennial. The problem is addressed in the field of traditional librarianship through the application of controlled vocabulary terms, author/title authority lists, the collocation of physical materials through the use of classification numbers, and bibliographic instruction as well as information literacy classes.
In the field of information retrieval, the problem is addressed through the application of mathematics. More specifically but simply stated, by plotting the TFIDF scores of two or more terms from a set of documents on a Cartesian plane it is possible to calculate the similarity between said documents by comparing the angle and length of the resulting vectors — a measure called “cosine similarity”. By extending the process to any number of documents and any number of dimensions it is relatively easy to find more documents like this one.
Suppose we have two documents: A and B. Suppose each document contains many words but those words were only science and art. Furthermore, suppose document A contains the word science 9 times and the word art 10 times. Given these values, we can plot the relationship between science and art on a graph, below. Document B can be plotted similarly supposing science occurs 6 times and the word art occurs 14 times. The resulting lines, beginning at the graph’s origin (O) to their end-points (A and B), are called “vectors” and they represent our documents on a Cartesian plane:
  s    |
  c  9 |         * A
  i    |        *
  e    |       *
  n  6 |      *      * B
  c    |     *     *
  e    |    *    *
       |   *   *
       |  *  *
       | * *
       O-----------------------
                10   14

                  art

  Documents A and B represented as vectors
If the lines OA and OB were on top of each other and had the same length, then the documents would be considered equal — exactly similar. In other words, the smaller the angle AOB is as well as the smaller the difference between the length lines OA and OB the more likely the given documents are the same. Conversely, the greater the angle of AOB and the greater the difference of the lengths of lines OA and OB the more unlike the two documents.
This comparison is literally expressed as the inner (dot) product of the vectors divided by the product of the Euclidian magnitudes of the vectors. Mathematically, it is stated in the following form and is called “cosine similarity”:
( ( A.B ) / ( ||A|| * ||B|| ) )
Cosine similarity will return a value between 0 and 1. The closer the result is to 1 the more similar the vectors (documents) compare.
Most cosine similarity applications apply the comparison to every word in a document. Consequently each vector has a large number of dimensions making calculations time consuming. For the purposes of this series, I am only interested in the “big names” and “great ideas”, and since The Great Books of the Western World includes about 150 of such terms, the application of cosine similarity is simplified.
To implement cosine similarity in Perl three additional subroutines needed to be written. One to calculate the inner (dot) product of two vectors. Another was needed to calculate the Euclidian length of a vector. These subroutines are listed below:
  sub dot {

    # dot product = (a1*b1 + a2*b2 ... ) where a and b are equally sized arrays (vectors)
    my $a = shift;
    my $b = shift;
    my $d = 0;
    for ( my $i = 0; $i <= $#$a; $i++ ) { $d = $d + ( $$a[ $i ] * $$b[ $i ] ) }
    return $d;

  }

  sub euclidian {

    # Euclidian length = sqrt( a1^2 + a2^2 ... ) where a is an array (vector)
    my $a = shift;
    my $e = 0;
    for ( my $i = 0; $i <= $#$a; $i++ ) { $e = $e + ( $$a[ $i ] * $$a[ $i ] ) }
    return sqrt( $e );

  }
The subroutine that does the actual comparison is listed below. Given a reference to an array of two books, stop words, and ideas, it indexes each book sans stop words, searches each book for a great idea, uses the resulting TFIDF score to build the vectors, and computes similarity:
  sub compare {

    my $books     = shift;
    my $stopwords = shift;
    my $ideas     = shift;

    my %index = ();
    my @a     = ();
    my @b     = ();

    # index
    foreach my $book ( @$books ) { $index{ $book } = &index( $book, $stopwords ) }

    # process each idea
    foreach my $idea ( sort( keys( %$ideas ))) {

      # search
      my ( $hits, @files ) = &search( \%index, $idea );

      # rank
      my $ranks = &rank( \%index, [ @files ], $idea );

      # build vectors, a & b
      my $index = 0;
      foreach my $file ( @$books ) {

        if    ( $index == 0 ) { push @a, $$ranks{ $file }}
        elsif ( $index == 1 ) { push @b, $$ranks{ $file }}
        $index++;

        }

      }

      # compare; scores closer to 1 approach similarity
      return ( cos( &dot( [ @a ], [ @b ] ) / ( &euclidian( [ @a ] ) * &euclidian( [ @b ] ))));

  }
Finally, a script, compare.pl, was written glueing the whole thing together. It’s heart is listed here:
  # compare each document...
  for ( my $a = 0; $a <= $#corpus; $a++ ) {

    print "\td", $a + 1;

    # ...to every other document
    for ( my $b = 0; $b <= $#corpus; $b++ ) {

      # avoid redundant comparisons
      if ( $b <= $a ) { print "\t - " }

      # process next two documents
      else {

        # (re-)initialize
        my @books = sort( $corpus[ $a ], $corpus[ $b ] );

        # do the work; scores closer to 1000 approach similarity
        print "\t", int(( &compare( [ @books ], $stopwords, $ideas )) * 1000 );

      }

    }

    # next line
    print "\n";

  }
In a nutshell, compare.pl loops through each document in a corpus and compares it to every other document in the corpus while skipping duplicate comparisons. Remember, only the dimensions representing “big names” and “great ideas” are calculated. Finally, it displays a similarity score for each pair of documents. Scores are multiplied by 1000 to make them easier to read. Given the sample data from the distribution, the following matrix is produced:
  $ ./compare.pl
    Comparison: scores closer to 1000 approach similarity

        d1   d2   d3   d4   d5   d6

    d1   -  922  896  858  857  948
    d2   -   -   887  969  944  971
    d3   -   -    -   951  954  964
    d4   -   -    -    -   768  905
    d5   -   -    -    -    -   933
    d6   -   -    -    -    -    -

    d1 = aristotle.txt
    d2 = hegel.txt
    d3 = kant.txt
    d4 = librarianship.txt
    d5 = mississippi.txt
    d6 = plato.txt
From the matrix is it obvious that documents d2 (hegel.txt) and d6 (plato.txt) are the most similar since their score is the closest to 1000. This means the vectors representing these documents are closer to congruency than the other documents. Notice how all the documents are very close to 1000. This makes sense since all of the documents come from the Alex Catalogue and the Alex Catalogue documents are selected because of the “great idea-ness”. The documents should be similar. Notice which documents are the least similar: d4 (librarianship.txt) and d5 (mississippi.txt). The first is a history of librarianship. The second is a novel called Life on the Mississippi. Intuitively, we would expect this to be true; neither one of these documents are the topic of “great ideas”.
(Argg! Something is incorrect with my trigonometry. When I duplicate a document and run compare.pl the resulting cosine similarity value between the exact same documents is 540, not 1000. What am I doing wrong?)
This last part in the series demonstrated ways term frequency/inverse document frequency (TFIDF) can be applied to over-arching (or underlying) themes in a corpus of documents, specifically the “big names” and “great ideas” of Western civilization. It also demonstrated how TFIDF scores can be used to create vectors representing documents. These vectors can then be compared for similarity, and, by extension, the documents they represent can be compared for similarity.
The purpose of the entire series was to bring to light and take the magic out of a typical relevancy ranking algorithm. A distribution including all the source code and sample documents is available online. Use the distribution as a learning tool for your own explorations.
As alluded to previously, TFIDF is like any good folk song. It has many variations and applications. TFIDF is also like milled grain because it is a fundemental ingredient to many recipes. Some of these recipies are for bread, but some of them are for pies or just thickener. Librarians and libraries need to incorporate more mathematical methods into their processes. There needs to be a stronger marriage between the social characteristics of librarianship and the logic of mathematics. (Think arscience.) The application of TFIDF in libraries is just one example.
2009-05-31T20:30:39+00:00 Water collection: Tidal Basin at the Jefferson Memorial (Washington, DC) http://infomotions.com/water/index.xml?cmd=getwater&id=98 Map it |
[This posting is in response to a tiny thread on the NGC4Lib mailing list about the decline of books. –ELM]
Yes, books are on the decline, but in order to keep this trend in perspective it is important to not confuse the medium with the message. The issue is not necessarily about books as much as it is about the stuff inside the books.
Books — codexes — are a particular type of technology. Print words and pictures on leaves of paper. Number the pages. Add an outline of the book’s contents — a table of contents. Make the book somewhat searchable by adding an index. Wrap the whole thing between a couple of boards. The result is a thing that is portable, durable, long- lasting, and relatively free-standing as well as independent of other technology. But all of this is really a transport medium, a container for the content.
Consider the content of books. Upon close examination it is a recorded manifestation of humanity. Books — just like the Web — are a reflection of humankind because just anything you can think of can be manifested in printed form. Birth. Growth. Love. Marriage. Aging. Death. Poetry. Prose. Mathematics. Astronomy. Business. Instructions. Facts. Directories. Gardening. Theses and dissertations. News. White papers. Plans. History. Descriptions. Dreams. Weather. Stock quotes. The price of gold. Things for sale. Stories both real and fictional. Etc. Etc. Etc.
Consider the length of time humankind has been recording things in written form. Maybe five thousand years. What were the mediums used? Stone and clay tablets? Papyrus scrolls. Vellum. Paper. To what extent did people bemoan the death of clay tablets? To what extent did they bemoan the movement from scrolls to codexes? Probably the cultures who valued verbal traditions as opposed to written traditions (think of the American Indians) had more to complain about than the migration from one written from to another. The medium is not as important as the message.
Different types of content lend themselves to different mediums. Music can be communicated via the written score, but music is really intended to be experienced through hearing. Sculpture is, by definition, a three-dimensional medium, yet we take photographs of it, a two-dimensional medium. The poetry and prose lend themselves very well to the written word, but they can be seen as forms of storytelling, and while there are many advantages to stories being written down, there are disadvantages as well. No sound effects. Where to put the emphasis on phrases? Hand gestures to communicate subtle distinctions are lost. It is for all of these reasons that libraries (and museums and archives) also collect the mediums that better represent this content. Paintings. Sound recordings. Artifacts. CDs and DVDs.
The containers of information will continue to change, but I assert that the content will not. The content will continue to be a reflection of humankind. It will represent all of the things that it means to be men, woman, and children. It will continue to be an exposition of our collective thoughts, feelings, beliefs, and experiences.
Libraries and other “cultural heritage institutions” do not have and never did have a monopoly on recorded content, but now, more than ever, and as we have moved away from an industrial-based economy to a more service-based economy whose communication channels are electronic and global, the delivery of recorded content, in whatever form, is more profitable. Consequently there is more competition. Libraries need to get a grip on what they are all about. If it is about the medium — books, CDs, articles — then the future is grim. If it is about content and making that content useful to their clientele, then the opportunities are wide open. Shifting a person’s focus from the how to the what is challenging. Looking at the forest from the trees is sometimes overwhelming. Anybody can get information these days. We are still drinking from the proverbial fire hose. The problem to be solved is less about discovery and more about use. It is about placing content in context. Providing a means to understanding it, manipulating it, and using it to solve the problems revolving around what it means to be human.
We are a set of educated people. If we put our collective minds to the problem, then I sincerely believe libraries can and will remain relevant. In fact, that is why I instituted this [the NGC4Lib] mailing list.
2009-05-08T13:41:04+00:00 Musings: Implementing user-centered experiences in a networked environment http://infomotions.com/musings/user-centered/ In this environment where disintermediation seems to be increasingly common, it is ironic people also expect personalized service. Libraries are experiencing dilemma when it comes to providing many of their services. On one hand fewer people are coming into libraries to access traditional reference services, and at the same time they are expecting interfaces to library content to be "smarter" and more user-centered. How can libraries meet these seemingly contradictory expectations? The answer is not too difficult as long as we: 1) learn how to take better advantage of computer technology to implement our ideas, and 2) re-examine the definition and purpose of patron privacy. This presentation will elaborate on these ideas and demonstrate a few ways they might be implemented.Loose ends make me feel uncomfortable, and one of the loose ends in my professional life is the Code4Lib Software Award.
Code4Lib began as a mailing list in 2003 and has grown to about 1,200 subscribers from all over the world. New people subscribe to the list almost daily. Its Web presence started up in 2005. Our conferences have been stimulating, informative, and productive for all three years of their existence. Our latest venture — the journal — records, documents, and shares the practical experience of our community. Underlying all of this is an IRC channel where answers to library-related computer problems can be answered in real-time. Heck, there even exists three for four Code4Lib “franchises”. In sum, by exploiting both traditional and less traditional mediums the Code4Lib Community has grown and matured quickly over the past five years. In doing so it has provided valuable and long-lasting services to itself as well as the greater library profession.
It is for the reasons outlined above that I believe our community is ripe for an award. Good things happen in Code4Lib. These things begin with individuals, and I believe the good code written by these individuals ought to be formally recognized. Unfortunately, ever since I put forward the idea, I have heard more negative things than positive. To paraphrase, “It would be seen as an endorsement, and we don’t endorse… It would turn out to be just a popularity contest… There are so many characteristics of good software that any decision would seem arbitrary.”
Apparently the place for an award is not as obvious to others as it is to me. Apparently our community is not as ready for an award as I thought we were. That is why, for the time being, I am withdrawing my offer to sponsor one. Considering who I am, I simply don’t have the political wherewithal to make the award a reality, but I do predict there will be an award at some time, just not right now. The idea needs to ferment for a while longer.
2009-04-27T12:42:44+00:00 Mini-musings: TFIDF In Libraries: Part II of III (For programmers) http://infomotions.com/blog/2009/04/tfidf-in-libraries-part-ii-of-iii-for-programmers/This is the second of a three-part series called TFIDF In Libraries, where relevancy ranking techniques are explored through a set of simple Perl programs. In Part I relevancy ranking was introduced and explained. In Part III additional word/document weighting techiques will be explored to the end of filtering search results or addressing the perennial task of “finding more documents like this one.” In the end it is the hoped to demonstrate that relevancy ranking is not magic nor mysterious but rather the process of applying statistical techiques to textual objects.
As described in Part I, term frequency/inverse document frequency (TFIDF) is a process of counting words in a document as well as throughout a corpus of documents to the end of sorting documents in statistically relevent ways.
Term frequency (TF) is essencially a percentage denoting the number of times a word appears in a document. It is mathematically expressed as C / T, where C is the number of times a word appears in a document and T is the total number of words in the same document.
Inverse document frequency (IDF) takes into acount that many words occur many times in many documents. Stop words and the word “human” in the MEDLINE database are very good examples. IDF is mathematically expressed as D / DF, where D is the total number of documents in a corpus and DF is the number of document in which a particular word is found. As D / DF increases so does the significance of the given word.
Given these two factors, TFIDF is literally the product of TF and IDF:
TFIDF = ( C / T ) * ( D / DF )
This is the basic form that has been used to denote relevance ranking for more than forty years, and please take note that it requires no advanced mathematical knowledge — basic arithmatic.
Like any good recipe or folk song, TFIDF has many variations. Google, for example, adds additional factors into their weighting scheme based on the popularity of documents. Other possibilities could include factors denoting the characteristics of the person using the texts. In order to accomodate for the wide variety of document sizes, the natural log of IDF will be employed throughout the balance of this demonstration. Therefore, for the purposes used here, TFIDF will be defined thus:
TFIDF = ( C / T ) * log( D / DF )
In order to put theory into practice, I wrote a number of Perl subroutines implementing various aspects of relevancy ranking techniques. I then wrote a number of scripts exploiting the subroutines, essencially wrapping them in a user interface.
Two of the routines are trivial and will not be explained in any greater detail than below:
Two more of the routines are used to support indexing and searching the corpus. Again, since neither is the focus of this posting, each will only be outlined:
The heart of the library of subroutines is used to calculate TFIDF, ranks search results, and classify documents. Of course the TFIDF calculation is absolutely necessary, but ironically, it is the most straight-forward routine in the collection. Given values for C, T, D, and DF it returns decimal between 0 and 1. Trivial:
  # calculate tfidf
  sub tfidf {

    my $n = shift;  # C
    my $t = shift;  # T
    my $d = shift;  # D
    my $h = shift;  # DF

    my $tfidf = 0;

    if ( $d == $h ) { $tfidf = ( $n / $t ) }
    else { $tfidf = ( $n / $t ) * log( $d / $h ) }

    return $tfidf;

  }
Many readers will probably be most interested in the rank routine. Given an index, a list of files, and a query, this code calculates TFIDF for each file and returns the results as a reference to a hash. It does this by repeatedly calculating the values for C, T, D, and DF for each of the files and calling tfidf:
  # assign a rank to a given file for a given query
  sub rank {

    my $index = shift;
    my $files = shift;
    my $query = shift;

    my %ranks = ();

    foreach my $file ( @$files ) {

      # calculate n
      my $words = $$index{ $file };
      my $n = $$words{ $query };

      # calculate t
      my $t = 0;
      foreach my $word ( keys %$words ) { $t = $t + $$words{ $word } }

      # assign tfidf to file
      $ranks{ $file } = &tfidf( $n, $t, keys %$index, scalar @$files );

    }

    return \%ranks;

  }
The classify routine is an added bonus. Given the index, a file, and the corpus of files, this function calculates TFIDF for each word in the file and returns a refernece to a hash containing each word and its TFIDF value. In other words, instead of calculating TFIDF for a given query in a subset of documents, it calculates TFIDF for each word in an entire corpus. This proves useful in regards to automatic classification. Like rank, it repeatedly determines values for C, T, D, and DF and calls tfidf:
  # rank each word in a given document compared to a corpus
  sub classify {

    my $index  = shift;
    my $file   = shift;
    my $corpus = shift;

    my %tags = ();

    foreach my $words ( $$index{ $file } ) {

      # calculate t
      my $t = 0;
      foreach my $word ( keys %$words ) { $t = $t + $$words{ $word } }

      foreach my $word ( keys %$words ) {

        # get n
        my $n = $$words{ $word };

        # calculate h
        my ( $h, @files ) = &search( $index, $word );

        # assign tfidf to word
        $tags{ $word } = &tfidf( $n, $t, scalar @$corpus, $h );

      }

    }

    return \%tags;

  }
Two simple Perl scripts are presented, below, taking advantage of the routines described, above. The first is search.pl. Given a single term as input this script indexes the .txt files in the current directory, searches them for the term, assigns TFIDF to each of the results, and displays the results in a relevancy ranked order. The essencial aspects of the script are listed here:
  # define
  use constant STOPWORDS => 'stopwords.inc';

  # include
  require 'subroutines.pl';

  # get the query
  my $q = lc( $ARGV[ 0 ] );

  # index
  my %index = ();
  foreach my $file ( &corpus ) { $index{ $file } = &index( $file, &slurp_words( STOPWORDS ) ) }

  # search
  my ( $hits, @files ) = &search( \%index, $q );
  print "Your search found $hits hit(s)\n";

  # rank
  my $ranks = &rank( \%index, [ @files ], $q );

  # sort by rank and display
  foreach my $file ( sort { $$ranks{ $b } <=> $$ranks{ $a } } keys %$ranks ) {

    print "\t", $$ranks{ $file }, "\t", $file, "\n"

  }

  # done
  print "\n";
  exit;
Output from the script looks something like this:
  $ ./search.pl knowledge
  Your search found 6 hit(s)
    0.0193061840120664    plato.txt
    0.00558586078987563   kant.txt
    0.00299602568022012   aristotle.txt
    0.0010031177985631    librarianship.txt
    0.00059150597421034   hegel.txt
    0.000150303111274403  mississippi.txt
From these results you can see that the document named plato.txt is the most relevent because it has the highest score, in fact, it is almost four times more relevant than the second hit, kant.txt. For extra credit, ask yourself, “At what point do the scores become useless, or when do the scores tell you there is nothing of significance here?”
As alluded to in Part I of this series, TFIDF can be turned on its head to do automatic classification. Weigh each term in a corpus of documents, and list the most significant words for a given document. Classify.pl does this by denoting a lower bounds for TFIDF scores, indexing an entire corpus, weighing each term, and outputing all the terms whose scores are greater than the lower bounds. If no terms are greater than the lower bounds, then it lists the top N scores as defined by a configuration. The essencial aspects of classify.pl are listed below:
  # define
  use constant STOPWORDS    => 'stopwords.inc';
  use constant LOWERBOUNDS  => .02;
  use constant NUMBEROFTAGS => 5;

  # require
  require 'subroutines.pl';

  # initialize
  my @corpus = &corpus;

  # index
  my %index = ();
  foreach my $file (@corpus ) { $index{ $file } = &index( $file, &slurp_words( STOPWORDS ) ) }

  # classify each document
  foreach my $file ( @corpus ) {

    print $file, "\n";

    # list tags greater than a given score
    my $tags  = &classify( \%index, $file, [ @corpus ] );
    my $found = 0;
    foreach my $tag ( sort { $$tags{ $b } <=> $$tags{ $a } } keys %$tags ) {

      if ( $$tags{ $tag } > LOWERBOUNDS ) {

        print "\t", $$tags{ $tag }, "\t$tag\n";
        $found = 1;

      }

      else { last }

    }

    # accomodate tags with low scores
    if ( ! $found ) {

      my $n = 0;
      foreach my $tag ( sort { $$tags{ $b } => $$tags{ $a } } keys %$tags ) {

        print "\t", $$tags{ $tag }, "\t$tag\n";
        $n++;
        last if ( $n == NUMBEROFTAGS );

      }

    }

    print "\n";

  }

  # done
  exit;
For example, sample, yet truncated, output from classify.pl looks like this:
  aristotle.txt
    0.0180678691531642  being
    0.0112840859266579  substances
    0.0110363803118312  number
    0.0106083766432284  matter
    0.0098440843778661  sense

  mississippi.txt
    0.00499714142455761  mississippi
    0.00429324597184886  boat
    0.00418922035591656  orleans
    0.00374087743616293  day
    0.00333830388445574  river
Thus, assuming a lower TFIDF bounds of 0.02, the words being, substance, number, matter, and sense are the most significant in the document named aristotle.txt. But since none of the words in mississippi.txt have a score that high the top five words are returned instead. For more extra credit, think of ways classify.pl can be improved by answering, “How can the output be mapped to controlled vocabulary terms or expanded through the use of some other thesarus?”
The Perl subroutines and scripts described here implement TFIDF to do rudimentary ranking of search results and automatic classification. They are not designed to be production applications, just example tools for the purposes of learning. Turning the ideas implemented in these scripts into production applications have been the fodder for many people’s careers and entire branches of computer science.
You can download the scripts, subroutines, and sample data in order for you to learn more. You are encouraged to remove the .txt files from the distribution and replace them with your own data. I think your search results and automatic classification output will confirm in your mind that TFIDF is well-worth the time and effort of the library community. Given the amounts of full text books and journal articles freely available on the Internet, it behooves the library profession to learn to exploit these concepts because our traditional practices simply: 1) do not scale, or 2) do not meet with our user’s expectations. Furthermore, farming these sorts of solutions out to vendors is irresponsible.
2009-04-21T02:42:39+00:00 Mini-musings: Ralph Waldo Emerson’s Essays http://infomotions.com/blog/2009/04/ralph-waldo-emersons-essays/It was with great anticipation that I read Ralph Waldo Emerson’s Essays (both the First Series as well as the Second Series), but my expectations were not met. In a sentence I thought Emerson used too many words to say things that could have been expressed more succinctly.
The Essays themselves are a set of unsystematic short pieces of literature describing what one man thinks of various classic themes, such as but not limited to: history, intellect, art, experience, gifts, nature, etc. The genre itself — the literary essay or “attempts” — was apparently first popularized by Montaigne and mimicked by other “great” authors in the Western tradition including Bacon, Rousseau, and Thoreau. Considering this, maybe the poetic and circuitous nature of Emerson’s “attempts” should not be considered a fault.
Because it was evident that later essays did not necessarily build on previous ones, I jumped around from chapter to chapter as whimsy dictated. Probably one of the first I read was “Art” where he describes the subject as the product of men detached from society.
It is the habit of certain minds to give an all-excluding fulness to the objects, the thought, the world, they alight upon, and to make that for the time the deputy of the world. These are the artists, the orators, the leaders of society. The power to detach and to magnify by detaching, is the essence of rhetoric in the hands of the orator and the poet.
But at the same time he seems to contradict himself earlier when he says:
No man can quite emancipate himself from the age and country, or produce a model in which the education, the religion, the politics, usages, and arts, of his times shall have not share. Though he were never so original, never so wilful and fantastic, he cannot wipe out of his work every trace of the thoughts amidst which it grew.
How can something be the product of a thing detached from society when it is not possible become detached in the first place?
I, myself, being a person of mind more than heart, was keenly interested in the essay entitled “Intellect” where Emerson describes it as something:
…void of affection, and sees an object as it stands in the light of science, cool and disengaged… Intellect pierces the form, overlaps the wall, detects intrinsic likeness between remote things, and reduces all things into a few principles.
At the same time, intellect is not necessarily genius, since genius also requires spontaneity:
…but the power of picture or expression, in the most enriched and flowing nature, implies a mixture of will, a certain control over the spontaneous states, without which no production is possible. It is a conversation of all nature into the rhetoric of thought under the eye of judgement, with the strenuous exercise of choice. And yet the imaginative vocabulary seems to be spontaneous also. It does not flow from experience only or mainly, but from a richer source. Not by any conscious imitation of particular forms are the grand strokes of the painter executed, but by repairing to the fountain-head of all forms in his mind.
Emerson apparently carried around his journal wherever he went. He made a living writing and giving talks. Considering this, and considering the nature of his writing, I purposely left his essay entitled “The Poet” until last. Not surprisingly, he had a lot to say on the subject, and I found this to be the hilight of my readings:
The poet is the person in whom these powers [the reproduction of senses] are in balance, the man without impediment, who sees and handles that which others dream of, traverses the whole scale of experience, and is representative of man, in virtue offering the largest power to receive and to impart… The poet is the sayer, the namer, and represents beauty… The poet does not wait for the hero or the sage, but as they act and think primarily, so he writes pirmarily what will and must be spoken, reckoning the others, though primaries also, yet, in repsect to him, secondaries and servants.
I found it encouraging that science was mentioned a few times during his discourse on the poet, since I believe a better understanding of one’s environment comes from the ability to think both artistically as well as scientifically, an idea I call arscience:
…science always goes abreast with the just elevation of the man, keeping step with religion and metaphysics; or, the state of science is an index of our self-knowledge… All the facts of the animal economy, — sex, nutriment, gestation, birth, growth — are symbols of passage of the world into the soul of man, to suffer there a change, and reappear a new and higher fact. He uses forms according to the life, and not according to the form. This is true science.
I think Emerson must have been a bit frustrated (or belittling himself in order be percieved as more believable) with a search for truth when he says, “I look in vain for the poet whom I describe.” But later on he summarizes much of what the Essays describe when he says, “Art is the path of the creator to his work,” and he then goes on to say what I said at the beginning of this review:
The poet pours out verses in every solitude. Most of the things he says are conventional, no doubt; but by and by he says something which is original and beautiful. That charms him.
I was hoping to find more inspriation regarding the definition of Unitarianism throughout the book, but alas, the term was only mentioned a couple of times. Instead, I learnd more indirectly that Emerson affected my thinking in more subtle ways. I have incorporated much of his thought into my own without knowing it. Funny how one’s education manifests itself.
Use this word cloud of the combined Essays to get an idea of what they are “about”:
nature men life world good shall soul great thought like love power know let mind truth make society persons day old character heart genius god come beauty law being history fact true makes work virtue better art laws self form right eye best action poet friend think feel eyes beautiful words human spirit little light facts speak person state natural intellect sense live force use seen thou long water people house certain individual end comes whilst divine property experience look forms hour read place present fine wise moral works air poor need earth hand common word thy conversation young stand
And since a picture is worth a thousand words, here is a simple graph illustrating how the 100 most frequently used words in the Essays (sans stop words) compare to one another:

This is the first of a three-part series called TFIDF In Libraries, where “relevancy ranking” will be introduced. In this part, term frequency/inverse document frequency (TFIDF) — a common mathematical method of weighing texts for automatic classification and sorting search results — will be described. Part II will illustrate an automatic classification system and simple search engine using TFIDF through a computer program written in Perl. Part III will explore the possibility of filtering search results by applying TFIDF against sets of pre-defined “Big Names” and/or “Big Ideas” — an idea apparently called “champion lists”.
To many of us the phrase “relevancy ranked search results” is a mystery. What does it mean to be “relevant”? How can anybody determine relevance for me? Well, a better phrase might have been “statistically significant search results”. Taking such an approach — the application of statistical analysis against texts — does have its information retrieval advantages over straight Boolean logic. Take for example, the following three documents consisting of a number of words, Table #1:
| Document #1 | Document #2 | Document #3 |
| Word | Word | Word |
| airplane | book | building |
| blue | car | car |
| chair | chair | carpet |
| computer | justice | ceiling |
| forest | milton | chair |
| justice | newton | cleaning |
| love | pond | justice |
| might | rose | libraries |
| perl | shakespeare | newton |
| rose | slavery | perl |
| shoe | thesis | rose |
| thesis | truck | science |
A search for “rose” against the corpus will return three hits, but which one should I start reading? The newest document? The document by a particular author or in a particular format? Even if the corpus contained 2,000,000 documents and a search for “rose” returned a mere 100 the problem would remain. Which ones should I spend my valuable time accessing? Yes, I could limit my search in any number of ways, but unless I am doing a known item search it is quite likely the search results will return more than I can use, and information literacy skills will only go so far. Ranked search results — a list of hits based on term weighting — has proven to be an effective way of addressing this problem. All it requires is the application of basic arithmetic against the documents being searched.
We can begin by counting the number of times each of the words appear in each of the documents, Table #2:
| Document #1 | Document #2 | Document #3 | |||
| Word | C | Word | C | Word | C |
| airplane | 5 | book | 3 | building | 6 |
| blue | 1 | car | 7 | car | 1 |
| chair | 7 | chair | 4 | carpet | 3 |
| computer | 3 | justice | 2 | ceiling | 4 |
| forest | 2 | milton | 6 | chair | 6 |
| justice | 7 | newton | 3 | cleaning | 4 |
| love | 2 | pond | 2 | justice | 8 |
| might | 2 | rose | 5 | libraries | 2 |
| perl | 5 | shakespeare | 4 | newton | 2 |
| rose | 6 | slavery | 2 | perl | 5 |
| shoe | 4 | thesis | 2 | rose | 7 |
| thesis | 2 | truck | 1 | science | 1 |
| Totals (T) | 46 | 41 | 49 | ||
Given this simple counting method, searches for “rose” can be sorted by its “term frequency” (TF) — the quotient of the number of times a word appears in each document (C), and the total number of words in the document (T) — TF = C / T. In the first case, rose has a TF value of 0.13. In the second case TF is 0.12, and in the third case it is 0.14. Thus, by this rudimentary analysis, Document #3 is most significant in terms of the word “rose”, and Document #2 is the least. Document #3 has the highest percentage of content containing the word “rose”.
Unfortunately, this simple analysis needs to be offset considering frequently occurring terms across the entire corpus. Good examples are stop words or the word “human” in MEDLINE. Such words are nearly meaningless because they appear so often. Consider Table #3 which includes the number of times each word is found in the entire corpus (DF), and the quotient of the total number of documents (D or in this case, 3) and DF — IDF = D / DF. Words with higher scores are more significant across the entire corpus. Search terms whose IDF (“inverse document frequency”) score approach 1 are close to useless because they exist in just about every document:
| Document #1 | Document #2 | Document #3 | ||||||
| Word | DF | IDF | Word | DF | IDF | Word | DF | IDF |
| airplane | 1 | 3.0 | book | 1 | 3.0 | building | 1 | 3.0 |
| blue | 1 | 3.0 | car | 2 | 1.5 | car | 2 | 1.5 |
| chair | 3 | 1.0 | chair | 3 | 1.0 | carpet | 1 | 3.0 |
| computer | 1 | 3.0 | justice | 3 | 1.0 | ceiling | 1 | 3.0 |
| forest | 1 | 3.0 | milton | 1 | 3.0 | chair | 3 | 1.0 |
| justice | 3 | 1.0 | newton | 2 | 1.5 | cleaning | 1 | 3.0 |
| love | 1 | 3.0 | pond | 1 | 3.0 | justice | 3 | 1.0 |
| might | 1 | 3.0 | rose | 3 | 1.0 | libraries | 1 | 3.0 |
| perl | 2 | 1.5 | shakespeare | 1 | 3.0 | newton | 2 | 1.5 |
| rose | 3 | 1.0 | slavery | 1 | 3.0 | perl | 2 | 1.5 |
| shoe | 1 | 3.0 | thesis | 2 | 1.5 | rose | 3 | 1.0 |
| thesis | 2 | 1.5 | truck | 1 | 3.0 | science | 1 | 3.0 |
By taking into account these two factors — term frequency (TF) and inverse document frequency (IDF) — it is possible to assign “weights” to search results and therefore ordering them statistically. Put another way, a search result’s score (“ranking”) is the product of TF and IDF:
TFIDF = TF * IDF where:
- TF = C / T where C = number of times a given word appears in a document and T = total number of words in a document
- IDF = D / DF where D = total number of documents in a corpus, and DF = total number of documents containing a given word
Table #4 is a combination of all the previous tables with the addition of the TFIDF score for each term:
| Document #1 | |||||||
| Word | C | T | TF | D | DF | IDF | TFIDF |
| airplane | 5 | 46 | 0.109 | 3 | 1 | 3.0 | 0.326 |
| blue | 1 | 46 | 0.022 | 3 | 1 | 3.0 | 0.065 |
| chair | 7 | 46 | 0.152 | 3 | 3 | 1.0 | 0.152 |
| computer | 3 | 46 | 0.065 | 3 | 1 | 3.0 | 0.196 |
| forest | 2 | 46 | 0.043 | 3 | 1 | 3.0 | 0.130 |
| justice | 7 | 46 | 0.152 | 3 | 3 | 1.0 | 0.152 |
| love | 2 | 46 | 0.043 | 3 | 1 | 3.0 | 0.130 |
| might | 2 | 46 | 0.043 | 3 | 1 | 3.0 | 0.130 |
| perl | 5 | 46 | 0.109 | 3 | 2 | 1.5 | 0.163 |
| rose | 6 | 46 | 0.130 | 3 | 3 | 1.0 | 0.130 |
| shoe | 4 | 46 | 0.087 | 3 | 1 | 3.0 | 0.261 |
| thesis | 2 | 46 | 0.043 | 3 | 2 | 1.5 | 0.065 |
| Document #2 | |||||||
| Word | C | T | TF | D | DF | IDF | TFIDF |
| book | 3 | 41 | 0.073 | 3 | 1 | 3.0 | 0.220 |
| car | 7 | 41 | 0.171 | 3 | 2 | 1.5 | 0.256 |
| chair | 4 | 41 | 0.098 | 3 | 3 | 1.0 | 0.098 |
| justice | 2 | 41 | 0.049 | 3 | 3 | 1.0 | 0.049 |
| milton | 6 | 41 | 0.146 | 3 | 1 | 3.0 | 0.439 |
| newton | 3 | 41 | 0.073 | 3 | 2 | 1.5 | 0.110 |
| pond | 2 | 41 | 0.049 | 3 | 1 | 3.0 | 0.146 |
| rose | 5 | 41 | 0.122 | 3 | 3 | 1.0 | 0.122 |
| shakespeare | 4 | 41 | 0.098 | 3 | 1 | 3.0 | 0.293 |
| slavery | 2 | 41 | 0.049 | 3 | 1 | 3.0 | 0.146 |
| thesis | 2 | 41 | 0.049 | 3 | 2 | 1.5 | 0.073 |
| truck | 1 | 41 | 0.024 | 3 | 1 | 3.0 | 0.073 |
| Document #3 | |||||||
| Word | C | T | TF | D | DF | IDF | TFIDF |
| building | 6 | 49 | 0.122 | 3 | 1 | 3.0 | 0.367 |
| car | 1 | 49 | 0.020 | 3 | 2 | 1.5 | 0.031 |
| carpet | 3 | 49 | 0.061 | 3 | 1 | 3.0 | 0.184 |
| ceiling | 4 | 49 | 0.082 | 3 | 1 | 3.0 | 0.245 |
| chair | 6 | 49 | 0.122 | 3 | 3 | 1.0 | 0.122 |
| cleaning | 4 | 49 | 0.082 | 3 | 1 | 3.0 | 0.245 |
| justice | 8 | 49 | 0.163 | 3 | 3 | 1.0 | 0.163 |
| libraries | 2 | 49 | 0.041 | 3 | 1 | 3.0 | 0.122 |
| newton | 2 | 49 | 0.041 | 3 | 2 | 1.5 | 0.061 |
| perl | 5 | 49 | 0.102 | 3 | 2 | 1.5 | 0.153 |
| rose | 7 | 49 | 0.143 | 3 | 3 | 1.0 | 0.143 |
| science | 1 | 49 | 0.020 | 3 | 1 | 3.0 | 0.061 |
Given TFIDF, a search for “rose” still returns three documents ordered by Documents #3, #1, and #2. A search for “newton” returns only two items ordered by Documents #2 (0.110) and #3 (0.061). In the later case, Document #2 is almost one and a half times more “relevant” than document #3. TFIDF scores can be summed to take into account Boolean unions (or) or intersections (and).
TDIDF can also be applied a priori to indexing/searching to create browsable lists — hence, automatic classification. Consider Table #5 where each word is listed in a sorted TFIDF order:
| Document #1 | Document #2 | Document #3 | |||
| Word | TFIDF | Word | TFIDF | Word | TFIDF |
| airplane | 0.326 | milton | 0.439 | building | 0.367 |
| shoe | 0.261 | shakespeare | 0.293 | ceiling | 0.245 |
| computer | 0.196 | car | 0.256 | cleaning | 0.245 |
| perl | 0.163 | book | 0.220 | carpet | 0.184 |
| chair | 0.152 | pond | 0.146 | justice | 0.163 |
| justice | 0.152 | slavery | 0.146 | perl | 0.153 |
| forest | 0.130 | rose | 0.122 | rose | 0.143 |
| love | 0.130 | newton | 0.110 | chair | 0.122 |
| might | 0.130 | chair | 0.098 | libraries | 0.122 |
| rose | 0.130 | thesis | 0.073 | newton | 0.061 |
| blue | 0.065 | truck | 0.073 | science | 0.061 |
| thesis | 0.065 | justice | 0.049 | car | 0.031 |
Given such a list it would be possible to take the first three terms from each document and call them the most significant subject “tags”. Thus, Document #1 is about airplanes, shoes, and computers. Document #2 is about Milton, Shakespeare, and cars. Document #3 is about buildings, ceilings, and cleaning.
Probably a better way to assign “aboutness” to each document is to first denote a TFIDF lower bounds and then assign terms with greater than that score to each document. Assuming a lower bounds of 0.2, Document #1 is about airplanes and shoes. Document #2 is about Milton, Shakespeare, cars, and books. Document #3 is about buildings, ceilings, and cleaning.
Since the beginning, librarianship has focused on the semantics of words in order to create a cosmos from an apparent chaos. “What is this work about? Read the descriptive information regarding a work (author, title, publisher date, notes, etc.) to workout in your mind its importance.” Unfortunately, this approach leaves much up to interpretation. One person says this document is about horses, and the next person says it is about husbandry.
The mathematic approach is more objective and much more scalable. While not perfect, there is much less interpretation required with TFIDF. It is just about mathematics. Moreover, it is language independent; it is possible to weigh terms and provide relevance ranking without knowing the meaning of a single word in the index.
In actuality, the whole thing is not an either/or sort of question, but instead a both/and sort of question. Human interpretation provides an added value, definitely. At the same time the application of mathematics (“Can you say ‘science?'”) proves to be quite useful too. The approaches compliment each other — they are arscient. Much of how we have used computers in libraries has simply been to automate existing processes. We have still to learn how to truly take advantage of a computer’s functionality. It can remember things a whole lot better than we can. It can add a whole lot faster than we can. Because of this it is almost trivial to calculate ( C / T ) * ( D / DF ) over an entire corpus of 2,000,000 MARC records or even 1,000,000 full text documents.
None of these ideas are new. It is possible to read articles describing these techniques going back about 40 years. Why has our profession not used them to our advantage. Why is it taking us so long? If you have an answer, then enter it in the comment box below.
This first posting has focused on the fundamentals of TFIDF. Part II will describe a Perl program implementing relevancy ranking and automatic classification against sets of given text files. Part III will explore the idea of using TFIDF to enable users to find documents alluding to “great ideas” or “great people”.
2009-04-13T23:57:38+00:00 Readings: Statistical interpretation of term specificity and its application in retrieval http://www.soi.city.ac.uk/~ser/idfpapers/ksj_orig.pdf "The exhaustivity of document descriptions and the specificity of index terms are usually regarded as independent. It is suggested that specificity should be interpreted statistically, as a function of term use rather than of term meaning. The effects on retrieval of variations in term specificity are examined, experiments with three test collections showing, in particular, that frequently-occurring terms are required for good overall performance. It is argued that terms should be weighted according to collection frequency, so that matches on less frequent, more specific, terms are of greater value than matches on frequent terms. Results for the test collections show that considerable improvements in performance are obtained with this very simple procedure."This documents my day-long experiences at the Computers in Libraries annual conference, March 31, 2009. In a sentence, the meeting was well-attended and covered a wide range of technology issues.
 Washington Monument |
The day began with an interview-style keynote address featuring Paul Holdengraber (New York Public Library) interviewed by Erik Boekesteijn (Library Concept Center). As the Director of Public Programs at the Public Library, Holdengraber’s self-defined task is to “levitate the library and make the lions on the front steps roar.” Well-educated, articulate, creative, innovative, humorous, and cosmopolitan, he facilitates sets of programs in the library’s reading room called “Live from the New York Public Library” where he interviews people in an effort to make the library — a cultural heritage institution — less like a mausoleum for the Old Masters and more like a place where great ideas flow freely. A couple of notable quotes included “My mother always told me to be porous because you have two ears and only one mouth” and “I want to take the books from the closed stacks and make people desire them.” Holdengraber’s enthusiasm for his job is contagious. Very engaging as well as interesting.
During the first of the concurrent sessions I gave a presentation called “Open source software: Controlling your computing environment” where I first outlined a number of definitions and core principles of open source software. I then tried to draw a number of parallels between open source software and librarianship. Finally, I described how open source software can be applied in libraries. During the presentation I listed four skills a library needs to become proficient in in order to take advantage of open source software (namely, relational databases, XML, indexing, and some sort of programming language), but in retrospect I believe basic systems administration skills are the things really required since the majority of open source software is simply installed, configured, and used. Few people feel the need to modify its functionality and therefore the aforementioned skills are not critical, only desirable.
 Lincoln Memorial |
In “Designing the Digital Experience” by David King (Topeka & Shawnee County Public Library) attendees were presented with ways websites can be created in a way that digitally supplements the physical presents of a library. He outlined the structural approaches to Web design such as the ones promoted by Jesse James Garrett, David Armano and 37Signals. He then compared & contrasted these approaches to the “community path” approaches which endeavor to create a memorable experience. Such things can be done, King says, through conversations, invitations, participation, creating a sense of familiarity, and the telling of stories. It is interesting to note that these techniques are not dependent on Web 2.0 widgets, but can certainly be implemented through their use. Throughout the presentation he brought all of his ideas home through the use of examples from the websites of Harley-Davidson, Starbucks, American Girl, and Webkinz. Not ironically, Holdengraber was doing the same thing for the Public Library except in the real world, not through a website.
In a session after lunch called “Go Where The Client Is” Natalie Collins (NRC-CISTI) described how she and a few co-workers converted library catalog data containing institutional repository information as well as SWETS bibliographic data into NLM XML and made it available for indexing by Google Scholar. In the end, she discovered that this approach was much more useful to her constituents when compared to the cool (“kewl”) Web Services-based implementation they had created previously. Holly Hibner (Salem-South Lyon District Library) compared & contrasted the use of tablet PC’s with iPods for use during roaming reference services. My two take-aways from this presentation were cool (“kewl”) services called drop.io and LinkBunch, websites making it easier to convert data from one format into another and bundle lists of link together into a single URL, respectively.
 Jefferson Memorial |
The last session for me that day was one on open source software implementations of “next generation” library catalogs, specifically Evergreen. Karen Collier and Andrea Neiman (both of Kent County Public Library) outlined their implementation process of Evergreen in rural Michigan. Apparently it began with the re-upping the of their contract for their computer hardware. Such a thing would cost more than they expected. This led to more investigations which ultimately resulted in the selection of Evergreen. “Open source seemd like a logical conclusion.” They appear to be very happy with their decision. Karen Schneider (Equinox Software) gave a five-minute “lightning talk” on the who and what of Equinox and Evergreen. Straight to the point. Very nice. Ruth Dukelow (Michigan Library Consortium) described how participating libraries have been brought on board with Evergreen, and she outlined the reasons why Evergreen fit the bill: it supported MLCat compliance, it offered an affordable hosted integrated library system, it provided access to high quality MARC records, and it offered a functional system to non-technical staff.
I enjoyed my time there in Washington, DC at the conference. Thanks go to Ellyssa Kroski, Steven Cohen, and Jane Dysart for inviting me, and allowing me to share some of my ideas. The attendees at the conference were not as technical as you might find at Access, Code4Lib, and certainly not JCDL nor ECDL. This is not a bad thing. The people were genuinely interested in the things presented, but I did overhear one person say, “This is completely over my head.” The highlight for me took a place during the last session where people were singing the praise of open source software for all the same reasons I had been expressing them over the past twelve years. “It is so much like the principles of librarianship,” she said. That made my day.
2009-04-04T00:40:41+00:00 Mini-musings: Quick Trip to Purdue http://infomotions.com/blog/2009/04/quick-trip-to-purdue/Last Friday, March 27, I was invited by Michael Witt (Interdisciplinary Research Librarian) at Purdue University to give a presentation to the library faculty on the topic of “next generation” library catalogs. During the presentation I made an effort to have the participants ask and answer questions such as “What is the catalog?”, “What is it expected to contain?”, “What functions is it expected to perform and for whom?”, and most importantly, “What problems is it expected to solve?”
I then described how most of the current “next generation” library catalog thingees are very similar. Acquire metadata records. Optionally store them in a database. Index them (with Lucene). Provide services against the index (search and browse). I then brought the idea home by describing in more detail how things like VuFind, Primo, Koha, Evergreen, etc. all use this model. I then made an attempt to describe how our “next generation” library catalogs could go so much further by providing services against the texts as well as services against the index. “Discovery is not the problem that needs to be solved.”
Afterwards a number of us went to lunch where we compared & contrasted libraries. It is a shame the Purdue University, University of Indiana, and University of Notre Dame libraries do not work more closely together. Our strengths compliment each other in so many ways.
“Michael, thanks for the opportunity!”
Something I saw on the way back home.
This posting documents my experiences at the Library Technology Conference at Macalester College (St. Paul, Minnesota) on March 18-19, 2009. In a sentence, this well-organized regional conference provided professionals from near-by states an opportunity to listen, share, and discuss ideas concerning the use of computers in libraries.
 Wallace Library |
 Dayton Center |
 St. Paul Cathedral |
 Balboa facade |
 Eric and Eric |
 St. Anthony Falls |
Map it |
![]() As a community, let’s establish the Code4Lib Open Source Software Award.
As a community, let’s establish the Code4Lib Open Source Software Award.
Lot’s of good work gets produced by the Code4Lib community, and I believe it is time to acknowledge these efforts in some tangible manner. Our profession is full of awards for leadership, particular aspects of librarianship, scholarship, etc. Why not an award for the creation of software? After all, the use of computers and computer software is an essential part of our day-to-day work. Let’s grant an award for something we value — good, quality, open source software.
While I think the idea of an award is a laudable one, I have more questions than answers about the process of implementing it. Is such a thing sustainable, and if so, then how? Who is eligible for the award? Only individuals? Teams? Corporate entities? How are awardees selected? Nomination? Vote? A combination of the two? What qualities should the software exemplify? Something that solves a problem for many people? Something with a high “cool factor”? Great documentation? Easy to install? Well-supported with a large user base? Developed within the past year?
As a straw man for discussion, I suggest something like the following:
These are just suggestions to get us started. What do you think? Consider sharing your thoughts as comments below, in channel, or on the Code4Lib mailing list.
2009-03-06T00:13:28+00:00 Mini-musings: Code4Lib Conference, Providence (Rhode Island) 2009 http://infomotions.com/blog/2009/03/code4lib-conference-providence-rhode-island-2009/
![]() This posting documents my experience at the Code4Lib Conference in Providence, Rhode Island between February 23-26, 2009. To summarize my experiences, I went away with a better understanding of linked data, it is an honor to be a part of this growing and maturing community, and finally, this conference is yet another example of the how the number of opportunities for libraries exist if only you are to think more about the whats of librarianship as opposed to the hows.
This posting documents my experience at the Code4Lib Conference in Providence, Rhode Island between February 23-26, 2009. To summarize my experiences, I went away with a better understanding of linked data, it is an honor to be a part of this growing and maturing community, and finally, this conference is yet another example of the how the number of opportunities for libraries exist if only you are to think more about the whats of librarianship as opposed to the hows.
On the first day I facilitated a half-day pre-conference workshop, one of many, called XML In Libraries. Designed as a full-day event, this workshop was not one of my better efforts. (“I sincerely apologize.”) Everybody brought their own computer, but some of them could not get on the ‘Net. The first half of the workshop should be trimmed down significantly since many of the attendees knew what was being explained. Finally, the hands-on part of the workshop with JEdit was less than successful because it refused to work for me and many of the participants. Lessons learned, and things to keep in mind for next time.
For the better part of the afternoon, I sat in on the WorldCat Grid Services pre-conference where we were given an overview of SRU from Ralph Levan. There was then a discussion on how the Grid Services could be put into use.
During the last part of the pre-conference afternoon I attended the linked data session. Loosely structured and by far the best attended event, I garnered an overview of what linked data services are and what are some of the best practices for implementing them. I had a very nice chat with Ross Singer who helped me bring some of these concepts home to my Alex Catalogue. Ironically, the Catalogue is well on its way to being exposed via a linked data model since I have previously written sets of RDF/XML files against its underlying content. The key seems to be to link together as many HTTP-based URIs as possible while providing content-negotiation services in order to disseminate your information in the most readable/usable formats possible.
Code4Lib is a single-track conference, and its 300 or so attendees gathered in a refurbished Masonic Lodge — in the shadows of the Rhode Island State House — for the first day of the conference.
Roy Tennant played Master of Ceremonies for the Day #1 and opened the event with an outline of what he sees as the values of the Code4Lib community: egalitarianism, participation, democracy, anarchy, informality, and playfulness. From my point of view, that sums things up pretty well. In an introduction for first-timers, Mark Matienzo (aka anarchist) described the community as “a bit clique-ish”, a place where there are a lot of inside jokes (think bacon, neck beards, and ++), and a venue where “social capital” is highly valued. Many of these things can be most definitely been seen “in channel” by participating in the IRC #code4lib chat room.
In his keynote address, A Bookless Future For Libraries, Stefano Mazzocchi encouraged the audience to think of the “iPod for books” as an ecosystem necessity, not a possibility. He did this by first chronicling the evolution of information technology (speech to cave drawing to clay tablets to fiber to printing to electronic publishing). He outlined the characteristics of electronic publishing: dense, widely available, network accessible, distributed business models, no batteries, lots of equipment, next to zero marginal costs, and poor resolution. He advocated the Semantic Web (a common theme throughout the conference), and used Freebase as a real-world example. One of the most intriguing pieces of information I took away from this presentation was the idea of making games out of data entry in order to get people to contribute content. For example, make it fun to guess whether or not a person was live, dead, male, or female. Based on the aggregate responses of the “crowd” it is possible to make pretty reasonable guesses as to the truth of facts.
Next, Andres Soderback described his implementation of the Semantic Web world in Why Libraries Should Embrace Linked Data. More specifically, he said library catalogs should be: open, linkable, provide links, be a part of the network, not an end of themselves, and hackable. He went on to say that “APIs suck” because they are: specific, take too much control, not hackable enough, and not really “Web-able”. Not incidentally, he had previously exposed his entire library catalog — the National Library of Sweden — as a set of linked data, but it broke after the short-lived lcsh.info site by Ed Summers had been taken down.
Ross Singer described an implementation and extension to the Atom Publishing Protocol in his Like A Can Opener For Your Data Silo: Simple Access Through AtomPub and Jangle. I believe the core of his presentation can be best described through an illustration where an Atom client speaks to Jangle through Atom/RSS, Jangle communicates with (ILS-) specific applications through “connectors”, and the results are returned back to the client:
                   +--------+       +-----------+
  +--------+       |        | ---> | connector |
  | client | ---> | Jangle |       +-----------+
  +--------+       |        | ---> | connector |
                   +--------+       +-----------+
I was particularly impressed with Glen Newton‘s LuSql: (Quickly And Easily) Getting Your Data From Your DBMS Into Lucene because it described a Java-based command-line interface for querying SQL databases and feeding the results to the community’s currently favorite indexer — Lucene. Very nice.
Terence Ingram‘s presentation RESTafarian-ism At The NLA can be summarized in the phrase “use REST in moderation” because too many REST-ful services linked together are difficult to debug, trouble shoot, and fall prey to over-engineering.
Based on the the number of comments in previous blog postings, Birkin James Diana‘s presentation The Dashboard Initiative was a hit. It described sets of simple configurable “widgets” used to report trends against particular library systems and services.
In Open Up Your Repository With A SWORD Ed Summers and Mike Giarlo described a protocol developed through the funding of the good folks at JISC used to deposit materials into an (institutional) repository through the use of AtomPub protocol.
In an effort view editorial changes over time against sets of EAD files, Mark Matienzo tried to apply version control software techniques against his finding aids. He described these efforts in How Anarchivist Got His Groove Back 2: DVCS, Archival Description, And Workflow but it seems as if he wasn’t as successful as he had hoped because of the hierarchal nature his source (XML) data.
Godmar Back in LibX 2.0 described how he was enhancing the LibX API to allow for greater functionality by enhancing its ability to interact with an increased number of external services such as the ones from Amazon.com. Personally, I wonder how well content providers will accept the idea of having content inserted into “their” pages by the LibX extension.
The last formal presentation of the day, djatoka For djummies, was given by Kevin Clark and John Fereira. In it they described the features, functions, advantages, and disadvantages of a specific JPEG2000 image server. Interesting technology that could be exploited more if there were a 100% open source solution.
Day #1 then gave way to about a dozen five-minute “lightning talks”. In this session I shared the state of the Alex Catalogue in Alex4: Yet Another Implementation, and in retrospect I realize I didn’t say a single word about technology but only things about functionality. Hmmm…
On the second day of the conference I had the honor of introducing the keynote speaker, Sebastian Hammer. Having known him for at least a few years, I described him as the co-author of the venerable open source Yaz and Zebra software — the same Z39.50 software that drives quite a number of such implementations across Library Land. I also alluded to the time I visited him and his co-workers at Index Data in Copenhagen where we talked shop and shared a very nice lunch in their dot-com-like flat. I thought there were a number of meaty quotes from his presentation. “If you have something to say, then say it in code… I like to write code but have fun along the way… We are focusing our efforts on creating tools instead of applications… We try to create tools to enable libraries to do the work that they do. We think this is fun… APIs are glorified loyalty schemes… We need to surrender our data freely… Standardization is hard and boring but essential… Hackers must become advocates within our organizations.” Throughout his talk he advocated local libraries that: preserve cultural heritage, converge authoritative information, support learning & research, and are pillars of democracy.
Timothy McGeary gave an update on the OLE Project in A New Frontier – The Open Library Environment (OLE). He stressed that the Project is not about the integrated library system but bigger: special collections, video collections, institutional repositories, etc. Moreover, he emphasized that all these things are expected to be built around a Service Oriented Architecture and there is a push to use existing tools for traditional library functions such as the purchasing department for acquisitions or identity management systems for patron files. Throughout his present he stressed that this project is all about putting into action a “community source process”.
In Blacklight As A Unified Discovery Platform Bess Sadler described Blacklight as “yet another ‘next-generation’ library catalog”. This seemingly off-hand comment should not be taken as such because the system implements many of the up-and-coming ideas our fledgling “discovery” tools espouse.
Joshua Ferraro walked us through the steps for creating open bibliographic (MARC) data using a free, browser-based cataloging service in a presentation called A New Platform for Open Data – Introducing ±biblios.net Web Services. Are these sort of services, freely provided by the likes of LibLime and the Open Library, the sorts of services that make OCLC reluctant to freely distribute “their” sets of MARC records?
Building on LibLime’s work, Chris Catalfo described and demonstrated a plug-in for creating Dublin Core metadata records using ±biblios.net Web Services in Extending ±biblios, The Open Source Web Based Metadata Editor.
Jodi Schneider and William Denton gave the best presentation I’ve ever heard on FRBR in their What We Talk About When We Talk About FRBR. More specifically, they described “strong” FRBR-ization complete with Works, Manifestations, Expressions, and Items owned by Persons, Families, and Corporate Bodies and having subjects grouped into Concepts, Objects, and Events. Very thorough and easy to understand. schneider++ & denton++ # for a job well-done
In Complete Faceting Toke Eskildsen described his institutions’s implementation called Summa from the State and University Library of Denmark.
Erik Hatcher outlined a number of ways Solr can be optimized for better performance in The Rising Sun: Making The Most Of Solr Power. Solr certainly seems to be on its way to becoming the norm for indexing in the Code4Lib community.
A citation parsing application was described by Chris Shoemaker in FreeCite – An Open Source Free-Text Citation Parser. His technique did not seem to be based so much on punctuation (syntax) as much as word groupings. I think we have something to learn from his technique.
Richard Wallis advocated the use of a Javascript library to update and insert added functionality to OPAC screens in his Great Facets, Like Your Relevance, But Can I Have Links To Amazon And Google Book Search? His tool — Juice — shares OPAC-specific information.
The Semantic Web came full-circle through Sean Hannan‘s Freebasing For Fun And Enhancement. One of the take-aways I got from this conference is to learn more ways Freebase and be used (exploited) in my everyday work.
During the Lightning Talks I very briefly outlined an idea that has been brewing in my head for a few years, specifically, the idea of an Annual Code4Lib Open Source Software Award. I don’t exactly know how such a thing would get established or be made sustainable, but I do think our community is ripe for such recognition. Good work is done by our people, and I believe it needs to be tangibly acknowledged. I am willing to commit to making this a reality by this time next year at Code4Lib Conference 2010.
I did not have the luxury for staying the last day of the Conference. I’m sure I missed some significant presentations. Yet, the things I did see where impressive. They demonstrated ingenuity, creativity, and as the same time, practicality — the desire to solve real-world, present-day problems. These things require the use of both sides of a person’s brain. Systematic thinking and intuition; an attention to detail but the ability to see the big picture at the same time. In other words, arscience.
code4lib++
As I sit here beside my fire at the cabin, I reflect on the experiences documented by Henry David Thoreau in his book entitled Walden.
On one level, the book is about a man who goes off to live in a small cabin by a pond named Walden. It describes how be built his home, tended his garden, and walked through the woods. On another level, it is collection of self-observations and reflections on what it means to be human. “I went to the woods because I wished to live deliberately, to front only the essential facts of life, and see if I could not learn what it has to teach, and not, when I came to die, discover that I had not lived… I wanted to live deep and suck out all the marrow of life, to live so sturdily and Spartan-like as to put to rout all that was not life, to cut a broad swath and shave close, to drive life into a corner, and reduce it to its lowest terms, and, if it proved to be mean, why then to get the whole and genuine meanness of it, and publish its meanness to the world.”
The book doesn’t really have beginning, a middle, and an end. There is no hero, no protagonist, no conflict, and no climax. Instead, the book is made up of little stories amassed over the period of one and a half years while living alone. Economy — an outline of the necessities of life such as clothing, shelter, and food. It cost him $28 to built his cabin, and he grew much of his own food. “Yet men have come to such a pass that they frequently starve not for want of necessities, but for want of luxuries.”
I also enjoyed the chapter called “The Bean-Field”. “I have come to love my rows, my beans, though so many more than I wanted.” Apparently he had as many as seven miles of beans, if they were all strung in a row. Even over two acres of ground, I find that hard to believe. He mentions woodchucks often in the chapter as well as throuhout the book, and he dislikes them because they eat his crop. I always thought woodchucks — ground hogs — were particularly interesting since they were abundant around the property where I grew up. In relation to economy, Thoreau spent just less than $14 on gardening expenses, and after selling his crop made a profit of almost $9. “Daily the beans saw me come to their rescue armed with a hoe, and thin their ranks of the enemies, filling up the trenches with weedy dead.”
The chapter called “Sounds” is full of them or allusions to them: voice, rattle, whistle, scream, shout, ring, announce, hissing, bells, sung, lowing, serenaded, music chanted, cluck, buzzing, screech, wailing, trilled, sighs, hymns, threnodies, gurgling, hooting, baying, trump, bellowing, crow, bark, laughing, cackle, creaking, and snapped. Almost a cacophony, but at the same time a possible symphony. It depends on your perspective.
While he lived alone, he was never seemingly lonely. In fact, he seemed to attract visitors or sought them out himself. Consider the wood chopper who was extra skilled at this job. Reflect on the Irish family who lived “rudely”. Compare and contrast the well-to-do professional with manners to the man who lived in a hollow log. (I wonder whether or not that second man really existed.)
Thoreau’s description of the pond itself were arscient. [1] He describes its color, its depth, and over all size. He ponders where it got its name, its relation to surrounding ponds, and where its water comes from and goes. He fishes in it regularly, and walk upon its ice in the winter. He describes how men harvest its ice and how the pond keeps most of the effort. He appreciates the appearance of the pond as he observes it during different times of year as well as from different vantage points. In my mind, it is a good thing to observe anything and just about everything from many points of view, both literally and figuratively.
The concluding chapter has a number of meaty thoughts. “I left the woods for a good a reason as I went there. Perhaps it seemed to me that I had several more lives to live, and could not spare any more time for that one… I learned this, at least, by my experiment: that if one advances confidently in the direction of his dreams, and endeavors to live the life which he has imagined, he will meet with a success unexpected in common hours… If a man does not keep pace with his companions, perhaps it is because he hears a different drummer. Let him step to the music which he hears, however measured or far away… However mean your life is, meet it and live it; do not shun it and call it hard names… Love your life, poor as it is… Rather than love, than money, than fame, give me truth.”
As a service against the text, and as a means to learning about it more quickly, I give you the following word cloud (think “concordance”) complete with links to the places in the text where the words can be found:
life pond most house day though water many time never about woods without much yet long see before first new ice well down little off know own old nor good part winter far way being last after heard live great world again nature shore morning think work once same walden thought feet spring earth here perhaps night side sun things surface few thus find found summer must true got also years village enough myself half poor seen air better put read till small within wood cannot fire ground deep end bottom left nothing went away place almost least
[1] Arscience — art-science — is a term I use to describe a way of thinking incorporating both artistic and scientific elements. Arscient thinking is poetic, intuitive, free-flowing, and at the same time it is systematic, structured, and repeatable. To my mind, a person requires both in order to create a cosmos from the apparent chaos of our surroundings.
2009-02-09T04:09:17+00:00 Mini-musings: Eric Lease Morgan’s Top Tech Trends for ALA Mid-Winter, 2009 http://infomotions.com/blog/2009/02/eric-lease-morgans-top-tech-trends-for-ala-mid-winter-2009/This is a list of “top technology trends” written for ALA Mid-Winter, 2009. They are presented in no particular order. [This text was originally published on the LITA Blog, but it is duplicated here because “lot’s of copies keep stuff safe.” –ELM]
Indexing with Solr/Lucene works well – Lucene seems to have become the gold standard when it comes to open source indexer/search engine platforms. Solr — a Web Services interface to Lucene — is increasingly the preferred way to read & write Lucene indexes. Librarians love to create lists. Books. Journals. Articles. Movies. Authoritative names and subjects. Websites. Etc. All of these lists beg for the organization. Thus, (relational) databases. But Lists need to be short, easily sortable, and/or searchable in order to be useful as finding aids. Indexers make things searchable, not databases. The library profession needs to get its head around the creation of indexes. The Solr/Lucene combination is a good place to start — er, catch up.
Linked data is a new name for the Semantic Web – The Semantic Web is about creating conceptual relationships between things found on the Internet. Believe it or not, the idea is akin to the ultimate purpose of a traditional library card catalog. Have an item in hand. Give it a unique identifier. Systematically describe it. Put all the descriptions in one place and allow people to navigate the space. By following the tracings it is possible to move from one manifestation of an idea to another ultimately providing the means to the discovery, combination, and creation of new ideas. The Semantic Web is almost the exactly the same thing except the “cards” are manifested using RDF/XML on computers through the Internet. From the beginning RDF has gotten a bad name. “Too difficult to implement, and besides the Semantic Web is a thing of science fiction.” Recently the term “linked data” has been used to denote the same process of creating conceptual relationships between things on the ‘Net. It is the Semantic Web by a different name. There is still hope.
Blogging is peaking – There is no doubt about it. The Blogosphere is here to stay, yet people have discovered that it is not very easy to maintain a blog for the long haul. The technology has made it easier to compose and distribute one’s ideas, much to the chagrin of newspaper publishers. On the other hand, the really hard work is coming up with meaningful things to say on a regular basis. People have figured this out, and consequently many blogs have gone by the wayside. In fact, I’d be willing to bet that the number of new blogs is decreasing, and the number of postings to existing blogs is decreasing as well. Blogging was “kewl” is cool but also hard work. Blogging is peaking. And by the way, I dislike those blogs which are only partial syndicated. They allow you to read the first 256 characters or so of and entry, and then encourage you to go to their home site to read the whole story whereby you are bombarded with loads of advertising.
Word/tag clouds abound – It seems very fashionable to create word/tag clouds now-a-days. When you get right down to it, word/tag clouds are a whole lot like concordances — one of the first types of indexes. Each word (or tag) in a document is itemized and counted. Stop words are removed, and the results are sorted either alphabetically or numerically by count. This process — especially if it were applied to significant phrases — could be a very effective and visual way to describe the “aboutness” of a file (electronic book, article, mailing list archive, etc.). An advanced feature is to hyperlink each word, tag, or phrase to specific locations in the file. Given a set of files on similar themes, it might be interesting to create word/tag clouds against them in order to compare and contrast. Hmmm…
“Next Generation” library catalogs seem to be defined – From my perspective, the profession has stopped asking questions about the definition of “next generation” library catalogs. I base this statement on two things. First, the number of postings and discussion on a mailing list called NGC4Lib has dwindled. There are fewer questions and even less discussion. Second, the applications touting themselves, more or less, as “next generation” library catalog systems all have similar architectures. Ingest content from various sources. Normalize it into an internal data structure. Store the normalized data. Index the normalized data. Provide access to the index as well as services against the index such as tag, review, and Did You Mean? All of this is nice, but it really isn’t very “next generation”. Instead it is slightly more of the same. An index allows people to find, but people are still drinking from the proverbial fire hose. Anybody can find. In my opinion, the current definition of “next generation” does not go far enough. Library catalogs need to provide an increased number services against the content, not just services against the index. Compare & contrast. Do morphology against. Create word cloud from. Translate. Transform. Buy. Review. Discuss. Share. Preserve. Duplicate. Trace idea, citation, and/or author forwards & backwards. It is time to go beyond novel ways to search lists.
SRU is becoming more viable – SRU (Search/Retrieve via URL) is a Web Services-based protocol for searching databases/indexes. Send a specifically shaped URL to a remote HTTP server. Get back a specifically shaped response. SRU has been joined with a no-longer competing standard called OpenSearch in the form of an Abstract Protocol Definition, and the whole is on its way to becoming an OASIS standard. Just as importantly, an increasing number of the APIs supporting the external-facing OCLC Grid Services (WorldCat, Identities, Registries, Terminologies, Metadata Crosswalk) use SRU as the query interface. SRU has many advantages, but some of those advantages are also disadvantages. For example, its query language (CQL) is expressive, especially compared to OpenSearch or Google, but at the same time, it is not easy to implement. Second, the nature of SRU responses can range from rudimentary and simple to obtuse and complicated. More over, the response is always in XML. These factors make transforming the response for human consumption sometimes difficult to implement. Despite all these things, I think SRU is a step in the right direction.
The pendulum of data ownership is swinging – I believe it was Francis Bacon who said, “Knowledge is power”. In my epistemological cosmology, knowledge is based on information, and information is based on data. (Going the other way, knowledge leads to wisdom, but that is another essay.) Therefore, he who owns or has access to the data will ultimately have more power. Google increasingly has more data than just about anybody. They have a lot of power. OCLC increasingly “owns” the bibliographic data created by its membership. Ironically, this data — in both the case of Google and OCLC — is not freely available, even when the data was created for the benefit of the wider whole. I see this movement akin to the movement of a pendulum swinging one way and then the other. On my more pessimistic days I view it as a battle. On my calmer days I see it as a natural tendency, a give and take. Many librarians I know are in the profession, not for the money, but to support some sort of cause. Intellectual freedom. The right to read. Diversity. Preservation of the historical record. If I have a cause it then is about the free and equal access to information. This is why I advocate open access publishing, open source software, and Net Neutrality. When data and information is “owned” and “sold” an environment of information have’s and have not’s manifests itself. Ultimately, this leads to individual gain but not necessarily the improvement of the human condition as a whole.
The Digital Dark Age continues – We, as a society, are continuing to create a Digital Dark Age. Considering all of the aspects of librarianship, the folks who deal with preservation, conservation, and archives have the toughest row to hoe. It is ironic. On one hand there is more data and information available than just about anybody knows what to do with. On the other hand, much of this data and information will not be readable, let alone available, in the foreseeable future. Somebody is going to want to do research on the use of blogs and email. What libraries are archiving this data? We are writing reports and summaries in binary and proprietary formats. Such things are akin to music distributed on 8-track tapes. Where are the gizmos enabling us to read these formats? We increasingly license our most desired content — scholarly journal articles — and in the end we don’t own anything. With the advent of Project Gutenberg, Google Books, and the Open Content Alliance the numbers of freely available electronic books rival the collections of many academic libraries. Who is collecting these things? Do we really want to put all of our eggs into one basket and trust these entities to keep them for the long haul? The HathiTrust understand this phenomonon, and “Lot’s of copies keep stuff safe.” Good. In the current environment of networked information, we need to re-articulate the definition of “collection”.
Finally, regarding change. It manifests itself along a continuum. At one end is evolution. Slow. Many false starts. Incremental. At the other end is revolution. Fast. Violent. Decisive. Institutions and their behaviors change slowly. Otherwise they wouldn’t be the same institutions. Librarianship is an institution. Its behavior changes slowly. This is to be expected.
2009-02-09T04:03:00+00:00 Mini-musings: YAAC: Yet Another Alex Catalogue http://infomotions.com/blog/2009/02/yaac-yet-another-alex-catalogue/I have implemented another version of my Alex Catalogue of Electronic Texts, more specifically, I have dropped the use of one indexer and replaced it with Solr/Lucene. See http://infomotions.com/alex/ This particular implementation does not have all the features of the previous one. No spell check. No thesaurus. No query suggestions. On the other hand, it does support paging, and since it runs under mod_perl, it is quite responsive.
As always I am working on the next version, and you can see where I’m going at http://infomotions.com/sandbox/alex4/ Like the implementation above, this one runs under mod_perl and supports paging. Unlike the implementation above, it also supports query suggestions, a thesaurus, and faceted browsing. It also sports the means to view metadata details. Content-wise, it included images, journal titles, journal articles, and some content from the HathiTrust.
It would be great if I were to get some feedback regarding these implementations. Are they easy to use?
2009-02-03T01:30:53+00:00 Mini-musings: ISBN numbers http://infomotions.com/blog/2009/02/isbn-numbers/I’m beginning to think about ISBN numbers and the Alex Catalogue of Electronic Texts. For example, I can add ISBN numbers to Alex, link them to my (fledgling) LibraryThing collection, and display lists of recently added items here:
Interesting, but I think the list will change over time, as new things get added to my collection. It would be nice to link to a specific item. Hmm…
[openbook booknumber=”9781593082277″] On the other hand, I could exploit ISBN numbers and OpenLibrary using a WordPress plug-in called OpenBook Book Data by John Miedema. It displays cover art, a link to OpenLibrary as well as WorldCat
Again, very interesting. For more details, see the “OpenBook WordPress Plugin: Open Source Access to Bibliographic Data” in Code4Lib Journal.
A while ago I wrote a CGI script that took ISBN numbers as input, fed them to xISBN and/or ThingISBN to suggest alternative titles. I called it Send It To Me.
Then of course there is the direct link to Amazon.com.
I suppose it is nice to have choice.
2009-02-02T05:04:31+00:00 Mini-musings: Fun with WebService::Solr, Part III of III http://infomotions.com/blog/2009/01/fun-with-webservicesolr-part-iii-of-iii/This is the last of a three-part series providing an overview of a set of Perl modules called WebService::Solr. In Part I, WebService::Solr was introduced with two trivial scripts. Part II put forth two command line driven scripts to index and search content harvested via OAI. Part III illustrates how to implement an Search/Retrieve via URL (SRU) search interface against an index created by WebService::Solr.
![]()
Search/Retrieve via URL (SRU) is a REST-like Web Service-based protocol designed to query remote indexes. The protocol essentially consists of three functions or “operations”. The first, explain, provides a mechanism to auto-discover the type of content and capabilities of an SRU server. The second, scan, provide a mechanism to browse an index’s content much like perusing the back-of-a-book index. The third, searchRetrieve, provides the means for sending a query to the index and getting back a response. Many of the librarians in the crowd will recognize SRU as the venerable Z39.50 protocol redesigned for the Web.
During the past year, time has been spent joining the SRU community with the OpenSearch community to form a single, more unified set of Search Web Service protocols. OpenSearch has very similar goals to SRU — to provide standardized interfaces for searching indexes — but the techniques between it an SRU are different. Where OpenSearch’s query language is simple, SRU’s is expressive. Where OpenSearch returns an RSS-like data stream, SRU includes the ability to return just about any XML format. OpenSearch may be easier to implement, but SRU is suited for a wider number of applications. To bring SRU and OpenSearch together, and to celebrate similarities as opposed to differences, an OASIS Abstract Protocol Definition has been drafted defining how the searching of Web-based databases and indexes can be done in a standardized way.
SRU is an increasingly important protocol for the library community because of a growing number of the WorldCat Grid Services are implemented using SRU. The Grid supports indexes such lists of library holdings (WorldCat), name and subject authority files (Identities), as well as names of libraries (the Registry). By sending SRU queries to these services and mashing up the results with the output of other APIs, all sorts of library and bibliographic applications can be created.
Personally, I have been creating SRU interfaces to many of my indexes for about four years. I have created these interfaces against mailing list archives, OAI-harvested content, and MARC records. The underlying content has been indexed with swish-e, Plucene, KinoSearch, and now Lucene through WebService::Solr.
Ironic or not, I use yet another set of Perl modules — available on CPAN and called SRU — written by Brian Cassidy to implement my SRU servers. The form of my implementations is rather simple. Get the input. Determine what operation is requested. Branch accordingly. Do the necessary processing. Return a response.
The heart of my SRU implementation is a subroutine called search. It is within this subroutine where indexer-specific hacking takes place. For example and considering WebService::Solr:
sub search {

  # initialize
  my $query   = shift;
  my $request = shift;
  my @results;

  # set up Solr
  my $solr = WebService::Solr->new( SOLR );

  # calculate start record and number of records
  my $start_record = 0;
  if ( $request->startRecord ) { $start_record = $request->startRecord - 1 }
  my $maximum_records = MAX; $maximum_records = $request->maximumRecords
     unless ( ! $request->maximumRecords );

  # search
  my $response   = $solr->search( $query, {
                                  'start' => $start_record,
                                  'rows'  => $maximum_records });
  my @hits       = $response->docs;
  my $total_hits = $response->pager->total_entries;

  # display the number of hits
  if ( $total_hits ) {

    foreach my $doc ( @hits ) {

      # slurp
      my $id          = $doc->value_for(  'id' );
      my $name        = &escape_entities( $doc->value_for(  'title' ));
      my $publisher   = &escape_entities( $doc->value_for(  'publisher' ));
      my $description = &escape_entities( $doc->value_for(  'description' ));
      my @creator     = $doc->values_for( 'creator' );
      my $contributor = &escape_entities( $doc->value_for(  'contributor' ));
      my $url         = &escape_entities( $doc->value_for(  'url' ));
      my @subjects    = $doc->values_for( 'subject' );
      my $source      = &escape_entities( $doc->value_for(  'source' ));
      my $format      = &escape_entities( $doc->value_for(  'format' ));
      my $type        = &escape_entities( $doc->value_for(  'type' ));
      my $relation    = &escape_entities( $doc->value_for(  'relation' ));
      my $repository  = &escape_entities( $doc->value_for(  'repository' ));

      # full results, but included entities; hmmm...
      my $record  = '<srw_dc:dc xmlns="http://www.w3.org/TR/xhtml1/strict"
                      xmlns:dc="http://purl.org/dc/elements/1.1/"
                      xmlns:srw_dc="info:srw/schema/1/dc-v1.1">';
      $record .= '<dc:title>' .  $name . '</dc:title>';
      $record .= '<dc:publisher>' .  $publisher . '</dc:publisher>';
      $record .= '<dc:identifier>' .  $url . '</dc:identifier>';
      $record .= '<dc:description>' .  $description . '</dc:description>';
      $record .= '<dc:source>' . $source . '</dc:source>';
      $record .= '<dc:format>' .  $format . '</dc:format>';
      $record .= '<dc:type>' .  $type . '</dc:type>';
      $record .= '<dc:contributor>' .   $contributor . '</dc:contributor>';
      $record .= '<dc:relation>' .   $relation . '</dc:relation>';
      foreach ( @creator ) { $record .= '<dc:creator>' .  $_ . '</dc:creator>' }
      foreach ( @subjects ) { $record .= '<dc:subject>' . $_ . '</dc:subject>' }
      $record .= '</srw_dc:dc>';
      push @results, $record;

    }

  }

  # done; return it
  return ( $total_hits, @results );

}
The subroutine is not unlike the search script outlined in Part II of this series. First the query, SRU::Request object, results, and local Solr objects are locally initialized. A pointer to the first desired hit as well as the maximum number of records to return are calculated. The search is done, and the total number of search results is saved for future reference. If the search was a success, then each of the hits are looped through while stuffing them into an XML element named record and scoped with a Dublin Core name space. Finally, the total number of records as well as the records themselves are returned to the main module where they are added to an SRU::Response object and returned to the SRU client.
This particular implementation is pretty rudimentary, and it does not really exploit the underlying functionality of Solr/Lucene. For example, it does not support facets, spell check, suggestions, etc. On the other hand, it does support paging, and since it is implemented under mod_perl it is just about as fast as it can get on my hardware.
Give the implementation a whirl. The underlying index includes about 20,000 records of various electronic books (from the Alex Catalogue of Electronic Texts, Project Gutenberg, and the HathiTrust), photographs (from my own adventures), journal titles, and journal articles (both from the Directory of Open Access Journals).
It is difficult for me to overstate the number of possibilities for librarianship considering the current information environment. Data and information abound! Learning has not stopped. It is sexy to be in the information business. All of the core principles of librarianship are at play in this environment. Collection. Preservation. Organization. Dissemination. The application of relational databases combined with indexers provide the means to put into practice these core principles in today’s world.
The Solr/Lucene combination is an excellent example, and WebService::Solr is just one way to get there. Again, I don’t expect every librarian to know and understand all of things outlined in this series of essays. On the other hand, I do think it is necessary for the library community as a whole to understand this technology in the same way they understand bibliography, conservation, cataloging, and reference. Library schools need to teach it, and librarians need to explore it.
Finally, plain text versions of this series’ postings, the necessary Solr schema.xml files, as well as all the source code is available for downloading. Spend about an hour putzing around. I’m sure you will come out the other end learning something.
2009-01-23T01:46:26+00:00 Readings: Why you can't find a library book in your search engine http://www.guardian.co.uk/technology/2009/jan/22/library-search-engines-books "Finding a book at your local library should just involve a simple web search. But thanks to a US cataloguing site, that is far from the case." -- Includes a very important idea. Services, not data sell your expertise, not the stuff of unlimited supply.In this posting (Part II), I will demonstrate how to use WebService::Solr to create and search a more substantial index, specifically an index of metadata describing the content of the Directory of Open Access Journals. Part I of these series introduced Lucene, Solr, and WebService::Solr with two trivial examples. Part III will describe how to create an SRU interface using WebService::Solr.
 The Directory of Open Access Journals (DOAJ) is a list of freely available scholarly journals. As of this writing the Directory contains approximately 3,900 titles organized into eighteen broad categories such as Arts and Architecture, Law and Political Science, and General Science. Based on my tertiary examination, a large percentage of the titles are in the area of medicine.
Not only is it great that such a directory exists, but it is even greater that the Directory’s metadata — the data describing the titles in the Directory — is available for harvesting via OAI-PMH. While the metadata is rather sparse, it is more than adequate for creating rudimentary MARC records for importing into library catalogs, or better yet, incorporating into some other Web service. (No puns intended.)
In my opinion, the Directory is a especially underutilized. For example, not only are the Directory’s journal titles available for download, but so is the metadata of about 25,000 journal articles. Given these two things (metadata describing titles as well as articles) it would be entirely possible to seed a locally maintained index of scholarly journal content and incorporate that into library “holdings”. But alas, that is another posting and another story.
It is almost trivial to create a search engine against DOAJ content when you know how to implement an OAI-PMH harvester and indexer. First, you need to know the OAI-PMH root URL for the Directory, and it happens to be http://www.doaj.org/oai Second, you need to peruse the OAI-PMH output sent by the Directory and map it to fields you will be indexing. In the case of this demonstration, the fields are id, title, publisher, subject, and URL. Consequently, I updated the schema from the first demonstration to look like this:
<!-- DC-like fields -->
<fields>
  <field name="id" type="string" indexed="true" stored="true" required="true" />
  <field name="title" type="text" indexed="true" stored="true" />
  <field name="publisher" type="text" indexed="true" stored="true" />
  <field name="subject" type="text" indexed="true" stored="true" multiValued="true" />
  <field name="url" type="text" indexed="false" stored="true" />
  <field name="text" type="text" indexed="true" stored="false" multiValued="true" />
  <field name="facet_subject" type="string" indexed="true" stored="true" multiValued="true" />
</fields>

<!-- key; for updating purposes -->
<uniqueKey>id</uniqueKey>

<!-- for non-field searches -->
<defaultSearchField>text</defaultSearchField>

<!-- AND is more precise -->
<solrQueryParser defaultOperator="AND" />

<!-- what gets searched by default -->
<copyField source="title" dest="text" />
<copyField source="subject" dest="text" />
<copyField source="publisher" dest="text" />
The astute reader will notice the addition of a field named facet_subject. This field, denoted as a string and therefore not parsed by the indexer, is destined to be a browsable facet in the search engine. By including this sort of field in the index it is be possible to return results like, “Your search identified 100 items, and 25 of them are associated with the subject Philosophy.” A very nice feature. Think of it as the explicit exploitation of controlled vocabulary terms for search results. Facets turn the use of controlled vocabularies inside out. The library community has something to learn here.
Once the schema was updated, I wrote the following script to index the journal title content from the Directory:
#!/usr/bin/perl

# index-doaj.pl - get doaj content and index it

# Eric Lease Morgan <eric_morgan@infomotions.com>
# January  12, 2009 - version 1.0


# define
use constant OAIURL => 'http://www.doaj.org/oai';
use constant PREFIX => 'oai_dc';
use constant SOLR   => 'http://localhost:210/solr';

# require
use Net::OAI::Harvester;
use strict;
use WebService::Solr;

# initialize oai and solr
my $harvester = Net::OAI::Harvester->new( baseURL => OAIURL );
my $solr      = WebService::Solr->new( SOLR );

# get all records and loop through them
my $records = $harvester->listAllRecords( metadataPrefix => PREFIX );
my $id      = 0;
while ( my $record = $records->next ) {

  # increment
  $id++;
  last if ( $id > 100 );  # comment this out to get everything

  # extract the desired metadata
  my $metadata     = $record->metadata;
  my $identifier   = $record->header->identifier;
  my $title        = $metadata->title      ? &strip( $metadata->title )     : '';
  my $url          = $metadata->identifier ? $metadata->identifier          : '';
  my $publisher    = $metadata->publisher  ? &strip( $metadata->publisher ) : '';
  my @all_subjects = $metadata->subject    ? $metadata->subject             : ();

  # normalize subjects
  my @subjects = ();
  foreach ( @all_subjects ) {

    s/DoajSubjectTerm: //;  # remove DOAJ label
    next if ( /LCC: / );    # don't want call numbers
    push @subjects, $_;

  }

  # echo
  print "      record: $id\n";
  print "  identifier: $identifier\n";
  print "       title: $title\n";
  print "   publisher: $publisher\n";
  foreach ( @subjects ) { print "     subject: $_\n" }
  print "         url: $url\n";
  print "\n";

  # create solr/lucene document
  my $solr_id        = WebService::Solr::Field->new( id        => $identifier );
  my $solr_title     = WebService::Solr::Field->new( title     => $title );
  my $solr_publisher = WebService::Solr::Field->new( publisher => $publisher );
  my $solr_url       = WebService::Solr::Field->new( url       => $url );

  # fill up a document
  my $doc = WebService::Solr::Document->new;
  $doc->add_fields(( $solr_id, $solr_title, $solr_publisher, $solr_url ));
  foreach ( @subjects ) {

    $doc->add_fields(( WebService::Solr::Field->new( subject => &strip( $_ ))));
    $doc->add_fields(( WebService::Solr::Field->new( facet_subject => &strip( $_ ))));

  }

  # save; no need for commit because it comes for free
  $solr->add( $doc );

}

# done
exit;


sub strip {

  # strip non-ascii characters; bogus since the OAI output is suppose to be UTF-8
  # see: http://www.perlmonks.org/?node_id=613773
  my $s =  shift;
  $s    =~ s/[^[:ascii:]]+//g;
  return $s;

}
The script is very much like the trivial example from Part I. It first defines a few constants. It then initializes both an OAI-PMH harvester as well as a Solr object. It then loops through each record of the harvested content extracting the desired data. The subject data, in particular, is normalized. The data is then inserted into WebService::Solr::Field objects which in turn are inserted into WebService::Solr::Document objects and added to the underlying Lucene index.
Searching the index is less trivial than the example in Part I because of the facets, below:
#!/usr/bin/perl

# search-doaj.pl - query a solr/lucene index of DOAJ content

# Eric Lease Morgan <eric_morgan@infomotions.com>
# January 12, 2009 - version 1.0


# define
use constant SOLR => 'http://localhost:210/solr';
use constant ROWS => 100;
use constant MIN  => 5;

# require
use strict;
use WebService::Solr;

# initalize
my $solr = WebService::Solr->new( SOLR );

# sanity check
my $query = $ARGV[ 0 ];
if ( ! $query ) {

  print "Usage: $0 <query>\n";
  exit;

}

# search; get no more than ROWS records and subject facets occuring MIN times
my $response  = $solr->search( $query, { 'rows'           => ROWS,
                                         'facet'          => 'true',
                                         'facet.field'    => 'facet_subject',
                                         'facet.mincount' => MIN });

# get the number of hits, and start display
my $hit_count = $response->pager->total_entries;
print "Your search ($query) found $hit_count document(s).\n\n";

# extract subject facets, and display
my %subjects = &get_facets( $response->facet_counts->{ facet_fields }->{ facet_subject } );
if ( $hit_count ) {

  print "  Subject facets: ";
  foreach ( sort( keys( %subjects ))) { print "$_ (" . $subjects{ $_ } . "); " }
  print "\n\n";

}

# display each hit
my $index = 0;
foreach my $doc ( $response->docs ) {

  # slurp
  my $id        = $doc->value_for( 'id' );
  my $title     = $doc->value_for( 'title' );
  my $publisher = $doc->value_for( 'publisher' );
  my $url       = $doc->value_for( 'url' );
  my @subjects  = $doc->values_for( 'subject' );

  # increment
  $index++;

  #echo
  print "     record: $index\n";
  print "         id: $id\n";
  print "      title: $title\n";
  print "  publisher: $publisher\n";
  foreach ( @subjects ) { print "    subject: $_\n" }
  print "        url: $url\n";
  print "\n";

}

# done
exit;


sub get_facets {

  # convert array of facet/hit-count pairs into a hash; obtuse
  my $array_ref = shift;
  my %facet;
  my $i = 0;
  foreach ( @$array_ref ) {

    my $k = $array_ref->[ $i ]; $i++;
    my $v = $array_ref->[ $i ]; $i++;
    next if ( ! $v );
    $facet{ $k } = $v;

  }

  return %facet;

}
The script needs a bit of explaining. Like before, a few constants are defined. A Solr object is initialized, and the existence of a query string is verified. The search method makes use of a few options, specifically, options to return ROW number of search results as well as specific facets occurring MIN number of times. The whole thing is stuffed into a WebService::Solr::Response object, which is, for better or for worse, a JSON data structure. Using the pager method against the response object, the number hits are returned which is assigned to a scalar and displayed.
The trickiest part of the script is the extraction of the facets done by the get_facets subroutine. In WebService::Solr, facets names and their values are returned in an array reference. get_facets converts this array reference into a hash, and is then displayed. Finally, each WebService::Solr::Response object is looped through and echoed. Notice how the the subject field is handled. It contains multiple values which are retrieved through the values_for method which returns an array, not a scalar. Below is sample output for the search “library”:
Your search (library) found 84 document(s).

  Subject facets: Computer Science (7); Library and Information
Science (68); Medicine (General) (7); information science (19);
information technology (8); librarianship (16); libraries (6);
library and information science (14); library science (5);

     record: 1
         id: oai:doaj.org:0029-2540
      title: North Carolina Libraries
  publisher: North Carolina Library Association
    subject: libraries
    subject: librarianship
    subject: media centers
    subject: academic libraries
    subject: Library and Information Science
        url: http://www.nclaonline.org/NCL/

     record: 2
         id: oai:doaj.org:1311-8803
      title: Bibliosphere
  publisher: NBU Library
    subject: Bulgarian libraries
    subject: librarianship
    subject: Library and Information Science
        url: http://www.bibliosphere.eu/

     record: 3
         id: ...
In a hypertext environment, each of the titles in the returned records would be linked with their associated URLs. Each of the subject facets listed at the beginning of the output would be hyperlinked to subsequent searches combining the original query plus the faceted term, such as “library AND subject:’Computer Science'”. An even more elaborate search interface would allow the user to page through search results and/or modify the value of MIN to increase or decrease the number of relevant facets displayed.
Librarians love lists. We create lists of books. Lists of authors of books. Lists of journals. Lists of journal articles. Recently we have become enamored with lists of Internet resources. We pay other people for lists, and we call these people bibliographic index vendors. OCLC’s bread and butter is a list of library holdings. Librarians love lists.
Lists aren’t very useful unless they are: 1) short, 2) easily sortable, or 3) searchable. For the most part, the profession has mastered the short, sortable list, but we are challenged when it comes to searching our lists. We insist on using database applications for this, even when we don’t know how to design a (relational) database. Our searching mentality is stuck in the age of mediated online search services such as DIALOG and BRS. The profession has not come to grips with the advances in information retrieval. Keyword searching, as opposed to field searching, has its merits. Tools like Lucene, KinoSearch, Zebra, swish-e, and a host of predecessors like Harvest, WAIS, and Veronica all facilitate(d) indexing/searching.
As well as organizing information — the creation of lists — the profession needs to learn how to create its own indexes and make them searchable. While I do not advocate every librarian know how to exploit things like WebService::Solr, I do advocate the use of these technologies to a much greater degree. Without them the library profession will always be a follower in the field of information technology as opposed to a leader.
This posting, Part II of III, illustrated how to index and search content from an OAI-PMH data repository. It also advocated the increased use of indexer/search engines by the library profession. In the next and last part of this series WebService::Solr will be used as a part of an Search/Retrieve via URL (SRU) interface.
Special thanks go to Brian Cassidy and Kirk Beers who wrote WebService::Solr. Additional thanks go to Ed Summers and Thomas Berger who wrote Net::OAI::Harvester. I am simply standing on the shoulders of giants.
2009-01-12T23:50:41+00:00 Mini-musings: Mr. Serials is dead. Long live Mr. Serials http://infomotions.com/blog/2009/01/mr-serials-is-dead-long-live-mr-serials/This posting describes the current state of the Mr. Serials Process.
Round about 1994 when I was employed by the North Carolina State University Libraries, Susan Nutter, the Director, asked me to participate in an ARL Collection Analysis Project (CAP). The goal of the Project was to articulate a mission/vision statement for the Libraries fledgling Collection Development Department. “It will be a professional development opportunity”, she told me. I don’t think she knows how much of an opportunity it really was.
Through the CAP I, along with a number of others (Margaret Hunt, John Abbott, Caroline Argentati, and Orion Pozo) became acutely aware of the “serials pricing crisis”. Academic writes article. Article gets peer-reviewed. Publisher agrees to distribute article in exchange for copyright. Article gets published in journal. Library subscribes to journal at an ever-increasing price. Academic reads journal. Repeat.
The whole “crisis” made me frustrated (angry), and others were frustrated too. Why did prices need to be increasing so dramatically? Why couldn’t the Academe coordinate peer-review? Why couldn’t the Internet be used a distribution medium? Some people tried to answer some of these questions differently than the norm, and the result was the creation of electronic journals distributed via email such as the venerable Bryn Mawr Classical Review, Psycoloquy, Postmodern Culture, and PACS Review.
Given this environment, I sought to be a part of the solution instead of perpetuating the problem. I created the Mr. Serials Process — a set of applications/scripts that collected, archived, indexed, and re-distributed sets of electronic journals. I figured I could demonstrate to the library and academic communities that if everybody does their part, then there would less of need for commercial publishers — entities who were exploiting the system and more interested in profit than the advancement of knowledge. Mr. Serials was “born” around 1994 and documented in an article from Serials Review. Mr. Serial, now 14-years old, would be considered a child by most people’s standards. Yet, fourteen years is a long time in Internet years.
For all intents and purposes, Mr. Serials is dead because his process was based on the distribution of electronic serials via email. His death was long and drawn out. The final nail driven into his coffin came when ACQNET, one of the original “journals” he collected, moved from Appalachian State University to iBiblio a few months ago. After the move Mr. Serials was no longer considered the official archivist of the content, and his era had passed.
This is not a big deal. Change happens. Processes evolve. Besides, Mr. Serials created a legacy for himself, a set of early electronic serial literature exemplifying the beginnings of networked scholarly communication which includes more than thirty titles archived at serials.infomotions.com.
At the same time, Mr. Serials is alive and well. Maybe, like many people his age, he is going through an adolescence.
In the middle 1990s electronic journals were distributed via email. As such the Mr. Serials Process used procmail to filter incoming mail. He then used a Hypercard program to create configuration files denoting the locations of bibliographic data in journal titles. He then used a Perl program reading the configuration files, automatically extracting the bibliographic information from each issue, removing the email header, and saving the resulting journal article in a specified location. Initially, the whole collection was made available via a Gopher server and indexed with WAIS. Later, the collection was made available via an HTTP server and other indexing technologies were used but many of them are broken.
Somewhere along the line, some of the “journals” became mailing lists, and the Process was modified to take advantage of an archiving program called Hypermail. Like the original Process, the archived materials are accessible via a Web server and indexed with some sort of search engine technology. (There have been so many.) With the movement of ACQNET, the original “journals” have all gone away, but Mr. Serials has picked up a few mailing lists along the way, notably colldv-l, Code4LIb, and NGC4Lib. Consequently, Mr. Serials is not really dead, just transformed.
A lot of the credit goes to procmail, Hypermail, Web servers, and indexers. Procmail reads incoming mail and processes it accordingly. File it here. File it there. Delete it. Send it off to another process. Hypermail makes pretty email archives which are more or less configurable. It allows one to keep email messages in their original RFC 822 (mbox) format and reuse them for many purposes. We all know what HTTP servers do. Indexers complement the Hypermail process by providing searchable interfaces to the collection. The indexer used against colldv-l, Code4Lib, and NGC4Lib is called KinoSearch and is implemented through an SRU interface.
Mr. Serials is a modern day library process. It has a set of collection development goals. It acquires content. It organizes content. It archives and preserves content. It redisseminates content. The content it currently collects may not be extraordinarily scholarly, but someday somebody is going to want it. It is a special collection. Much if its success is a testiment to open source software. All the tools it uses are open source. In fact most of them were distributed as open source even before the phrase was coined.
Long live Mr. Serials.
2009-01-12T03:50:17+00:00 Mini-musings: Fun with WebService::Solr, Part I of III http://infomotions.com/blog/2009/01/fun-with-webservicesolr-part-i-of-iii/

This posting (Part I) is an introduction to a Perl module called WebService::Solr. In it you will learn a bit of what Solr is, how it interacts with Lucene (an indexer), and how to write two trivial Perl scripts: 1) an indexer, and 2) a search engine. Part II of this series will introduce less trivial scripts — programs to index and search content from the Directory of Open Access Journals (DOAJ). Part III will demonstrate how to use WebService::Solr to implement an SRU interface against the index of DOAJ content. After reading each Part you should have a good overview of what WebService::Solr can do, but more importantly, you should have a better understanding of the role indexers/search engines play in the world of information retrieval.
I must admit, I’m coming to the Solr party at least one year late, and as you may or may not know, Solr is a Java-based, Web Services interface to the venerable Lucene — the current gold standard when it comes to indexers/search engines. In such an environment, Lucene (also a Java-based system) is used to first create inverted indexes from texts or numbers, and second, provide a means for searching the index. Solr is a Web Services interface to Lucene. Instead of writing applications reading and writing Lucene indexes directly, you can send Solr HTTP requests which are parsed and passed on to Lucene. For example, one could feed Solr sets of metadata describing, say, books, and provide a way to search the metadata to identify items of interest. (“What a novel idea!”) Using such a Web Servcies technique the programmer is free to use the programming/scripting language of their choice. No need to know Java, although Java-based programs would definitely be faster and more efficient.
For better or for worse, my programming language of choice is Perl, and upon perusing CPAN I discovered WebService::Solr — a module making it easy to interface with Solr (and therefore Lucene). After playing with WebService::Solr for a few days I became pretty impressed, thus, this posting.
Installing Solr is relatively easy. Download the distribution. Save it in a convenient location on your file system. Unpack/uncompress it. Change directories to the example directory, and fire up Solr by typing java -jar start.jar at the command line. Since the distribution includes Jetty (a pint-sized HTTP server), and as long as you have not made any configuration changes, you should now be able to connect to your locally hosted Solr administrative interface through your favorite Web browser. Try, http://localhost:8983/solr/
When it comes to configuring Solr, the most important files are found in the conf directory, specifically, solrconfig.xml and schema.xml. I haven’t tweaked the former. The later denotes the types and names of fields that will ultimately be in your index. Describing in detail the in’s and out’s of solrconfig.xml and schema.xml are beyond the scope of this posting, but for our purposes here, it is important to note two things. First I modified schema.xml to include the following Dublin Core-like fields:
  <!-- a set of "Dublin Core-lite" fields -->
  <fields>
    <field name="id" type="string" indexed="true" stored="true" required="true" />
    <field name="title" type="text" indexed="true" stored="true" />
   <field name="text" type="text" indexed="true" stored="false" />
  </fields>

  <!-- what field is the key, very important! -->
  <uniqueKey>id</uniqueKey>

  <!-- field to search by default; the power of an index -->
  <defaultSearchField>text</defaultSearchField>

  <!-- how to deal with multiple terms -->
  <solrQueryParser defaultOperator="AND" />

  <!-- copy content into the default field -->
  <copyField source="title" dest="text" />
Second, I edited a Jetty configuration file (jetty.xml) so it listens on port 210 instead of the default port, 8983. “Remember Z39.50?”
There is a whole lot more to configuring Solr than what is outlined above. To really get a handle on the indexing process the Solr documentation is required reading.
Written by Brian Cassidy and Kirk Beers, WebService::Solr is a set Perl modules used to interface with Solr. Create various WebService::Solr objects (such as fields, documents, requests, and responses), and apply methods against them to create, modify, find, add, delete, query, and optimize aspects of your underlying Lucene index.
Since WebService::Solr requires a large number of supporting modules, installing WebService::Solr is best done with using CPAN. From the CPAN command line, enter install WebService::Solr. It worked perfectly for me.
My first WebService::Solr script, an indexer, is a trivial example, below:
 #!/usr/bin/perl

 # trivial-index.pl - index a couple of documents

 # define
 use constant SOLR => 'http://localhost:210/solr';
 use constant DATA => ( 'Hello, World!', 'It is nice to meet you.' );

 # require
 use strict;
 use WebService::Solr;

 # initialize
 my $solr = WebService::Solr->new( SOLR );

 # process each data item
 my $index = 0;
 foreach ( DATA ) {

   # increment
   $index++;

   # populate solr fields
   my $id  = WebService::Solr::Field->new( id  => $index );
   my $title = WebService::Solr::Field->new( title => $_ );

   # fill a document with the fields
   my $doc = WebService::Solr::Document->new;
   $doc->add_fields(( $id, $title ));

   # save
   $solr->add( $doc );
   $solr->commit;

 }

 # done
 exit;
To elaborate, the script first defines the (HTTP) location of our Solr instance as well as array of data containing two elements. It then includes/requires the necessary Perl modules. One to keep our programming technique honest, and the other is our reason de existence. Third, a WebService::Solr object is created. Fourth, a pointer is initialized, and a loop instantiated reading each data element. Inside the loop the pointer is incremented and local WebService::Solr::Field objects are created using the values of the pointer and the current data element. The next step is to instantiate a WebService::Solr:Document object and fill it up with the Field objects. Finally, the Document is added to the index, and the update is committed.
If everything went according to plan, the Lucene index should now contain two documents. The first with an id equal to 1 and a title equal to “Hello, World!”. The second with an id equal to 2 and a title equal to “It is nice to meet you.” To verify this you should be able to use the following script to search your index:
  #!/usr/bin/perl

  # trivial-search.pl - query a lucene index through solr

  # define
  use constant SOLR => 'http://localhost:210/solr';

  # require
  use strict;
  use WebService::Solr;

  # initialize
  my $solr = WebService::Solr->new( SOLR );

  # sanity check
  my $query = $ARGV[ 0 ];
  if ( ! $query ) {

    print "Usage: $0 <query>\n";
    exit;

  }

  # search & get hits
  my $response = $solr->search( $query );
  my @hits = $response->docs;

  # display
  print "Your search ($query) found " . ( $#hits + 1 ) . " document(s).\n\n";
  foreach my $doc ( @hits ) {

    # slurp
    my $id    = $doc->value_for( 'id' );
    my $title = $doc->value_for( 'title' );

    # echo
    print "     id: $id\n";
    print "  title: $title\n";
    print "\n";

  }
Try queries such as hello, “hello OR meet”, or “title: world” will return results. Because the field named text includes the content of the title field, as per our definition, queries without field specifications default to the text field. Nice. The power of an index.
Here is how the script works. It first denotes the location of Solr. It then includes/requires the necessary modules. Next, it creates a WebService::Solr object. Fourth, it makes sure there is a query on the command line. Fifth, it queries Solr creating a WebService::Solr::Response object, and this object is queried for an array of hits. Finally, the hits are looped through, creating and displaying the contents of each WebService::Solr::Document object (hit) found.
This posting provided an overview of Lucene, Solr, and a set of Perl modules called WebService::Solr. It also introduced the use of the modules to index content and search it. Part II will provide a more in-depth introduction to the use of WebService::Solr and Solr in general.
2009-01-05T23:23:17+00:00 Readings: LCSH, SKOS, and Linked Data http://dcpapers.dublincore.org/ojs/pubs/article/viewFile/916/912 "A technique for converting Library of Congress Subject Headings MARCXML to Simple Knowledge Organization System (SKOS) RDF is described. Strengths of the SKOS vocabulary are highlighted, as well as possible points for extension, and the integration of other semantic web vocabularies such as Dublin Core. An application for making the vocabulary available as linked- data on the Web is also described."I took time yesterday to visit a few colleagues at Ball State University.
 Ball State, the movie! |
Over the past few months the names of some fellow librarians at Ball State University repeatedly crossed my path. The first was Jonathan Brinley who is/was a co-editor on Code4Lib Journal. The second was Kelley McGrath who was mentioned to me as top-notch cataloger. The third was Todd Vandenbark who was investigating the use of MyLibrary. Finally, a former Notre Damer-er, Marcy Simons, recently started working at Ball State. Because Ball State is relatively close, I decided to take the opportunity to visit these good folks during this rather slow part of the academic year.
After I arrived we made our way to lunch. We compared and contrasted our libraries. For example, they had many — about say 200 — public workstations. The library was hustling and bustling. About 18,000 students go to Ball State and seemingly many of them go home on the weekends. Ball State was built with money from the canning jar industry, but upon a visit to the archives no canning jars could be seen. I didn’t really expect any.
Over lunch we talked a lot about FRBR and the possibilities of creating work-level records from the myriad of existing item-level (MARC) records. Since the work-related content is often times encoded as free text in some sort of 500 field, I wonder how feasible the process would be. Ironically, an article, “Identifying FRBR Work-Level Data in MARC Bibliographic Records for Manifestations of Moving Images” by Kelley had been published the day before in Code4Lib. Boy, it certainly is a small world.
I always enjoy “busman’s holidays” and visiting other libraries. I find we oftentimes have more things in common than differences.
2008-12-17T17:17:43+00:00 Mini-musings: A Day with OLE http://infomotions.com/blog/2008/12/a-day-with-ole/This posting documents my experience at Open Library Environment (OLE) project workshop that took place at the University of Chicago, December 11, 2008. In a sentence, the workshop provided an opportunity to describe and flowchart a number of back-end library processes in an effort to help design an integrated library system.
 full-scale gargoyle |
As you may or may not know, the Open Library Environment is a Mellon-funded initiative in cooperation with a growing number of academic libraries to explore the possibilities of building an integrated library system. Since this initiative is more about library back-end and business processes (acquisitions, cataloging, circulation, reserves, ILL, etc.), it is complimentary to the the eXtensible Catalog (XC) project which is more about creating a “discovery” layer against and on top of existing integrated library system’s public access interfaces.
Why do this sort of work? There are a few reasons. First, vendor consolidation makes the choices of commercial solutions few. Not a good idea; we don’t like monopolies. Second, existing applications do not play well with other (campus) applications. Better integration is needed. Third, existing library systems are designed for print materials, but with the advent of greater and greater amounts of electronic materials the pace of change has been inadequate and too slow.
OLE is an effort to help drive and increase change in Library Land, and this becomes even more apparent when you consider all of the Mellon-related library initiatives it is supporting: Portico (preservation), JSTOR and ArtSTOR (collections), XC (discovery), OLE (business processes/technical services).
The workshop took place at the Regenstein Library (University of Chicago). There were approximately thirty or forty attendees from universities such as Grinnell, Indiana, Notre Dame, Minnesota, Illinois, Iowa, and of course, Chicago.
After being given a short introduction/review of what OLE is and why, we were broken into four groups (cataloging/authorities, circulation/reserves/ILL, acquisitions, and serials/ERM), and we were first asked to enumerate the processes of our respective library activities. We were then asked to classify these activities into four categories: core process, shifting/changing process, processes that could be stopped, and processes that we wanted but don’t have. All of us, being librarians, were not terribly surprised by the enumerations and classifications. The important thing was to articulate them, record them, and compare them with similar outputs from other workshops.
After lunch (where I saw the gargoyle and made a few purchases at the Seminary Co-op Bookstore) we returned to our groups to draw flowcharts of any of our respective processes. The selected processes included checking in a journal issue, checking in an electronic resource, keeping up and maintaining a file of borrowers, acquiring a firm order book, cataloging a rare book, and cataloging a digital version of a rare book. This whole flowcharting process was amusing since the workflows of each participants’ library needed to be amalgamated into a single processes. “We do it this way, and you do it that way.” Obviously there is more than one way to skin a cat. In the end the flowcharts were discussed, photographed, and packaged up to ship back to the OLE home planet.
The final, wrap-up event of the day was a sharing and articulation of what we really wanted in an integrated library system. “If there one thing you could change, then what would it be?” Based on my notes, the most popular requests were:
Other wish list items I thought were particularly interesting included: integrating the collections process into the system, making sure the application was operating system independent, and implementing Semantic Web features.
I’m glad I had the opportunity to attend. It gave me a chance to get a better understanding of what OLE is all about, and I saw it as a professional development session where I learned more about where things are going. The day’s events were well-structured, well-organized, and manageable given the time restraints. I only regret there was too little “blue skying” by attendees. Much of the time was spent outlining how our work is done now. I hope any future implementation explores new ways of doing things in order to take better advantage of the changing environment as opposed to simply automating existing processes.
2008-12-13T13:20:27+00:00 Mini-musings: ASIS&T Bulletin on open source software http://infomotions.com/blog/2008/12/asist-bulletin-on-open-source-software/The following is a verbatim duplication of an introduction I wrote for a special issue of the ASIS&T Bulletin on open source software in libraries. I appreciate the opportunity to bring the issue together because I sincerely believe open source software provides a way for libraries to have more control over their computing environment. This is especially important for a profession that is about learning, teaching, scholarship, data, information, and knowledge. Special thanks goes to Irene L. Travis who brought the opportunity to my attention. Thank you.
It is a privilege and an honor to be the guest editor for this special issue of the Bulletin of the American Society for Information Science and Technology on open source software. In it you will find a number of articles describing open source software and how it has been used in libraries. Open source software or free and open source software is defined and viewed in a variety of ways, and the definition will be refined and enriched by our authors. However, very briefly, for those readers unfamiliar with it, open source software is software that is distributed under one of a number of licensing arrangements that (1) require that the software’s source code be made available and accessible as part of the package and (2) permit the acquirer of the software to modify the code freely to fit their own needs provided that, (3) if they distribute the software modifications they create, they do so under an open source license. If these basic elements are met, there is no requirement that the resulting software be distributed at no cost or non-commercially, although much widely used open source software such as the web browser Firefox is also distributed without charge.
The articles begin with Scot Colford’s “Explaining Free and Open Source Software,” in which he describes how the process of using open source software is a lot like baking a cake. He goes on to outline how open source software is all around us in our daily computing lives.
Karen Schneider’s “Thick of the Fray” lists some of the more popular open source software projects in libraries and describes how these sorts of projects would not have been nearly as feasible in an era without the Internet.
Marshall Breeding’s “The Viability of Open Source ILS” provides a balanced comparison between open source software integrated library systems and closed source software integrated library systems. It is a survey of the current landscape.
Bob Molyneux’s “Evergreen in Context” is a case study of one particular integrated library system, and it is a good example of the open source adage “scratching an itch.”
In “The Development and Usage of the Greenstone Digital Library Software,” Ian Witten provides an additional case study but this time of a digital library application. It is a good example of how many different types of applications are necessary to provide library service in a networked environment.
Finally, Thomas Krichel expands the idea of open source software to include open data and open libraries. In “From Open Source to Open Libraries,” you will learn that many of the principles of librarianship are embodied in the principles of open source software. In a number of ways, librarianship and open source software go hand-in-hand.
Open source software is about quite a number of things. It is about taking more complete control over one’s computer infrastructure. In a profession that is a lot about information, this sort of control is increasingly necessary. Put another way, open source software is about “free.” Not free as in gratis, but free as in liberty. Open source software is about community – the type of community that is only possible in a globally networked computer environment. There is no way any single vendor of software will be able to gather together and support all the programmers that a well-managed open source software project can support. Open source software is about opportunity and flexibility. In our ever-dynamic environment, these characteristics are increasingly important.
Open source software is not a panacea for libraries, and while it does not require an army of programmers to support it, it does require additional skills. Just as all libraries – to some degree or another – require collection managers, catalogers and reference librarians, future-thinking libraries require people who are knowledgeable about computers. This background includes knowledge of relational databases, indexers, data formats such as XML and scripting languages to glue them together and put them on the web. These tools are not library-specific, and all are available as open source.
Through reading the articles in this issue and discussing them with your colleagues, you should become more informed regarding the topic of open source software. Thank you for your attention and enjoy.
2008-12-12T13:37:20+00:00 Mini-musings: Fun with the Internet Archive http://infomotions.com/blog/2008/12/fun-with-the-internet-archive/I’ve been having some fun with Internet Archive content.
 More specifically, I have created a tiny system for copying scanned materials locally, enhancing it with a word cloud, indexing it, and providing access to whole thing. There is how it works:
Attached are all the scripts I’ve written for the as-of-yet-unamed process, and you can try the demonstration at http://dewey.library.nd.edu/hacks/ia/search.cgi, but remember, there are only about two dozen items presently in the index.
There are many ways the system can be improved, and they can be divided into two types: 1) servcies against the index, and 2) services against the items. Services against the index include things like paging search results, making the interface “smarter”, adding things like faceted browse, implementing an advaced search, etc.
Services against the items interest me more. Given the full text it might be possible to do things like: compare & contrast documents, cite documents, convert documents into many formats, trace idea forward & backward, do morphology against words, add or subtract from “my” collection, search “my” collection, share, annotate, rank & review, summarize, create relationships between documents, etc. These sort of features I believe to be a future direction for the library profession. It is more than just get the document; it is also about doing things with them once they are acquired. The creation of the word clouds is a step in that direction. It assists in the compare & contrast of documents.
The Internet Archive makes many of these things possible because they freely distribute their content — including the full text.
InternetArchive++
I don’t exactly know why, but I enjoy snow blowing.
 snow blower |
I think it began when I was college. My freshman year I stayed on during the January earning money from Building & Grounds. For much of the time they simply said, “Go shovel some snow.” It was quiet, peaceful, and solitary. It was physical labor. It was a good time to think, and the setting was inspirational.
A couple of years later, in order to fulfill a graduation requirement, I needed to design and complete a “social practicum”. I decided to shovel snow for my neighbors. Upon asking them for permission, I got a lot of strange looks. “Why would you want to shovel my snow?”, they’d ask. I’d say, “Because I am more able to do it than you. I’m just being helpful and providing a social service.” Surprisingly, many people did not take me up on my offer, but a few did.
I now live and work in northern Indian only forty-five minutes from Lake Michigan where “lake effect” snow is common. I own a big, bad snowblower. It gives me a sense of power, and even though it disturbs the quiet, I enjoy the process of cleaning my driveway and sidewalk. I enjoy trying to figure out the most effectient way to get the job done. I enjoy it so much I even snow blow around the block.
What does this have to do with librarianship? In reality, not a whole lot. On the other hand, one of the aspects of librarianship, especially librarianship in public libraries, is community service — providing means for improving society. My clearing of snow for my neighbors is done in a similar vein, and it works for me. I can do something for my fellow man and have fun at the same time. Weird?
P.S. Mowing the grass gives me the same sort of feelings.
This is a simple word cloud of Edgar Rice Burroughs’ Tarzan of the Apes:
[openbook]978-1593082277[/openbook]
tarzan little clayton great jungle before d’arnot jane back about cabin mr toward porter professor saw again time philander eyes strange know first here though never old turned many after black forest left hand own thought day knew beneath body head see young life long found most girl lay village face tribe wild away tree until ape down must seen far within door white few much esmeralda savage above once dead mighty ground stood side last trees apes cried thing among moment took hands new off without almost beast huge alone close just tut canler nor way knife small
I found this story to have quite a number of similarities with James Fenimore Cooper’s The Last of the Mohicans. The central character in both was super human. Both includes some sort of wilderness. In the Last of the Mohicans it was the forest. In Tarzan it was the jungle. In both cases the wilderness was inhabited by savages. Indians, apes, or pirates. Both included damsels in distress who were treated in a rather Victorian manner and were sought after by an unwanted lover. Both included characters with little common sense. David and Professor Porter.
I found Tarzan much more readable and story-like compared to the Last of the Mohicans. It can really be divided into two parts. The first half is a character development. Who is Tarzan, and how did he becomes who he is. The second half is a love story, more or less, where Tarzan pursues his love. I found it rather distasteful that Tarzan was a man of “breeding“. I don’t think people are to bred like animals.
2008-12-01T13:34:02+00:00 Musings: Open Source Software in Libraries: Opportunities and Expenses http://infomotions.com/musings/oss4mlnc/ Open source software (OSS) is not a panacea; it will not cure all problems computer. On the other hand, it does provide the library profession with enumerable opportunities as long as we are willing to pay a few expenses. This essay elaborates on these ideas by: 1) outlining what open source software is, 2) describing how its principles are similar to the principles of librarianship, and 3) enumerating a number of open source software applications. By the end it is hoped you will be have a better understanding of what open source can and cannot do for libraries. You will be better able to discuss topics related to open source software with "techies". Finally, and probably most importantly, you will have learned the definition of "free" in the context of open source.I attended the first-ever WorldCat Hackathon on Friday and Saturday (November 7 & 8), and us attendees explored ways to take advantage of various public application programmer interfaces (APIs) supported by OCLC.
 The WorldCat Hackathon was an opportunity for people to get together, learn about a number of OCLC-supported APIs, and take time to explore how they can be used. These APIs are a direct outgrowth of something that started at least 6 years ago with an investigation of how OCLC’s data can be exposed through Web Service computing techniques. To date OCLC’s services fall into the following categories, and they are described in greater detail as a part of the OCLC Grid Services Web page:
The event was attended by approximately fifty (50) people. The prize going to the person coming the furthest went to someone from France. A number of OCLC employees attended. Most people were from academic libraries, and most people were from the surrounding states. About three-quarters of the attendees were “hackers”, and the balance were there to learn.
Taking place in the Science, Industry and Business Library (New York Public Library), the event began with an overview of each of the Web Services and the briefest outline of how they might be used. We then quickly broke into smaller groups to “hack” away. The groups fell into a number of categories: Drupal, VUFind, Find More Like This One/Miscellaneous, and language-specific hacks. We reconvened after lunch on the second day sharing what we had done as well as what we had learned. Some of the hacks included:
Obviously the hacks created in this short period of time by a small number of people illustrate just a tiny bit of what could be done with the APIs. More importantly and IMHO, what these APIs really demonstrate is the ways librarians can have more control over their computing environment if they were to learn to exploit these tools to their greatest extent. Web Service computing techniques are particularly powerful because they are not wedded to any specific user interface. They simply provide the means to query remote services and get back sets of data. It is then up to librarians and developers — working together — to figure out what to do the the data. As I’ve said somewhere previously, “Just give me the data.”
I believe the Hackathon was a success, and I encourage OCLC to sponsor more of them.
2008-11-09T14:29:36+00:00 Mini-musings: VUFind at PALINET http://infomotions.com/blog/2008/11/vufind-at-palinet/I attended a VUFind meeting at PALINET in Philadelphia today, November 6, and this posting summarizes my experiences there.
 As you may or may not know, VUFind is a “discovery layer” intended to be applied against a traditional library catalog. Originally written by Andrew Nagy of Villanova University, it has been adopted by a handful of libraries across the globe and is being investigated by quite a few more. Technically speaking, VUFind is an open source project based on Solr/Lucene. Extract MARC records from a library catalog. Feed them to Solr/Lucene. Provide access to the index as well as services against the search results.
The meeting was attended by about thirty people. The three people from Tasmania won the prize for coming the furthest, but there were also people from Stanford, Texas A&M, and a number of more regional libraries. The meeting had a barcamp-like agenda. Introduce ourselves. Brainstorm topics for discussion. Discuss. Summarize. Go to bar afterwards. Alas, I didn’t get to go to the bar, but I was there for the balance. The following bullet points summarize each discussion topic:
The day was wrapped up by garnering volunteers to see after each of the discussion points in the hopes of developing them further.
I appreciated the opportunity to attend the meeting, especially since it is quite likely I will be incorporating VUFind into a portal project called the Catholic Research Resources Alliance. I find it amusing the way many “next generation” library catalog systems — “discovery layers” — are gravitating toward indexing techniques and specifically Lucene. Currently, these systems include VUFind, XC, BlackLight, and Primo. All of them provide a means to feed an indexer data, and then user access to the index.
Of all the discussions, I enjoyed the one on federated search the most because it toyed with the idea of making the interfaces to our indexes smarter. While this smacks of artificial intelligence, I sincerely think this is an opportunity to incorporate library expertise into search applications.
2008-11-07T03:37:47+00:00 Musings: Next-Generation Library Catalogues: A Presentation at Libraries Australia http://infomotions.com/musings/ngc-in-sydney/ The environment of globally networked and commodity priced computers has significantly altered the information landscape. Libraries, once a central player in this environment, have seen their "market share" dwindle. This presentation outlines one way this situation can be turned around, specifically, by re-inventing the definition of the venerable library catalogue. Map it |
 Map it |
On Thursday, September 4 a person from Google named Jon Trowbridge gave a presentation at Notre Dame called “Making scientific datasets universally accessible and useful”. This posting reports on the presentation and dinner afterwards.
Jon Trowbridge is a software engineer working for Google. He seems to be an open source software and an e-science type of guy who understands academia. He echoed the mission of Google — “To organize the world’s information and make it universally accessible and useful”, and he described how this mission fits into his day-to-day work. (I sort of wish libraries would have such a easily stated mission. It might clear things up and give us better focus.)
Trowbridge works for group in Google exploring ways to making large datasets available. He proposes to organize and distribute datasets in the same manner open source software is organized.
He enumerated things people do with data of this type: compute against it, visualize it, search it, do meta-analysis, and create mash-ups. But all of this begs Question 0. “You have to possess the data before you can do stuff with it.” (This is also true in libraries, and this is why I advocate digitization as oppose to licensing content.)
He speculated why scientists have trouble distributing their data, especially if it more than a terabyte in size. URLs break. Datasets are not very indexable. Datasets of the fodder for new research. He advocated the creation of centralized data “clouds”, and these “clouds” ought to have the following qualities:
As he examined people’s datasets he noticed that many of them are simple hierarchal structures saved to file systems, but they are so huge that transporting them over the network isn’t feasible. After displaying a few charts and graphs, he posited that physically shipping hard disks via FedEx provides the fastest throughput. Given that hard drives can cost as little as 16¢/GB, FedEx can deliver data at a rate of 20 TB/day. Faster and cheaper than the just about anybody’s network connection.
Given this scenario, Trowbridge gave away 5 TB of hard disk disk space. He challenged us to fill it up with data and share it with him. He would load the data into his “cloud” and allow people to use it. This is just the beginning of an idea, not a formal service. Host data locally. Provide tools to access and use it. Support e-science.
Personally, I thought it was a pretty good idea. Yes, Google is a company. Yes, I wonder to what degree I can trust Google. Yes, if I make my data accessible then I don’t have a monopoly on it, and others will may beat me to the punch. On the other hand, Google has so much money that they can afford to “Do no evil.” I sincerely doubt anybody was trying to pull the wool over our eyes.
After the presentation I and a couple of my colleagues (Mark Dehmlow and Dan Marmion) had dinner with Jon. We discussed what it is like to work for Google. The hiring process. The similarities and differences between Google and libraries. The weather. Travel. Etc.
All in all, I thought it was a great experience. “Thank you for the opportunity!” It is always nice to chat with sets of my peers about my vocation (as well as my avocation).
Unfortunately, we never really got around to talking about the use of data, just its acquisition. The use of data is a niche I believe libraries can fill and Google can’t. Libraries are expected to know their audience. Given this, information acquired through a library settings can be put into the user’s context. This context-setting is a service. Beyond that, other services can be provided against the data. Translate. Analyze. Manipulate. Create word cloud. Trace idea forward and backward. Map. Cite. Save for later and then search. Etc. These are spaces where libraries can play a role, and the lynchpin is the acquisition of the data/information. Other institutions have all but solved the search problem. It is now time to figure out how to put the information to use so we can stop drinking from the proverbial fire hose.
P.S. I don’t think very many people from Notre Dame will be taking Jon up on his offer to host their data.
2008-09-22T21:45:32+00:00 Musings: MyLibrary: A digital library framework & toolkit http://infomotions.com/musings/mylibrary-framework/ This article describes a digital library framework and toolkit called MyLibrary. At its heart, MyLibrary is designed to create relationships between information resources and people. To this end, MyLibrary is made up of essentially four parts: 1) information resources, 2) patrons, 3) librarians, and 4) a set of locally-defined, institution-specific facet/term combinations interconnecting the first three. On another level, MyLibrary is a set of object-oriented Perl modules intended to read and write to a specifically shaped relational database. Used in conjunction with other computer applications and tools, MyLibrary provides a way to create and support digital library collections and services. Librarians and developers can use MyLibrary to create any number of digital library applications: full-text indexes to journal literature, a traditional library catalog complete with circulation, a database-driven website, an institutional repository, an image database, etc. The article describes each of these points in greater detail.I recently had published an article in Information Technology and Libraries (ITAL) entitled “MyLibrary: A Digital library framework & toolkit” (volume 27, number 3, pages 12-24, September 2008). From the abstract:
This article describes a digital library framework and toolkit called MyLibrary. At its heart, MyLibrary is designed to create relationships between information resources and people. To this end, MyLibrary is made up of essentially four parts: 1) information resources, 2) patrons, 3) librarians, and 4) a set of locally-defined, institution-specific facet/term combinations interconnecting the first three. On another level, MyLibrary is a set of object-oriented Perl modules intended to read and write to a specifically shaped relational database. Used in conjunction with other computer applications and tools, MyLibrary provides a way to create and support digital library collections and services. Librarians and developers can use MyLibrary to create any number of digital library applications: full-text indexes to journal literature, a traditional library catalog complete with circulation, a database-driven website, an institutional repository, an image database, etc. The article describes each of these points in greater detail.
The folks at ITAL are gracious enough to allow authors to distribute their work on the Web as long as the distribution happens after print publication. “Nice policy!”
Many people will remember MyLibrary from more than ten years ago. It is alive and well. It drives a few digital library projects at Notre Dame. It is often associated with customization/personalization, but now it is more about creating relationships between people and information resources through an institution-defined controlled vocabulary — a set of facet/term combinations.

In my opinion, libraries spend too much time describing resources and creating interdependencies between them. Instead, I think libraries should be spending more time creating relationships between resources and people. You can do this in any number of ways, and sets of facet/term combinations are just one. Think up qualities used to describe people. Think up qualities used to describe information resources. Create relationships by bringing resources and people together that share qualities.
2008-09-18T03:26:12+00:00 Mini-musings: MBooks, revisited http://infomotions.com/blog/2008/09/mbooks-revisited/This posting makes available a stylesheet to render MARCXML from a collection of records called MBooks.
In a previous post — get-mbooks.pl — I described how to use OAI-PMH to harvest MARC records from the MBooks project. The program works; it does what it is suppose to do.
The MBooks collection is growing so I harvested the content again, but this time I wanted to index it. Using an indexer/search engine called Zebra, the process was almost trivial. (See “Getting Started With Zebra” for details.)
Since Zebra supports SRU (Search/Retrieve via URL) out of the box, searches against the index return MARCXML. This will be a common returned XML stream for a while, so I needed to write an XSLT stylesheet to render the output. Thus, mbooks.xsl was born.
What is really “kewl” about the stylesheet is the simple inline Javascript allowing the librarian to view the MARC tags in all their glory. For a little while you can see how this all fits together in a simple interface to the index.
Use mbooks.xsl as you see fit, but remember “Give back to the ‘Net.”
2008-09-09T01:36:59+00:00 Mini-musings: wordcloud.pl http://infomotions.com/blog/2008/08/wordcloudpl/Attached should be simple Perl script called wordcloud.pl. Initialize it with a hash of words and associated integers. Output rudimentary HTML in the form of a word cloud. This hack was used to create the word cloud in a posting called “Last of the Mohicans and services against texts“.
2008-08-25T13:50:25+00:00 Mini-musings: Last of the Mohicans and services against texts http://infomotions.com/blog/2008/08/last-of-the-mohicans-and-services-against-texts/Here is a word cloud representing James Fenimore Cooper’s The Last of the Mohicans; A narrative of 1757. It is a trivial example of how libraries can provide services against documents, not just the documents themselves.
scout heyward though duncan uncas little without own eyes before hawkeye indian young magua much place long time moment cora hand again after head returned among most air huron toward well few seen many found alice manner david hurons voice chief see words about know never woods great rifle here until just left soon white heard father look eye savage side yet already first whole party delawares enemy light continued warrior water within appeared low seemed turned once same dark must passed short friend back instant project around people against between enemies way form munro far feet nor
While I am not a literary scholar, I am able to read a book and write a synopsis.
Set during the French And Indian War in what was to become upper New York State, two young women are being escorted from one military camp to another. Along the way the hero, Natty Bumppo (also known by quite a number of other names, most notably “Hawkeye” or the “scout”), alerts the convoy that their guide, Magua, is treacherous. Sure enough, Magua kidnaps the women. Fights and battles ensue in a pristine and idyllic setting. Heroic deeds are accomplished by Hawkeye and the “last of the Mohicans” — Uncas. Everybody puts on disguises. In the end, good triumphs over evil but not completely.
Cooper’s style is verbose. Expressive. Flowery. On this level it was difficult to read. Too many words. In the other hand the style was consistent, provided a sort of pattern, and enabled me to read the novel with a certain rhythm.
There were a couple of things I found particularly interesting. First, the allusion to “relish“. I consider this to be a common term now-a-days, but Cooper thought it needed elaboration when used to describe food. Cooper used the word within a relatively short span of text to describe condiment as well as a feeling. Second, I wonder whether or not Cooper’s description of Indians built on existing stereotypes or created them. “Hugh!”
The word cloud I created is simple and rudimentary. From my perspective, it is just a graphical representation of a concordance, and a concordance has to be one of the most basic of indexes. This particular word cloud (read “concordance” or “index”) allows the reader to get a sense of a text. It puts words in context. It allows the would-be reader to get an overview of the document.
This particular implementation is not pretty, nor is it quick, but it is functional. How could libraries create other services such as these? Everybody can find and get data and information these days. What people desire is help understanding and using the documents. Providing services against texts such as word clouds (concordances) might be one example.
2008-08-25T13:28:27+00:00 Mini-musings: Crowd sourcing TEI files http://infomotions.com/blog/2008/08/crowd-sourcing-tei-files/How feasible and/or practical do you think “crowd sourcing” TEI files would be?
I like writing in my books. In fact, I even have a particular system for doing it. Circled things are the subjects of sentences. Squared things are proper nouns. Underlined things connected to the circled and squared things are definitions. Moreover, my books are filled with marginalia. Comments. Questions. See alsos. I call this process ELMTGML (Eric Lease Morgan’s Truly Graphic Mark-up Language), and I find it a whole lot more useful than the use of simple highlighter pen that where all the mark-up has the same value. Florescent yellow.
I think I could easily “crosswalk” my mark-up process to TEI mark-up because there are TEI elements for many of things I highlight. Given such a thing I could mark-up texts using my favorite editor and then create stylesheets that turn on or turn off my commentary.
Suppose many classic texts were marked-up in TEI. Suppose there were stylesheets that allowed you to turn on or turn off other people’s commentary/annotations or allowed you to turn on or turn off particular people’s commentary/annotation. Wouldn’t that be interesting?
Moreover, what if some sort of tool, widget, or system were created that allowed anybody to add commentary to texts in the form of TEI mark-up. Do you think this would be feasible? Useful?
2008-08-15T19:44:21+00:00 Mini-musings: Metadata and data structures http://infomotions.com/blog/2008/08/metadata-and-data-structures/It is important to understand the differences between metadata and data structures. This posting outlines some of the differences between the two.
Every once in a while people ask me for advice that I am usually very happy to give because the answers usually involve succinctly articulating some of the things floating around in my head. Today someone asked:
I’ve been looking at Dublin Core and looking at MODS to arrive at the best metadata for converting MARC records into human readable format. Dublin Core lacks specificity, but maybe I don’t understand it that well. Plus, I cannot find what parts of the MARC are mapped to what–where are the “rules.” I look at Mods and find it overwhelming and I’m not even sure of its intended purpose.
Below is how I replied.
First of all, please understand that Dublin Core is really just a list of fifteen or so metadata element names. Title. Creator. Publisher. Format. Identifier. Etc. Moreover, each of these names come with simple definitions denoting the type of content they are expected to represent. Dublin Core is NOT a metadata format. Dublin Core does not define how data should be encoded. It is simply a list of elements.
MARC is a metadata format — a data structure — a container — a “bit bucket”. The MARC standard defines how data should be encoded. First there is a leader. It is always 24 characters long and different characters in the leader denote different things. Then there is the directory — a “map” of where the data resides in the file. Finally, there is the data itself which is divided into indicators, fields, and subfields. This MARC standard has been used to hold bibliographic data as well as authority data. In one case the 245 field is intended to encode title/author information. In another case the 245 means something else. In both cases they are using MARC — a data structure.
XML is second type of data structure. Instead of leaders, directories, and data sections, XML is made up of nested elements where the elements of the file are denoted by a Document Type Definition (DTD) or XML schema. XML is much more flexible than MARC. XML is much more verbose than MARC. There are many industries supporting XML. MARC is supported by a single industry. MARC was cool in its time, but it has grown long in the tooth. XML is definitely the data structure to use now-a-days.
MARCXML is a specific flavor of XML used to contain 100% of the data in a bibliographic MARC file. It works. It does what it is suppose to do, but in order to really take advantage of it the user needs to know that the 245 field contains title information, the 100 field contains author information, etc. In other words, to use MARCXML the user needs to know the “secret code book” translating library tags into human-readable elements. Moreover, MARCXML retains all of the “syntactical” sugar of MARC. Last name first. First name last. Parentheses around birth and death dates. “pbk” to denote paperback. Etc.
MODS is a second flavor of XML also designed to contain bibliographic data. In at least a couple of ways, MODS is much better than MARCXML. First and foremost, MODS removes the need for “secret code book” because the element names are human-readable, not integers. Second, some but not all, of the syntactical sugar is removed.
When it comes to bibliographic data, I advocate MODS over MARCXML any day. Not perfect, but a step in the right direction. There are utilities to convert MARC to MARCXML and then to MODS. Conversion is almost a trivial computing problem to solve.
When it comes to choosing the “right” metadata standard it is often about choosing the “right” flavor of XML. VRACore, for example, is more amenable to describing image data. TEI is best suited to describe — mark-up — prose and/or poetry. EAD is the “best” candidate for archival finding aids. Authority data can be represented in a relatively new XML flavor called MADS. METS is used, more or less, to create collections of metadata objects. RDF is similar to METS and is intended to form the basis of the Semantic Web. SKOS is an XML format for thesauri.
In short, there are two things to consider. First, what is your data? Bibliographic? Image? Full texts? Second, what data structure do you want to employ? MARC? XML? Something else such as a tab-delimited file? (Ick!) Or maybe a relational database schema? (Maybe.) In most cases I expect XML will be the data structure you want to employ, and then the question is, “What XML DTD or schema do I want to exploit?”
I allude to many of these issues in an XML workshop I wrote called XML In Libraries.
‘Hope this helps.
2008-08-06T01:18:08+00:00 Mini-musings: Origami is arscient, and so is librarianship http://infomotions.com/blog/2008/07/arscience/To do origami well a person needs to apply both artistic and scientific methods to the process. The same holds true for librarianship.
Arscience is a word I have coined to denote the salient aspects of both art and science. It is a type of thinking — thinquing — that is both intuitive as well as systematic. It exemplifies synthesis — the bringing together of ideas and concepts — and analysis — the division of our world into smaller and smaller parts. Arscience is my personal epistemological method employing a Hegalian dialectic — an internal discussion. It juxtaposes approaches to understanding including art and science, synthesis and analysis, as well as faith and experience. These epistemological methods can be compared and contrasted, used or exploited, applied and debated against many of the things we encounter in our lives. Through this process I believe a fuller understanding of many things can be achieved.

A trivial example is origami. One one hand, origami is very artistic. Observe something in the natural world. Examine its essential parts and take notice of their shape. Acquire a piece of paper. Fold the paper to bring the essential parts together to form a coherent whole. The better your observation skills, the better your command of the medium, the better your origami will be.
On the other hand, you can discover that a square can be inscribed on any plane, and upon a square any number of regular polygons can be further inscribed. All through folding. You can then go about bisecting angles and dividing paper in halves, creating symbols denoting different types of folds, and systematically recording the process so it can be shared with others, ultimately creating a myriad of three-dimensional objects from an essentially two-dimensional thing. Unfold the three-dimensional object to expose its mathematics.
Seemingly conflicting approaches to the same problem results in similar outcomes. Arscience.

The same artistic and scientific processes — an arscient process — can be applied to librarianship. While there are subtle differences between different libraries, they all do essentially the same thing. To some degree they all collect, organize, preserve, and disseminate data, information, and knowledge for the benefit their respective user populations.
To accomplish these goals the librarian can take both an analysis tack as well as a synthesis tack. Interactions with people is more about politics, feelings, wants, and needs. Such things are not logical but emotional. This is one side of the coin. The other side of the coin includes well-structured processes & workflows, usability studies & statistical analysis, systematic analysis & measurable results. In our hyper-dynamic environment, such as the one we are working it, innovation — thinking a bit outside the box — is a necessary ingredient for moving forward. At the same time, it is not all about creativity but it is also about strategically planning for the near, medium, and long term future.
Librarianship requires both. Librarianship is arscient.
2008-07-30T17:08:52+00:00 Mini-musings: On the move with the Mobile Web http://infomotions.com/blog/2008/07/on-the-move-with-the-mobile-web/On The Move With The Mobile Web by Ellyssa Kroski provides a nice overview of mobile technology and what it presently means for libraries.
In my most recent list of top technology trends I mentioned mobile devices. Because of this Kroski had a copy of the Library Technology Report she authored, above, sent to me. Its forty-eight pages essentially consists of six chapters (articles) on the topic of the Mobile Web:
Each chapter is complete with quite a number of links and citations for further reading.
Through my reading of this Report my knowledge of the Mobile Web increased. The most interesting thing I learned was the existence of Semapedia, a project that “strives to tag real-world objects with 2D barcodes that can be read by camera phones.” Go to Semapedia. Enter a Wikipedia URL. Get back a PDF document containing “barcodes” that your cellphone should be able to read (with the appropriate application). Label real-world things with the barcode. Scan the code with your cellphone. See a Wikipedia article describing the thing. Interesting. Below is one of these barcodes for the word “blog” which links to the Mobile Web-ready Wikipedia entry on blogs:

I still believe the Mobile Web is going to play larger role in people’s everyday lives. (Duh!) By extension, I believe it is going to play a larger role in libraries. Ellyssa Kroski’s On The Move With The Mobile Web will give you a leg up on the technology.
2008-07-20T23:26:56+00:00 Mini-musings: TPM — technological protection measures http://infomotions.com/blog/2008/07/tpm-technological-protection-measures/I learned a new acronym a few weeks ago — TPM — which stands for “technological protection measures”, and in the May 2008 issue of College & Research Libraries Kristin R. Eschenfelder wrote an article called “Every library’s nightmare?” and enumerated various types of protection measures employed by publishers to impede the use of electronic scholarly material.
In today’s environment, where digital information is increasingly bought, sold, and/or licensed, publishers feel the need to protect their product from duplication. As described by Eschenfelder, these protections — restrictions — come in two forms: soft and hard.
Soft restrictions are “configurations of hardware or software that make certain uses such as printing, saving, copy/pasting, or e-mailing more difficult — but not impossible — to achieve.” The soft restrictions have been divided into the following subtypes:
Hard restrictions are “configurations of software or hardware that strictly prevent certain uses.” The hard restrictions have been divided into the following subtypes:
To investigate what types of restricts were put into everyday practice Eschenfelder studied a total of about seventy-five resources from three different disciplines (engineering, history, art history) and tallied the types of restrictions employed.
A few salient quotes from the article exemplify Eschenfelder’s position on TPM:
I agree with Eschenfelder.
Many people who work in libraries seem to be there because of the values libraries portray. Examples include but are not limited to: intellectual freedom, education, diversity, equal access to information, preservation of the historical record for future generations, etc. Heaven know, people who work in libraries are not in it for the money! I fall into the equal access to information camp, and that is why I advocate things like open access publishing and open source software development.
TPM inhibits the free and equal access of information, and I think Eschenfelder makes a good point when she says the “library community has already accepted many of the soft use restrictions.” Why do we accept them? Librarians are not required to purchase and/or license these materials. We have choice. If much of the scholarly publishing industry is driven by the marketplace — supply & demand — then why don’t/can’t we just say, “No”. Nobody is forcing us spend our money this way. If vendors don’t provide the sort of products and services we desire, then the marketplace will change. Right?
In any event, consider educating yourself on the types of TPM and read Eschenfelder’s article.
2008-07-20T18:55:25+00:00 Mini-musings: Against The Grain is not http://infomotions.com/blog/2008/07/against-the-grain-is-not/Against The Grain is not your typical library-related serial.
Last year I had the opportunity to present at the 27th Annual Charleston Conference where I shared my ideas regarding the future of search and how some of those ideas can implemented in “next-generation” library catalogs. In appreciation of my efforts I was given a one-year subscription to Against The Grain. From the website’s masthead:
Against the Grain (ISSN: 1043-2094) is your key to the latest news about libraries, publishers, book jobbers, and subscription agents. It is a unique collection of reports on the issues, literature, and people that impact the world of books and journals. ATG is published on paper six times a year, in February, April, June, September, and November and December/January.
I try to read the issues as they come out, but I find it difficult. This not because the content is poor, but rather because the there is so much of it! In a few words and phrases, Against The Grain is full, complete, dense, tongue-in-cheek, slightly esoteric, balanced, graphically challenging and at the same time graphically interesting, informative, long, humorous, supported by advertising, somewhat scholarly, personal, humanizing, a realistic reflection of present-day librarianship (especially in regards to technical services in academic libraries), predictable, and consistent. For example, the every issue contains a “rumors” article listing bunches and bunches of people, where they are going, and what they are doing. Moreover, the articles are printed in a relatively small typeface in a three-column format. Very dense. To make things easier to read, sort of, all names and titles are bolded. I suppose the dutiful reader could simply scan for names of interest and read accordingly, but there are so many of them. (Incidentally, the bolded names pointed me to the Tenth Fiesole Retreat which piqued my interest because I had given a modified SIG-IR presentation on MyLibrary at the Second Fiesole Retreat. Taking place at Oxford, that was a really cool meeting!)
Don’t get me wrong. I like Against The Grain but it so full of information and has been so thoroughly put together that I feel almost embarrassed not reading it. I feel like the amount of work put into each issue warrants the same amount of effort on my part to read it.
The latest issue (volume 20, number 3, June 2008) includes a number of articles about Google. For me, the most interesting articles included:
If you have the time, spent it reading Against The Grain.
2008-07-15T23:24:26+00:00 Mini-musings: E-journal archiving solutions http://infomotions.com/blog/2008/07/e-journal-archiving-solutions/A JISC-funded report on e-journal archiving solutions is an interesting read, and it seems as if no particular solution is the hands-down “winner”.
Terry Morrow, et al. recently wrote a report sponsored by JISC called “A Comparative study of e-journal archiving solutions“. Its goal was to compare & contrast various technical solutions to archiving electronic journals and present the informed opinion on the subject.
The report begins by setting the stage. Of particular note is the increased movement to e-only journal solutions many libraries are adopting. This e-only approach begs unanswered questions regarding the preservation and archiving of electronic journals — two similar but different aspects of content curation. To what degree will e-journals suffer from technical obsolescence? Just as importantly, how will the change in publishing business models, where access, not content, is provided through license agreements effect perpetual access and long-term preservation of e-journals?
The report outlines two broad techniques to accomplish the curation of e-journal content. On one hand there is “source file” preservation where content (articles) are provided by the publisher to a third-party archive. This is the raw data of the articles — possibly SGML files, XML files, Word documents, etc. — as opposed to the “presentation” files intended for display. This approach is seen as being more complete, but relies heavily on active publisher and third party participation. This is the model employed by Portico. The other technique is harvesting. In this case the “presentation” files are archived from the Web. This method is more akin to the traditional way libraries preserved and archived their materials. This is the model employed by LOCKSS.
In order to come their conclusions, Morrow et al. compared & contrasted six different e-journal preservation initiatives while looking through the lense of four possible trigger events. These initiatives (technical archiving solutions) included:
The trigger events included:
These characteristics made up a matrix and enabled Morrow, et al. to describe what would happen with each initiative under each trigger event. In summary, they would all function but it seems the LOCKSS solution would provide immediate access to content whereas most of the other solutions would only provide delayed access. Unfortunately, the LOCKSS initiative seems to have less publisher backing than the Portico initiative. On the other hand, the Portico initiative costs more money and assumes a lot of new responsibilities from publishers.
In today’s environment where information is more routinely sold and licensed, I wonder whether or not what level of trust can be given to publishers. What’s in it for them? In the end, neither solution — LOCKSS nor Portico — can be considered ideal, and both ought to be employed at the present time. One size does not fit all.
In the end there were ten recommendations:
Obviously the report went into much greater detail regarding all of these recommendations and how they derived. Read the report for the details.
There are many aspects that make up librarianship. Preservation is just one of them. Unfortunately, when it comes to preservation of electronic, born-digital content, the jury is still out. I’m afraid we are suffering from a wealth of content right now, but in the future this content may not be accessible because society has not thought very long into the future regarding preservation and archiving. I hope we are not creating a Digital Dark Age as we speak. Implementing ideas from this report will help reduce the possibility of this problem from becoming a reality.
2008-07-15T03:01:26+00:00 Mini-musings: Web 2.0 and “next-generation” library catalogs http://infomotions.com/blog/2008/07/web-20-and-next-generation-library-catalogs/A First Monday article systematically comparing & contrasting Web 1.0 and Web 2.0 website technology recently caught my interest, and I think it points a way to making more informed decisions regarding “next-generation” library catalog interfaces and Internet-based library services in general.
Graham Cormode and Balachander Krishnamurthy in “Key differences between Web 1.0 and Web 2.0“, First Monday, 13(6): June 2008 thoroughly describe the characteristics of Web 2.0 technology. It outlines the features of Web 2.0, describes the structure of Web 2.0 sites, identifies problem with measurement of Web 2.0 usage, and covers technical issues.
I really liked the how it listed some of the identifying characteristics. Web 2.0 sites usually:
The article included a nice matrix of popular websites across the top and services down the side. At the intersection of the rows and columns check marks were placed denoting whether or not the website supported the services. Of all the websites Facebook, YouTube, Flicr, and MySpace ranked as being the most Web 2.0-esque. Not surprising.
The compare & contrast between Web 1.0 and Web 2.0 sites was particular interesting, and can be used as a sort of standard/benchmark for comparing existing (library) websites to the increasingly expected Web 2.0 format. For example, Web 1.0 sites are characterized as being:
Whereas Web 2.0 websites generally:
For readers who feel they they do not understand the meaning of Web 2.0, the items outlined above and elaborated upon in the article will make the definition of Web 2.0 clearer. Good reading.
The article also included an interesting graphic, Figure 1, illustrating the paths from content creator to consumer in Web 2.0. The images is linked from the article, below:
The far left denotes people creating content. The far right denotes people using content. In the middle are services. When I look at the image I see everything from the center to the far right of the following illustration (of my own design):

This illustration represents a model for a “next-generation” library catalog. On the far left is content aggregation. In the center is content normalization and indexing. On the right are services against the content. The right half of the illustration above is analgous to the entire illustration from Cormode and Krishnamurthy.
Like the movement from Web 1.0 to Web 2.0, library websites (online “catalogs”) need to be more about users, their content, and services applied against it. “Next-generation” library catalogs will fall short if they are only enhanced implementations of search and browse interfaces. With the advent of digization, everybody has content. What is needed are tools — services — to make it more useful.
2008-07-15T01:50:50+00:00 Mini-musings: Alex Lite: A Tiny, standards-compliant, and portable catalogue of electronic texts http://infomotions.com/blog/2008/07/alex-lite-a-tiny-standards-compliant-and-portable-catalogue-of-electronic-texts/One the beauties of XML its ability to be transformed into other plain text files, and that is what I have done with a simple software distribution called Alex Lite.
A number of years ago I created a Perl-based TEI publishing system called “My personal TEI publishing system“. Create a database designed to maintain authority lists (titles and subjects), sets of XSLT files, and TEI/XML snippets. Run reports against the database to create complete TEI files, XHTML files, RSS files, and files designed to be disseminated via OAI-PMH. Once the XHTML files are created, use an indexer to index them and provide a Web-based interface to the index. Using this system I have made accessible more than 150 of my essays, travelogues, and workshop handouts retrospectively converted as far back as 1989. Using this system, many (if not most) of my writings have been available via RSS and OAI-PMH since October 2004.
A couple of years later I morphed the TEI publishing system to enable me to mark-up content from an older version of my Alex Catalogue of Electronic Texts. Once marked up I planned to transform the TEI into a myriad of ebook formats: plain text, plain HTML, “smart” HTML, PalmPilot DOC and eReader, Rocket eBook, Newton Paperback, PDF, and TEI/XML. The mark-up process was laborious and I have only marked up about 100 texts, and you can see the fruits of these labors, but the combination of database and XML technology has enabled me to create Alex Lite.
Alex Lite the result of a report written against my second TEI publishing system. Loop through each item in the database and update an index of titles. Create a TEI file against each item. Using XSLT, convert each TEI file into a plain HTML file, a “pretty” XHTML file, and a FO (Formatting Objects) file. Use a FO processor (like FOP) to convert the FO into PDF. Loop through each creator in the database to create an author index. Glue the whole thing together with an index.html file. Save all the files to a single directory and tar up the directory.
The result is a single file that can be downloaded, unpacked, and provide immediate access to sets of electronic books in an standards-compliant, operating system independent manner. Furthermore, no network connection is necessary except for the initial acquisition of the distribution. This directory can then be networked or saved to a CD-ROM. Think of the whole thing as if it were a library.
Give it a whirl; download a version of Alex Lite. Here is a list of all the items in the tiny collection:
As alluded to above, the beauty of XML is its ability to be transformed into other plain text formats. XSLT allows me to convert the TEI files into other files for different mediums. The distribution includes only simple HTML, “pretty” XHTML, and PDF versions of the texts, but for the XSLT affectionatos in the crowd who may want to see the XSLT files, I have included them here:
Here’s a sample TEI file, Edgar Allen Poe’s The Cask Of Amontillado.
I believe there is a lot of promise in the marking-up of plain text into XML, specifically works of fiction and non-fictin into TEI. Making available such marked-up texts paves the way for doing textual analysis against them and for enhancing them with personal commentary. It is too bad that the mark-up process, even simple mark-up, is so labor intensive. Maybe I’ll do more of this sort of thing in my copius spare time.
2008-07-12T16:13:01+00:00 Mini-musings: Indexing MARC records with MARC4J and Lucene http://infomotions.com/blog/2008/07/indexing-marc-records-with-marc4j-and-lucene/In anticipation of the eXtensible Catalog (XC) project, I wrote my first Java programs a few months ago to index MARC records, and you can download them from here.
The first uses MARC4J and Lucene to parse and index MARC records. The second uses Lucene to search the index created from the first program. They are very simple programs — functional and not feature-rich. For the budding Java programmer in libraries, these programs could be used as a part a rudimentary self-paced tutorial. From the distribution’s README:
This is the README file for two Java programs called Index and Search.
Index and Search are my first (real) Java programs. Using Marc4J, Index
reads a set of MARC records, parses them (for authors, titles, and call
numbers), and feeds the data to Lucene for indexing. To get the program
going you will need to:
- Get the MARC4J .jar files, and make sure they are in your CLASSPATH.
- Get the Lucene .jar files, and make sure they are in your CLASSPATH.
- Edit Index.java so the value of InputStream points to a set of MARC records.
- Create a directory named index in the same directory as the source code.
- Compile the source (javac Index.java).
- Run the program (java Index).
The program should echo the parsed data to the screen and create an
index in the index directory. It takes me about fifteen minutes to index
700,000 records.The second program, Search, is designed to query the index created by
the first program. To get it to run you will need to:
- Get the Lucene .jar files, and make sure they are in your CLASSPATH.
- Make sure the index created by Index is located in the same directory as the source code.
- Compile the source (javac Search.java).
- Run the program (java Search where is a word or phrase).
The result should be a list items from the index. Simple.
Enjoy?!
2008-07-09T21:35:36+00:00 Mini-musings: Encoded Archival Description (EAD) files everywhere http://infomotions.com/blog/2008/07/encoded-archival-description-ead-files-everywhere/I’m beginning to see Encoded Archival Description (EAD) files everywhere, but maybe it is because I am involved with a project called the Catholic Research Resources Alliance (CRRA).
As you may or may not know, EAD files are the “MODS files” of the archival community. These XML files provide the means to administratively describe archival collections as well as describe the things in the collections at the container, folder, or item level.
Columbia University and MARC records
During the past few months, I helped edit and shepherd an article for Code4Lib Journal by Terry Catapano, Joanna DiPasquale, and Stuart Marquis called “Building an archival collections portal“. The article describes the environment and outlines the process folks at Columbia University use to make sets of their archival collections available on the Web. Their particular process begins with sets of MARC records dumped from their integrated library system. Catapano, DiPasquale, and Marquis then crosswalk the MARC to EAD, feed the EAD to Solr/Lucene, and provide access to the resulting index. Their implementation uses a mixture of Perl, XSLT, PHP, and Javascript. What was most interesting was the way they began the process with MARC records.
Florida State University and tests/tools
Today I read an article by Plato L. Smith II from Information Technology and Libraries (volume 27, number 2, pages 26-30) called “Preparing locally encoded electronic finding aid inventories for union environments: A Publishing model for Encoded Archival Description”. [COinS] Smith describes how the Florida State University Libraries create their EAD files with Note Tab Light templates and then convert them into HTML and PDF documents using XSLT. They provide access to the results through the use of content management system — DigiTool. What I found most intriguing about this article where the links to test/tools used to enrich their EAD files, namely the RLG EAD Report Card and the Online Archive of California Best Practices Guidelines, Appendix B. While I haven’t set it up yet, the former should check EAD files for conformity (beyond validity), and the later will help create DACS-compliant EAD Formal Public Identifiers.
Catholic Research Resources Alliance portal
Both of these articles will help me implement the Catholic Research Resources Alliance (CRRA) portal. From a recent workshop I facilitated:
The ultimate goal of the CRRA is to facilitate research in Catholic scholarship. The focus of this goal is directed towards scholars but no one is excluded from using the Alliance’s resources. To this end, participants in the Alliance are expected to make accessible rare, unique, or infrequently held materials. Alliance members include but are not limited to academic libraries, seminaries, special collections, and archives. Similarly, content might include but is not limited to books, manuscripts, letters, directories, newspapers, pictures, music, videos, etc. To date, some of the Alliance members are Boston College, Catholic University, Georgetown University, Marquette University, Seton Hall University, University of Notre Dame, and University of San Diego.
Like the Columbia University implementation, the portal is expected to allow Alliance members to submit MARC records describing individual items. The Catapano, DiPasquale, and Marquis article will help me map my MARC fields to my local index. Like the Florida Sate University implementation, the portal is expected to allow Alliance members to submit EAD files. The Smith article will help me create unique identifiers. For Alliance members who have neither MARC nor EAD files, the portal is expected to allow Alliance members submit their content via a fill-in-the-blank interface which I am adopting from the good folks at the Archives Hub.
The CRRA portal application is currently based on MyLibrary and an indexer/search engine called KinoSearch. After submitting them to the portal, EAD files and MARC records are parsed and saved to a MySQL database using the Perl-based MyLibrary API. Various reports are then written against the database, again, using the MyLibrary API. These reports are used to create on-the-fly browsable lists of formats, names, subjects, and CRRA “themes”. They are used to create sets of XML files for OAI-PMH harvesting. They are used to feed data to Kinosearch to create an index. (For example, see mylibrary2files.pl and then ead2kinosearch.pl.) Finally, the whole thing is brought together with a single Perl script for searching (via SRU) and browsing.
It is nice to see a growing interest in EAD. I think the archival community has a leg up on it library brethren regarding metadata. They are using XML more and more. Good for them!
Finally, let’s hear it for the ‘Net, free-flowing communication, and open source software. Without these things I would not have been able to accomplish nearly as much as I have regarding the portal. “Thanks guys and gals!”
2008-07-02T02:24:20+00:00 Mini-musings: eXtensible Catalog (XC): A very transparent approach http://infomotions.com/blog/2008/06/extensible-catalog-xc-a-very-transparent-approach/An article by Jennifer Bowen entitled “Metadata to support next-generation library resource discovery: Lessons from the eXtensible Catalog, Phase 1” appeared recently in Information Technology & Libraries, the June 2008 issue. [1]
The article outlines next-steps for the XC Project and enumerates a number of goals for their “‘next-generation’ library catalog” application/system:
Because I am somewhat involved in the XC Project from past meetings and as a Development Partner, the article did not contain a lot of new news for me, but it did elaborate on a number of points.
Its underlying infrastructure is a good example. Like many “next-generation” library catalog applications/systems, it proposes to aggregate content from a wide variety of sources, normalize the data into a central store (the “hub”), index the content, and provide access to the central store or index through a number of services. This is how Primo, VUFind, AquaBrowser operate. Many others work in a similar manner; all of these systems have more things in common than differences. Unlike other applications/systems, XC seems to embrace a more transparent and community-driven process.
One of the things that intrigued me most was goal #2. “XC will reveal library metadata not only through its own separate interface.., but will also allow library metadata to be revealed through other Web applications.” This definitely the way to go. A big part of librarianship is making data, information, and knowledge widely accessible. Our current systems do this very poorly. XC is moving in the right direction in this regard. Kudos.
Another thing that caught my eye was a requirement for goal #3, “The XC system will capture metadata generated by users from any one of the system’s user environments… and harvest it back into the system’s metadata services hub for processing.” This too sounds like a good idea. People are the real sources of information. Let’s figure out ways to harness the knowledge, expertise, and experiences of our users.
What is really nice about XC is the approach they are taking. It is not all about their software and their system. Instead, it is about building on the good work of others and providing direct access to their improvements. “Projects such as the eXtensible Catalog can serve as a vehicle for moving forward by providing an opportunity for libraries to experiment and to then take informed action to move the library community toward a next generation of resource discovery systems.”
I wish more librarians would be thinking about their software development processes in the manner of XC.
[1] The article is immediately available online at http://hdl.handle.net/1802/5757.
2008-06-27T00:19:25+00:00 Mini-musings: Top Tech Trends for ALA (Summer ’08) http://infomotions.com/blog/2008/06/top-tech-trends-for-ala-summer-08/Here is a non-exhaustive list of Top Technology Trends for the American Library Association Annual Meeting (Summer, 2008). These Trends represent general directions regarding computing in libraries — short-term future directions where, from my perspective, things are or could be going. They are listed in no priority order.
Wow! Where did all of that come from?
(This posting is also available at on the LITA Blog. “Lot’s of copies keep stuff safe.”)
2008-06-19T03:59:07+00:00 Mini-musings: Google Onebox module to search LDAP http://infomotions.com/blog/2008/06/google-onebox-module-to-search-ldap/This posting describes a Google Search Appliance Onebox module for searching an LDAP directory.
At my work I help administrate a Google Search Appliance. It is used index the university’s website. The Appliance includes a functionality — called Onebox — allowing you to search multiple indexes and combining the results into a single Web page. It is sort of like libraray metasearch.
In an effort to make it easier for people to find… people, we created a Onebox module, and you can download the distribution if you so desire. It is written in Perl.
In regards to libraries and librarianship, the Onebox technique is something the techno-weenies in our profession ought to consider. Capture the user’s query. Do intelligent processing on it by enhancing it, sending it to the appropriate index, making suggestions, etc., and finally returning the results. In other words, put some smarts into the search interface. You don’t need a Google Search Appliance to do this, just control over your own hardware and software.
From the distribution’s README file:
This distribution contains a number of files implementing a Google Onebox “widget”. It looks people’s names up in an LDAP directory.
The distribution contains the following files:
- people.cgi – the reason de existance
- people.pl – command-line version of people.cgi
- people.png – an image of a person
- people.xsl – XSL to convert people.cgi output to HTML
- README – this file
- LICENSE – the GNU Public License
The “widet” (people.cgi) is almost trivial. Read the value of the query paramenter sent as a part of the GET request. Open up a connection to the LDAP server. Query the server. Loop through the results keeping only a number of them as defined by the constant UPPER. Mark-up the results as Google XML. Return the XML to the HTTP client. It is then the client’s resposibility to transform the XML into an HTML (table) snippet for display. (That is what people.xsl is for.)
This widget ought to work in many environments. All you really need to do is edit the values of the constants at the beginning of people.cgi.
This code is distributed under the GNU Public License.
Enjoy.
2008-06-16T22:13:09+00:00 Mini-musings: DLF ILS Discovery Internet Task Group Technical Recommendation http://infomotions.com/blog/2008/06/dlf-ils-discovery-internet-task-group-ils-di-technical-recommendation/I read the great interest the DLF ILS Discovery Internet Task Group (ILS-DI) Technical Recommendation [1], and I definitely think it is a step in the right direction for making the content of library systems more accessible.
In regards to the integrated systems of libraries, the primary purpose of the Recommendations is to:
To this end the Recommendations list a set of abstract functions integrated library systems “should” implement, and it enumerate a number of concrete bindings that can be used to implement these functions. Each of the twenty-five (25) functions can be grouped into one of four overall categories:
The Recommendations also group the functions into levels of interoperability:
After describing the things outlined above in greater detail, the Recommendations get down to business, list each function, its parameters, why it is recommended, and suggests one or more “bindings” — possible ways the function can be implemented. Compared to most recommendations in my experience, this one is very easy to read, and it is definitely approachable by anybody who calls themselves a librarian. A few examples illustrate the point.
The Recommendations suggest a number of harvest functions. These functions allow a harvesting system to specify a number of date ranges and get back a list records that have been created or edited within those ranges. These records may be bibliographic, holdings, or authority in nature. These records may be in MARC format, but is strongly suggested they be in some flavor of XML. The search functions allow a remote application to query the system and get back a list of matching records. Like the harvest functions, records may be returned in MARC but XML is prefered. Patron functions support finding patrons, listing patron attributes, allowing patrons to place holds, recalls, or renewals on items, etc.
There was one thing I especially liked about the Recommendations. Specifically, whenever possible, the bindings were based on existing protocols and “standards”. For example, they advocated the use of OAI-PMH, SRU, OpenSearch, NCIP, ISO Holdings, SIP2, MODS, MADS, and MARCXML.
From my reading, there were only two slightly off kilter things regarding the Recommendations. First, it advocated the possible use of an additional namespace to fill in some blanks existing XML vocabularies are lacking. I suppose this was necessary in order to glue the whole thing together. Second, it took me a while to get my head around the functions supporting links to external services — the OPAC interaction functions. These functions are expected to return Web pages that is static, writable, or transformative in nature. I’ll have to think about these some more.
It is hoped vendors of integrated library systems support these functions natively or they are supported through some sort of add-on system. The eXstensible Catalog (XC) is a good example here. The use of Ex Libris’s X-Server interface is another. At the very least a number of vendors have said they would make efforts to implement Level 1 functionality, and this agreement been called the “Berkley Accord” and includes: AquaBrowser, BiblioCommonsCalifornia Digital Library, Ex Libris, LibLime, OCLC, Polaris Library Systems, SirsiDynix, Talis, and VTLS.
Within my own sphere of hack-dom, I think I could enhance my Alex Catalogue of Electronic Texts to support these Recommendations. Create a (MyLibrary) database. Populate it with the metadata and full-text data of electronic books, open access journal articles, Open Content Alliance materials, records from Wikipedia, and photographic images of my own creation. Write reports in the form of browsable lists or feeds expected to be fed to an indexer. Add an OAI-PMH interface. Make sure the indexer is accessible via SRU. Implement a “my” page for users and enhance it to support the Recommendations. Ironically, much of this work has already been done.
In summary, and as I mentioned previously, these Recommendations are a step in the right direction. The implementation of a “next generation” library catalog is not about re-inventing a better wheel and trying to corner the market with superior or enhanced functionality. Instead it is about providing a platform for doing the work libraries do. For the most part, libraries and their functions have more things in common than they have differences. These Recommendations articulate a lot of these commonalities. Implement them, and kudos to Team DLF ILS-DI.
[1] PDF version of Recommendation – http://tinyurl.com/3lqxx2
2008-06-12T04:50:20+00:00 Musings: Introduction to the Catholic Research Resources Alliance http://infomotions.com/musings/crra-workshop/ This short essay describes the Catholic Research Resources Alliance (CRRA), its purpose, its goals, its functionality, its vision for the future, and some of its existing challenges.In 1992 I wrote a HyperCard stack called HyperNote Pro.
 HyperNote allowed you to annotate plain text files, and it really was a hypertext system. Import a plain text file. Click a word to see a note. Option-click a word to create a note. Shift-click a word to create an image note. Option-shift-click a word to link to another document. Use the HyperNote > New HypernNote menu option to duplicate the stack and create a new HyperNote document.
HyperCard is all but dead, and need an older Macintosh computer to use the application. It was pretty cool. You can download it from my archives. Here is the text from the self-extracting archive:
HyperNote Pro: a text annotating stack by Eric Lease Morgan
HyperNote Pro is a HyperCard stack used to annotate text. It can also create true hypertext links between itself and other documents or applications.
Simply create a new HyperNote Pro stack, import a text file, and add pop–up notes, pictures, and/or hypertext links to the text. The resulting stack can be distributed to anybody with HyperCard 2.0 and they will be able to read or edit your notes and pictures. They will be able to link to other documents if the documents are available.
Here are some uses for HyperNote Pro. Context sensitive help can be created for applications. News or journal articles could be imported and your opinions added. Business reports could be enhances with graphs. Resumes could go into greater detail without overwhelming the reader. Students could turn in papers and teachers could comment on the text.
Another neat thing about HyperNote Pro is it self–replicating. By selecting “New HN…” and choosing a text–file, HyperNote Pro creates a copy of itself except with the text of the chosen file.
HyperNote Pro is free. It requires HyperCard 2.0 to run.
Features:
- any size text–file can be imported
- format the text with any available font
- add/edit pop–up notes and/or pictures to imported text
- add true hypertext links to any document or application
- includes a “super find” feature
- self–replicating
- System 7 compatible
        \ /
       - * -
     \ // \       Eric Lease Morgan, Systems Librarian
    - * -|\ /     North Carolina State University
     / \ - * -    Box 7111, Room 2111
      |  |/ \     Raleigh, NC 29695-7111
      \ /| |      (919) 515-6182
     - * - |
      / \| /
       | |/
    ===========   America Online: EricMorgan
     \=======/    Compu$erve: 71020,2026
      \=====/     Internet: eric_morgan@ncsu.edu
       =====      The Well: emorgan
P.S. Maybe I will be able to upload this stack to TileStack as seen on Slashdot.
2008-06-08T02:53:48+00:00 Mini-musings: Steve Cisler http://infomotions.com/blog/2008/06/steve-cisler/This is a tribute to Steve Cisler, community builder and librarian.
 Late last week I learned from Paul Jones’s blog that Steve Cisler had died. He was a mentor to me, and I’d like to tell a few stories describing the ways he assisted me in my career.
I met Steve in 1989 or so after I applied for an Apple Library of Tomorrow (ALOT) grant. The application was simple. “Send us a letter describing what you would do with a computer if you had one.” Being a circuit-rider medical librarian at the Catawba-Wateree Area Health Education Center (AHEC) in rural Lancaster, South Carolina, I outlined how I would travel from hospital to hospital facilitating searches against MEDLINE, sending requests for specific articles via ‘fax back to my home base, and having the articles ‘faxed back to the hospital the same day. Through this process I proposed to reduce my service’s turn-around time from three days to a few hours.
Those were the best two pages of text I ever wrote in my whole professional career because Apple Computer (Steve Cisler) sent me all the hardware I requested — an Apple Macintosh portable computer and printer. He then sent me more hardware and more software. It kept coming. More hardware. More software. At this same time I worked with my boss (Martha Groblewski) to get a grant from the National Library of Medicine. This grant piggy-backed on the ALOT grant, and I proceeded to write an expert system in HyperCard. It walked the user through a reference interview, constructed a MEDLINE search, dialed up PubMED, executed the search, downloaded the results, displayed them to the user, allowed the user to make selections, and finally turned-around and requested the articles for delivery via DOCLINE. I called it AskEric, about four years before the ERIC Clearinghouse used the same name for their own expert system. In my humble opinion, AskEric was very impressive, and believe it or not, the expert part of the system still works (as long as you have the proper hardware). It was also during this time when I wrote my first two library catalog applications. The first one, QuickCat, read the output of a catalog card printing program called UltraCard. Taking a clue from OCLC’s (Fred Kilgour’s) 4,2,2,1 indexing technique, it parsed the card data creating author, title, subject, and keyword indexes based on a limited number of initial characters from each word. It supported simple field searching and Boolean logic. It even supported rudimentary circulation — search results of items that had been checked-out were displayed a different color than the balance of the display. QuickCat earned me the 1991 Meckler Computers In Libraries Software Award. My second catalog application, QuickCat Mac, read MARC records and exploited HyperCard’s free-text searching functionality. Thanks goes to Walt Crawford who taught me about MARC through his book, MARC For Library Use. Thanks goes to Steve for encouraging the creativity.
Steve then came to visit. He wanted to see my operation and eat barbecue. During his visit, he brought a long a video card, and I had my first digital image taken. The walk to the restaurant where we ate his barbecue was hot and humid but he insisted on going. “When in South Carolina you eat barbecue”, he said. He was right.
It was time for the annual ALOT conference, and Steve flew me out to Apple Computer’s corporate headquarters. There I met other ALOT grantees including Jean Armor Polly (who coined the phrase “surfing the Internet”), Craig Summerhill who was doing some very interesting work indexing content using BRS, folks from OCLC who were scanning tables-of-contents and trying to do OCR against them, and people from the Smithsonian Institution who were experimenting with a new image file format called JPEG.
I outgrew the AHEC, and with the help of a letter of reference from Steve I got a systems librarian job at the North Carolina State University Libraries. My boss, John Ulmschneider, put me to work on a document delivery project jointly funded by the National Agriculture Library and an ALOT grant. “One of the reasons I hired you”, John said, “was because of your experience with a previous ALOT grant.” Our application, code named “The Scan Plan”, was a direct competitor to the fledgling application called Ariel. Our application culminated in an article called “Digitized Document Transmission Using HyperCard”, ironically available as a scanned image from the ERIC Clearinghouse (or this cached version). That year, during ALA, I remember walking through the exhibits. I met up with John and one of his peers, Bil Stahl (University of North Carolina – Charlotte). As we were talking Charles Bailey (University of Houston) of PACS Review fame joined us. Steve then walked up. Wow! I felt like I was really a part of the in crowd. They didn’t all know each other, but they knew me. Most of the people whose opinions I respected the most at that particular time were all gathered in one place.
By this time the “Web” was starting to get hot. Steve contacted me and asked, “Would you please write a book on the topic of Macintosh-based Web servers?” Less than one year, one portable computer, and one QuickTake camera later I had written Teaching a New Dog Old Tricks: A Macintosh-Based World Wide Web Starter Kit Featuring MacHTTP and Other Tools. This earned me two more trips. The first was to WebEdge, the first Macintosh WWW Developer’s Conference, where I won a hackfest award for my webcam application called “Save 25¢ or ‘Is Eric In’?” The second was back to Apple headquarters for the Ties That Bind conference where I learned about AppleSearch which (eventually) morphed into the search functionality of Mac OS X, sort of. I remember the Apple Computer software engineers approaching the Apple Computer Library staff and asking, “Librarians, you have content, right? May we have some to index?”
 To me it was the Ties That Bind conference that optimized the Steve Cisler I knew. He described there his passion for community. For sharing. For making content (and software) freely available. We discussed things like “copywrite” as opposed to copyright. It was during this conference he pushed me into talking with a couple of Apple Computer lawyers and convince them to allow the Tricks book to be freely published. It was during this conference he described how we are all a part of a mosaic. Each of us are a dot. Individually we have our own significance, but put together we can create an even more significant picture. He used an acrylic painting he recently found to literally illustrate the point, all puns intended. Since then I have used the mosaic as a part my open source software in libraries handout. I took the things Steve said to heart. Because of Steve Cisler I have been practicing open access publishing and open source software distribution for longer than the phrases have been coined.
A couple more years past and Apple Computer shut down their library. Steve lost his job, and I sort of lost track of Steve. I believe he did a lot of traveling, and the one time I did see him he was using a Windows computer. He didn’t like it, but he didn’t seem to like Apple either. I tried to thank him quite a number of times for the things he had done for me and my career. He shrugged off my praise and more or less said, “Pass it forward.” He then went “off the ‘Net” and did more traveling. (Maybe I got some of my traveling bug from Steve.) I believe I wrote him a letter or two. A few more years past, and like I mentioned above, I learned he had died. Ironically, the next day I was off to Santa Clara (California) to give a workshop on XML. I believe Steve lived in Santa Clara. I thought of him as I walked around downtown.
Tears are in my eyes and my heart is in my stomach when I say, “Thank you, Steve. You gave me more than I ever gave in return.” Every once in a while younger people than I come to visit and ask questions. I am more than happy to share what I know. “Steve, I am doing my best to pass it forward.”
2008-06-06T05:01:19+00:00 Water collection: Feather River at Paradise, California http://infomotions.com/water/index.xml?cmd=getwater&id=93 Map it |
I hacked together a Code4Lib Journal Perl module providing read-only access to the Journal’s underlying WordPress (MySQL) database. You can download the distribution, and the following is from the distribution’s README file:
2008-05-28T18:36:21+00:00 Mini-musings: Open Library, the movie! http://infomotions.com/blog/2008/05/open-library-the-movie/This is the README file for a Perl module called C4LJ — Code4Lib Journal
Code4Lib Journal is the refereed serial of the Code4Lib community. [1] The community desires to make the Journal’s content as widely accessible as possible. To that end, this Perl module is a read-only API against the Journal’s underlying WordPress database. Its primary purpose is to generate XML files that can be uploaded to the Directory of Open Access Journals and consequently made available through their OAI interface. [2]
Installation
To install the module you first need to have access to a WordPress (MySQL) database styled after the Journal. There is sample data in the distribution’s etc directory.
Next, you need to edit lib/C4LJ/Config.pm. Specifically, you will need to change the values of:
* $DATA_SOURCE – the DSN of your database, and you will probably need to only edit the value of the database name
* $USERNAME – the name of a account allowed to read the database
* $PASSWORD – the password of $USERNAME
Finally, exploit the normal Perl installation procedure: make; make test; make install.
Usage
To use the module, you will want to use C4LJ::Articles->get_articles. Call this method. Get back a list of article objects, and process each one. Something like this:
  use C4LJ::Article;
  foreach ( C4LJ::Article->get_articles ) {
    print '        ID: ' . $_->id       . "\n";
    print '     Title: ' . $_->title    . "\n";
    print '       URL: ' . $_->url      . "\n";
    print '  Abstract: ' . $_->abstract . "\n";
    print '    Author: ' . $_->author   . "\n";
    print '      Date: ' . $_->date     . "\n";
    print '     Issue: ' . $_->issue    . "\n";
    print "\n";
  }
The bin directory contains three sample applications:
1. dump-metadata.pl – the code above, basically
2. c4lj2doaj.pl – given an issue number, output XML suitable for DOAJ
3. c4lj2doaj.cgi – the same as c4lj2doaj.pl but with a Web interface
See the modules’ PODs for more detail.
License
This module is distributed under the GNU General Public License.
Notes
[1] Code4Lib Journal – http://journal.code4lib.org/
[2] DOAJ OAI information – http://www.doaj.org/doaj?func=loadTempl&templ=070509
For a good time, I created a movie capturing some of the things I saw while attending the Open Library Developer’s Meeting a few months ago. Introducing, Open Library, the movie!
2008-05-27T02:29:54+00:00 Mini-musings: get-mbooks.pl http://infomotions.com/blog/2008/05/get-mbookspl/I few months ago I wrote a program called get-mbooks.pl, and it is was used to harvest MARC data from the University of Michigan’s OAI repository of public domain Google Books. You can download the program here, and what follows is the distribution’s README file:
2008-05-27T01:50:33+00:00 Mini-musings: Hello, World! http://infomotions.com/blog/2008/05/hello-world/This is the README file for script called get-mbooks.pl
This script — get-mbooks.pl — is an OAI harvester. It makes a connection to the OAI data provider at the University of Michigan. [1] It then requests the set of public domain Google Books (mbooks:pd) using the marc21 (MARCXML) metadata schema. As the metadata data is downloaded it gets converted into MARC records in communications format through the use of the MARC::File::SAX handler.
The magic of this script lies in MARC::File::SAX. Is a hack written by Ed Summers against MARC::File::SAX found on CPAN. It converts the metadata sent from the provider into “real” MARC. You will need this hacked version of the module in your Perl path, and it has been saved in the lib directory of this distribution.
To get get-mbooks.pl to work you will first need Perl. Describing how to install Perl is beyond the scope of this README. Next you will need the necessary modules. Installing them is best accomplished through the use of cpan but you will need to be root. As root, run cpan and when prompted, install Net::OAI::Harvester:
$ sudo cpan
cpan> install Net::OAI::HarvesterYou will also need the various MARC::Record modules:
$ sudo cpan
cpan> install MARC::RecordWhen you get this far, and assuming the hacked version of MARC::File::SAX is saved in the distribution’s lib directory, all you need to do next is run the program.
$ ./get-mbooks.pl
Downloading the data is not a quick process, and progress will be echoed in the terminal. At any time after you have gotten some records you can quit the program (ctrl-c) and use the Perl script marcdump to see what you have gotten (marcdump <file>).
Fun with OAI, Google Books, and MARC.
[1] http://quod.lib.umich.edu/cgi/o/oai/oai
Hello, World! It is nice to meet you.
2008-05-27T01:09:40+00:00 Water collection: Cape Cod Bay at Race Point http://infomotions.com/water/index.xml?cmd=getwater&id=92Map it |
I got this water on Cape Cod where I attended the Massachusetts Library Association Annual Meeting (2008) and gave a presentation called "Next Generation Data Format". The weather was cool. The sun was bright. There was lots of sand. I visited one of the oldest Unitarian Churches, and I saw many others. I ate a lobster roll at a place called the Quarterdeck in Falsmouth. Very nice. I never made it to Martha's Vineyard. I saw Plymouth Rock instead, but it ws under construction. Go figure.
Note to astute archivist: The bottle depicts a blue cap, but it fell off and I had to find another. It's replacement is white.
2008-05-07T04:00:00+00:00 Musings: Next Generation Data Format http://infomotions.com/musings/ngc4mla/ In the United States library catalogs traditionally use the MARC standard for bibliographic records. Many questions revolve around the future of MARC and how it interacts with other metadata standards such as Dublin Core, MODS, and VRA Core. This presentation explores these and other issues related to the next generation catalog. Map it |
 Map it |
I had the opportunity to visit Bozeman, Montana to give a presentation to the Montana State University Libraries on the topic of open source software for their second annual symposium. The presentation went well, and I sincerely believe people went away with a broader understanding of what the open source software process can (and can not) do for the library profession.
While I was there I took time to be a tourist. One of the places I visited was the headwaters of the Missouri River. As Lewis and Clark made their way across the United States the were constantly looking out for the beginnings of the Missouri. "Is this river bigger than that river? Yes, then the Missouri continues." At this point none of the rivers were bigger than the others. This is where the Missouri River begins. "Thank you Wally for recommending this jaunt." Also along the way I touristed in Yellowstone National Park. It snowed the evening prior. I saw boiling mud and Old Faithful (for a second time). Quite impressive!
2007-10-03T04:00:00+00:00 Musings: Open source software at the Montana State University Libraries Symposium http://infomotions.com/musings/oss4msu/ This one-page essay outlines what open source software (OSS) is and how it can be applied to some of the computer-related problems facing libraries. In short, it characterizes open source software as a community-driven process, describes it as free as a free kitten, compares it to the principles of librarianship, and finally, outlines how it can be exploited to develop next generation library catalogs. Map it |
 Map it |
 Map it |
 Map it |
The collectors of the water say: Lago Paranoa, embraces the east side of the city of Brasilia. The Paranoa lake was conceived through the controlled harnessing of waterways (dam) to include the Rio Paranoa, Rio Torto, Rio Bananal, Rio Fundo, Rio Vicente Pires and a grouping of creaks named Gama. The objective behind the development of Lago Paranoa aimed at raising the humidity of the air in this regional dry climate. The lake's development brought temperatures in the region to the average highs of 85 degrees around September, and average lows of 65 in July. Its area covers 40 km, with a perimeter of 80 km. It's shores are dedicated to sports clubs, restaurants, and areas of leisure. Water quality "clean".
I appreciate the time and effort they spent. "Thank you very much!"
2007-04-08T04:00:00+00:00 Musings: Leading a large group http://infomotions.com/musings/large-group/ The other day someone asked me about how we here at Notre Dame managed a team of 28+ members in regards to our one-year institutional digital repository pilot project (www.library.nd.edu/idr). I did my best to address their questions, and I thought I would copy my reply below. It might prove useful in your setting. (Then again, it might not.) Map it |
 Map it |
 Map it |
 Map it |
Martin and I collected this water during the OAI4 conference at CERN. While we were there we toured Geneva and the Chateau de Chillon.
There are many things to remember about collecting this particular water including the effortless and sincere conversation during the plane ride to Zurich, $0.99 pictures, feeling excited and elated as if I could not lose, walking and then running in the rain, touching but not seeing the Mur de la Reformation, picking up the conversation exactly where it left off, being "younger", discussing religion, sharing dreams, sharing most embarassing moments, sharing inner secrets and reasons why we are the people we have become, and wishing the evening would never end. The clock on the wall had stopped at 10:53. I asked when it was time to go. The answer came easily and without hesitation. "At 11 o'clock."
During the process of collecting this water I learned more than the latest developments regarding the use of OAI and the implementation of institutional repositories. I learned about myself and experienced a lovely, enchanting spell.
Geneva was beautiful.
2005-10-22T05:00:00+00:00 Musings: Exploiting "Light-weight" Protocols and Open Source Tools to Implement Digital Library Collections and Services http://infomotions.com/musings/protocols-and-oss/ This article describes the design and implementation of two digital library collections and services using a number of light-weight protocols and open source tools. These protocols and tools include OAI-PMH (Open Archives Initiative-Protocol for Metadata Harvesting), SRU (Search/Retrieve via URL), Perl, MyLibrary, Swish-e, Plucene, ASPELL, and WordNet. More specifically, we describe how these protocols and tools are employed in the Ockham Alerting service and MyLibrary@Ockham. The services are illustrative examples of how the library community can actively contribute to the scholarly communications process by systematically and programmatically collecting, organizing, archiving, and disseminating information freely available on the Internet. Using the same techniques described here, other libraries could expose their own particular content for their specific needs and audiences.Map it |
 Map it |
The Morgan Territory Nature Preserve was created from a ranch previously owned by a man named Morgan. Originally a '49er from Alabama, and not finding his fortune in gold he returned East for his family and came back to the West Coast. While on a hunting trip he apprectiated the countryside and apparently created a ranch there. The area is now a large park. The walk was clean, peaceful, and relaxing.
I had the opportunity to see this place because I gave my XML workshop for the folks of the Lawerence Livermore National Laboratory. The nearby windmills were very impressive.
2005-06-02T05:00:00+00:00 Musings: IOLUG Spring Program http://infomotions.com/musings/iolug-2005/ On Friday, May 20 I attended the Indiana On-Line Users Group (IOLUG) Spring Program called Marketing your library on the Web, and this text outlines what I learned there. Map it |
 Map it |
When I arrived in Fairport, NY to give my open source software workshop I was very surprized to find that the venue was right next to the Erie Canal. "Low bridge. Everybody down. Low Bridge. We're comin' to a town...Ever navigated on the Erie Canal."
The workshop went just fine. I played disc golf at Ellison Park. I visited the University of Rochester library and saw a very cool cemetery nearby. Most importantly, I visited with Ted and Jean Miller. They are the parents of my oldest friend, Mark, and Ted was my first library mentor.
2005-04-15T05:00:00+00:00 Musings: So you want a new website http://infomotions.com/musings/website-summary/ This text outlines the process the University Libraries of Notre Dame used to redesign its website. It includes a presentation of the various assessment activities utilized (surveys, focus group interviews, usability studies). It also includes a description of how the libraries articulated a vision for the website and a strategic plan. Finally, the text describes some of the retrospective conversion processes we had to implement in order to make things usable and consistent.Map it |
 Map it |
I collected this water while attending the European Conference on Digital Libraries, 2004. It was a lot of fun to stand around the Roman Bath drinking wine. After I collected this water one of the waiters came up to me and asked where I gotten it. I did not lie, and he took my water way. "No problem", he said, "I will get you some from the original spring".
While in Bath I toured the countryside. As I was the Ugly American in my Land Rover I saw Stonehenge, Avebury Circle, and Chedder Gorge. The citizens of Bath have every right to proud of the surrounding architecture.
2004-10-12T05:00:00+00:00 Musings: Symposium on open access and digital preservation http://infomotions.com/musings/open-access-symposium/ This text documents my experiences at the Symposium on open access and digital preservation, Emory University, Atlanta, Georgia, October 2, 2004.Map it |
 Map it |
 Map it |
 Map it |
 Map it |
 Map it |
 Map it |
 Map it |
 Map it |
 Map it |
Map it |
 Map it |
 Map it |
 Map it |
 Map it |
 Map it |
 Map it |
 Map it |
 Map it |
 Map it |
 Map it |
 Map it |
 Map it |
 Map it |
 Map it |
 Map it |
 Map it |
 Map it |
 Map it |
 Map it |
 Map it |
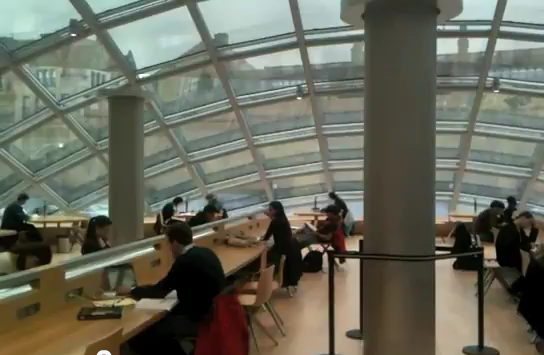


