![]()
Frontline Learning Research Vol.5 No. 3 (2025) 1
- 28
ISSN 2295-3159
1 University of Helsinki,
Finland
2Aalto University, Finland
Article received 30 December 2023 / Article revised 13 March 2025 / Accepted 13 May 2025/ Available online 26 May 2025
This research examines students' emotional states during a virtual course at a Finnish university. The mixed methods study drew on students' experienced emotions, perceived course value, perceived control, and open-ended descriptions related to their emotions. The sample consisted of 85 university students. Data were collected at nine measurement points during a half-semester foundation course in statistics. Through latent profile analysis (LPA), we identified five distinct learner profiles described as the “Average”, “Struggling”, “Thriving”, “Victorious”, and “Determined”, and analysed how they differ based on students’ gender, form of course implementation, previous attempts at the same course, and performance. The longitudinal design revealed distinct study experiences amongst the five profiles and pinpointed that most of the challenges took place in the middle of the course. The qualitative analysis of open responses identified different explanations students gave for the changes. The multiple measurement points bring forth emotional fluctuation, which is missed if only pre-post measures are used. The multi-measurement point approach, with the identification of emotion profiles and qualitative accounts on student experiences makes a novel contribution to the field by showing how emotions fluctuate in various profiles.
Keywords: emotion; control-value theory; latent profile analysis; virtual learning
The widespread use of digital tools and environments in higher education presents us with new perspectives and forms of learning that benefit from different technologies. The current generations of students have grown up with virtual environments and expect these to be available for learning (Tan et al., 2021). By virtual learning in this research, we understand learning that takes place in a completely virtual context or in a blended context, in which virtual and face-to-face learning alternates.
Researchers studying virtual learning environments have begun to acknowledge the role of student emotions and their study experiences in such learning environments (Tan et al., 2021). Research in education, neuroscience, and psychology have revealed that emotions are important in learning (Seli et al., 2016; Tyng et al., 2017; Um et al., 2012). In education, there has been specific interest in how emotions influence students’ learning processes, experiences of learning, and achievement (Daniels et al., 2009; Lu et al., 2023; Pekrun & Linnenbrink-Garcia, 2012). Our research adds to this literature by examining the dynamics of emotional experiences in a virtual learning environment and, secondly, examining qualitatively student experiences related to these dynamics.
Positive emotions have been shown to be associated with higher learning performance; negative emotions with poor learning performance (Ge, 2021; Jarrell et al., 2017). Students who have positive experiences are more likely to re-enrol in virtual courses again (Wang & Newlin, 2000). Students’ experiences and learning-related emotions play an important role in their behavior, performance, motivation, and the quality of their learning. Challenges can make students feel fear or anxiety and drop out of a course, while success in an exam may lead to relief and boost the motivation to finish a course (Diaz-Espinoza, 2017; Goetz et al., 2003; Pekrun, 2006; Pekrun & Linnenbrink-Garcia, 2014). Emotional factors have been discussed as one reason for high drop-out rates in virtual learning (Im, 2007; Rowe, 2006). At the same time, students' self-efficacy (Zajacova et al., 2005) and commitment (Human-Vogel & Rabe, 2015) are related to students’ academic performance and capacity to complete a course successfully (Bandura, 1991, 1977). When studying affective and motivational factors of learning in an online mathematics course, self-efficacy appeared to be a significant individual predictor of student achievement (Kim et al., 2014).
Previous studies on students’ emotions in learning have used more variable-oriented (e.g., gender or achievement) than individual-oriented approaches (Ganotice et al., 2016; Jarrell et al., 2017; Tamin et al., 2011) and typically investigated how emotions (e.g., duration, frequency, intensity, and valence) affect student performance. The variability or the fluctuation of emotional states has been less studied (Henritius et al. 2019; Harley et al., 2016; Li et al., 2021). However, emotions may vary during the course, for example, because of failing or succeeding in a task (Jarrell et al., 2017). A student may have ups and downs while studying a course and individuals differ in how they cope with failure (Jarrell et al., 2017). Moreover, repeating an academic course may have emotional implications (Lewis, 2020).
This research investigates the emotional states of university students during a virtual learning course. The study examines students' self-reported perceived control (self-efficacy), perceived value (commitment), and experienced emotions, identifying five distinct learner profiles. The article commences with an overview of the theoretical framework, emphasizing the Control-Value Theory (CVT), which has been specifically developed to describe academic emotions related to learning (Pekrun, 2006). CVT offers a comprehensive and integrated approach to the study of emotions, making it particularly useful in mixed-methods research such as ours (Pekrun et al., 2010). This research utilizes a mixed methods approach, integrating both quantitative and qualitative data to provide a comprehensive analysis of these experiences. Subsequently, the article discusses the methodology employed in the study, encompassing the mixed methods approach and data collection procedures. The results section elucidates the findings of the latent profile analysis, identifying the five learner profiles and their characteristics. This is followed by a qualitative analysis of students' open-ended responses, elucidating the reasons behind their emotional experiences.
The Control-Value theory (CVT) is based on attribution and expectancy value approaches, and it identifies students' emotions related to their learning performance (Pekrun, 2006; Pekrun et al., 2010; Pekrun, 2024). According to the theory, two types of cognitive-motivational factors, namely perceived control (e.g., expectations, self-efficacy, perceived competence, and perceived control over outcomes), and perceived value (e.g., perceived importance of success, intrinsic interest, utility value, and attainment value), are the main sources of achievement of emotions (Pekrun, 2006; Pekrun, 2024). This entails in practice that students experience pleasure when they are interested and confident; pride when they value the outcome and have a sense of control, and anxiety when they feel the outcome is important but do not experience sufficient control to avoid failure.
The CVT concept perceived control includes self-efficacy (Bandura, 1997), which makes research on self-efficacy highly relevant to CVT. On the other hand, Human-Vogel & Rabes’ (2015) and Pillai & Williams’ (2004) research on commitment is relevant to values.
Environmental factors, such as student support and atmosphere, can influence students' evaluations of their control and values, which in turn affects their emotions and academic learning performance. For example, in a supportive learning environment where students receive positive feedback from peers and teachers, their feelings of control and value can be strengthened. This supportive atmosphere can lead to positive emotions, such as joy and pride, which promote better learning performance. Conversely, a negative environment with little support can diminish students' sense of control and value, leading to negative emotions such as anxiety and frustration, which can hinder learning performance. CVT highlights the importance of environmental factors in shaping students' evaluations of their control and values, which subsequently influence their emotions and learning achievement (Pekrun, 2006).
The theory provides an integrative framework for analyzing the antecedents and effects of emotions experienced in achievement and academic settings. Emotions are not only an outcome of the process, but they also influence attention, thoughts, actions, and learning performance (Pekrun, 2024). Empirical research has confirmed that positive activating emotions (e.g. enjoyment) are beneficial for learning, while negative deactivating emotions (e.g. boredom) have detrimental effects (Pekrun, 2024). On the other hand, effects of activating negative emotions (e.g. anxiety) and deactivating positive emotions (e.g. relief) suggest more complex relation to performance and the empirical evidence is mixed (Pekrun, 2024).
Emotion theories and empirical evidence suggest that the positive emotions promote the more inductive, bottom-up thinking while the negative emotions would promote the more deductive, top-down thinking (Forgas 2008). Hence, positive emotions seem to better facilitate creative processes, while the negative emotions would facilitate reliable memory retrieval and performance of routines (Pekrun & Stephens, 2010). While moderate anxiety may thus help in some cognitive tasks, more intense anxiety seems to be exclusively detrimental for learning – likely because attention is directed towards worries, overloading working memory (Ashcraft and Krause, 2007; Rubinsten and Tannock, 2010)
Furthermore, CVT emphasizes also the multiplicative effects of control and value appraisals on emotions. According to the theory, both control and value influence emotions in a multiplicative manner: positive emotions arise when both factors are high, while negative emotions occur when control and perceived values are low. This means that perceived value moderates the relationship between perceived control and emotions. CVT highlights the mutual reinforcement of control and value: when both factors are present to a sufficient degree, they reinforce each other, intensifying the emotional reaction (Pekrun, 2006).
Patterns in individual emotional experiences have been identified in prior research, often using a latent profile analysis (LPA) (e.g., Orri, 2017; Wang et al., 2021; Wang et al., 2023; Wytykowska et al., 2022). The person-centered approach offers a holistic and parsimonious way to study affective personality dimensions (Orri, 2017). A longitudinal study on affective personality profiles and unique patterns in emotional experiences showed that profiles were consistent over time (Orri, 2017). The study showed that women tended to experience slightly stronger negative emotions and slightly weaker positive emotions compared to men. The study identified three latent personality profiles using the Affective Neuroscience Personality Scales ANPS: Seeking, Caring, Playfulness, Fear, Anger, and Sadness. These profiles were consistent across time and genders, with some variations in the intensity of emotions experienced by women and men. Associations between profiles and emotion regulation skills measures (e.g., emotional intelligence) offered concurrent validity evidence. Another study (Wang et al., 2021) identified students' differences in self-efficacy (perceived control) operationalized as students’ confidence in English-as-a-foreign-language skills with a person-centered approach and comparing students in distinct self-efficacy profiles on language proficiency and academic emotions. The results identified three groups representing low, medium, and high self-efficacy levels. Students in the low and medium self-efficacy groups showed differences in most measures of academic emotions but not in language proficiency. The third studied university students’ psychological development during the COVID-19 outbreak. Three profiles were identified as having high, moderate, and low adaptation. The students with high adaptation possessed a more positive self-efficacy (perceived control) belief and demonstrated lower levels of anxiety. In contrast, the students with low adaptation possessed a less positive self-efficacy beliefs and demonstrated higher levels of anxiety (Wang et al., 2023).
Prior attempts to complete a course, the form of the course, and gender have been identified as influencing the learning experience. Students’ previous knowledge of the subject has been found to have a significant effect on learners' achievements (Hailikari et al., 2007; 2008). For example, learners with more extensive academic preparation tend to have better academic success (Kurlaender & Howell, 2012), and conversely, inaccurate knowledge can hinder future development (Ambrose, et. al., 2010). On the other hand, research has also shown that there is not always strong evidence for the positive effect of repeated practice intervals on learning. For example, a study by Arnold (2017) found that while some students benefit from repeated practice, others do not show substantial improvement, indicating that the effectiveness of repetition can vary depending on individual learning styles and contexts. Additionally, repeating an academic course appears to have emotional consequences in the form of grief and loss (Lewis, 2020). Furthermore, it has been shown that the pass rates of students on their second attempt are significantly lower than of those students enrolled in their first attempt (Snead et al., 2022).
Student performance in a virtual course can be significantly different compared to their performance in a traditional course (Schoenfeld-Tacher et al., 2001) and the research shows that course design, time management problems, commitment (CVT: perceived value), lack of peers, and familiarity with technologies are the general issues that arise and have an impact on students' emotional experiences in virtual learning (Akojie, 2019; Allan, 2012; Blackmon & Major, 2012; Howland & Moore, 2010; Song et al., 2004). Furthermore, research has identified that student achievement is related to their satisfaction and correlated with their anger, boredom, and enjoyment (Henritius et al. 2019; Baturay, 2011; Chaparro- Peláez et al., 2013; Kim et al., 2014; Lin et al., 2015). Yet another aspect that has been identified in prior research as influencing emotions in virtual learning, is gender. Research has indicated that female students exhibited stronger self-regulation, which led to their significantly more positive virtual learning outcomes than those experienced by males (Alghamdi et al., 2020). However, previous studies have also shown gender differences related to student anxiety (Naghavi & Redzuan, 2011). Female students have more emotional distress, which has negative effects on students' performance (Cassady & Johnson, 2002; Hembree, 1988; Chin et al.,2017).
Research has captured changes in emotions or the relationship between emotions and personally meaningful situations during learning (Anwar et al., 2023; D’Mello, 2013; Strain et al., 2011). However, we found only two studies (Hilliard et al., 2019; Madsgaard et al., 2022) that have explored emotions in virtual learning environments through multiple measurement points throughout the learning process. Emotions are generally studied retrospectively rather than in situ (Eteläpelto et al., 2018). In research on students’ self-reported experiences of emotions during simulation-based education (Madsgaard et al., 2022), several emotions were identified, including anxiety, engagement, eagerness, derailment, dreadfulness, fear, nervousness, and stress. Fear was found to be related to performance pressure and the desire to complete the simulation; dread was related to the pressure to manage technical equipment. Students shared the experience of feeling frustrated because of not being as well prepared as they had hoped, or when they felt uncertain about what would happen during the scenario. During the simulation students felt tired, exhausted, and overwhelmed. After the simulation, some mentioned that they had a good feeling because they had managed to handle the situation (Madsgaard et al., 2022).
In a second study that investigated students’ emotional experiences during an online, collaborative group project (Hilliard et al., 2019), self-report data about the experienced emotions and their causes were gathered using a structured diary at six points of time during the group activity. Findings revealed that learners experienced a range of pleasant and unpleasant emotions before, during, and after the collaborative activity. Pleasant emotions were associated with completing the project (e.g., satisfaction) or working with others (e.g., enjoyment). Many unpleasant emotions stemmed from self-beliefs (e.g., anxiety) or students not communicating or participating (frustration, disappointment, and anxiety). A lack of guidance and support predominantly from the course content and the tutor were a source of unpleasant emotion for some learners. Collaborating with others, workload, task difficulty, and assessment timing were commonly cited reasons for unpleasant emotions.
To understand the variability of emotions, this study examined the change in students' emotions, perceived value of the course, and feeling of control at several measurement points during a virtual course. Through open-ended questions, we also gained more detailed information about students' experiences. Furthermore, we examined how previous course attempts, gender, and course format were related to students' learning experience and achievements. We used CVT as a framework for understanding students' academic emotions.
The following research questions were addressed:
1. How do student experiences change in terms of their perceived control and value of the course, and achievement emotions over the duration of a virtual course?
2. How are students’ perceived control and value of the course, and achievement emotions related to prior course completion attempts, form of course implementation (blended vs. completely virtual), gender, and performance in a virtual course?
3. What reasons do students give for their experienced achievement emotions, perceived control, and value of the course?
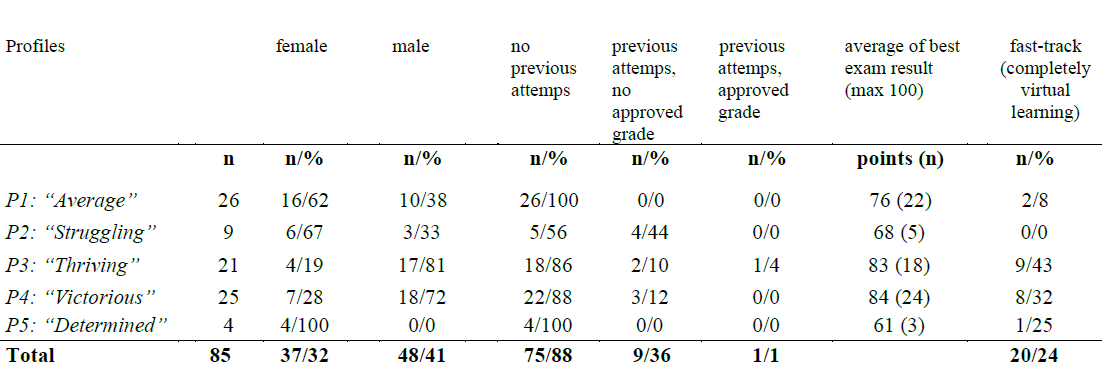
The research was conducted in a half-semester (approximately eight weeks) foundation-level statistics course at a large public research university in Finland. The virtual course had two forms of course implementation: blended learning and completely virtual learning (named “fast track”). The difference between the two options was a weekly face-to-face group meeting for the blended course participants. The course was intended for degree program students and had 450 participants. Eighty-five students volunteered to participate in this study (65 completely virtual and 20 blended learning students). Seventy-two of those students participated in the course exam. Basic descriptive statistics are presented in table 1.
Table 1
Basic descriptive statistics of background variables for the entire dataset (n=85 students)
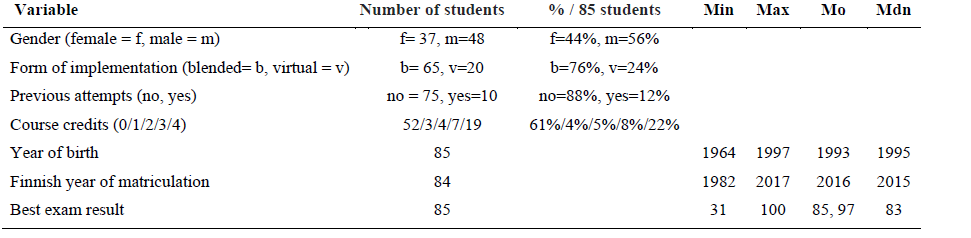
Note. Min= minimum value; Max= maximum value; Mo= mode;
Mdn=median.
Note. Course credits: 0=0 credits, 1= 1-29 credits, 2=
30-6 credits, 3= 61-120 credits, 4= more than 120 credits.
Note. One person out of 85 students did not have a Finnish
matriculation examination.
Note. Best exam results: only those students who have
completed the course exam are considered.
Participation in research was voluntary and based on informed consent. Consent was indicated on a form. The students’ decisions to participate or not to do so had no influence upon the treatment they received at the university or their grading. Students had the right to cancel their participation in the research at any time without notice. The researchers followed the guidelines of the Finnish National Board on Research Integrity (TENK, 2019). In Finland, an ethics review is required when research involves intervention in the physical integrity of research participants; deviates from the principle of informed consent; involves participants under the age of 15 being studied without parental consent; exposes participants to exceptionally strong stimuli; risks causing long-term mental harm beyond that encountered in normal life; or signifies a security risk to subjects (TENK, 2019, p.19). None of these conditions materialized in this study, and consequently an ethics review was not required.
Students received a short weekly online questionnaire nine times (measurements M0-M8) during the course. The first survey point (M0) was before the beginning of the weekly online tasks and the last was at the end of the course (M8). All material, literature, and general information was published on the online platform including the weekly questionnaires. The researchers only processed anonymized material without individual identifiers. We included only complete data, i.e. those students who had responded to all the surveys.
Based on CVT, we used three questions to measure students’ emotions during the course, namely “I have a good feeling about the online work of the course” (CVT: achievement emotion), “I cope well with the course's online tasks” (CVT: perceived control), and “I am committed to completing the course” (CVT: perceived value). For each item, a 5-point Likert-type scale (1 = strongly disagree; 5 = strongly agree) was used.
We chose to use single items for several reasons. Firstly, we aimed to minimize the burden on students by keeping the survey concise, especially given the frequency of the weekly measurements. This approach aligns with the literature that supports the use of single items in psychological research (Allen et al., 2022). Secondly, while we acknowledge that established and differentiated instruments like the AEQ by Pekrun et al., (2011) exist for measuring performance emotions, our study's design required a more streamlined approach. The single item "I have a good feeling about the online work of the course" was intended to capture a general sense of the students' emotional state without overwhelming them with lengthy questionnaires. We recognize that this may simplify the measurement of emotions, but it was a necessary compromise to ensure high response rates and participant engagement. Additionally, the collected qualitative data provided deeper insights into the students' emotional experiences, complementing the single-item quantitative measures. This mixed-methods approach allowed us to balance the need for brevity with the richness of qualitative descriptions. We have acknowledged the limitations of using single items in our manuscript and discussed how this choice may have influenced the reliability of our findings. We believe that despite these limitations, the single items provided valuable insights into the students' emotional states during the course.
The survey also included one open-ended item in which the participants could describe in their own words their emotions and the reasons for these, namely “Justify your answer briefly”, which was part of the weekly survey. In addition, we obtained background information regarding gender, form of course implementation, previous attempts and exam scores.
We applied person-centered latent profile analysis (Spurk et al., 2020) on the weekly collected data on student experiences during the course. All data processing and statistical analysis were performed with the Rstudio statistical computing software (version 4.4.2; R Core Team 2020) and the Latent Profile Analysis (LPA) was conducted using the tidyLPA package in R (Rosenberg et al., 2018). A latent profile represents a subgroup of individuals who share a pattern of responses on a set of variables (Lanza, 2016). Based on statistical model fit indices (Nylund et al., 2007; Lo et al., 2001), we selected a model with five profiles. While some fit indices are likely to be inflated because of the repeated measurement, the information is valid for finding the best from alternative models. As a result of the latent profile analysis (LPA) the Akaike Information Criterion (AIC) (4790), and Bayesian Information Criterion (BIC) (5196) had the smallest values and entropy was 0.987 (Akaike, 1987; Schwarz, 1978), which can be seen as an indicator of an optimal number of profiles modelled from the data. From one profile model to four profile models, the BIC dropped rapidly (6186-5429-5374-5308), furthermore there was a clear drop in BIC value when moving from four profiles to five profiles (5308-5196). Similarly, the SABIC value decreased correspondingly to the BIC value (Sclove, 1987). From a five-profile model to a six-profile model only one individual was added, and the smallest profile size was considered to be too small (Marsh et al., 2009). For five profiles the Bootstrap Likelihood Ratio Test (BLRT) was statistically significant at p<.01, indicating this to be an appropriate number of profiles. (see Table 2).
Table 2
Results of LPA with 5-profile model
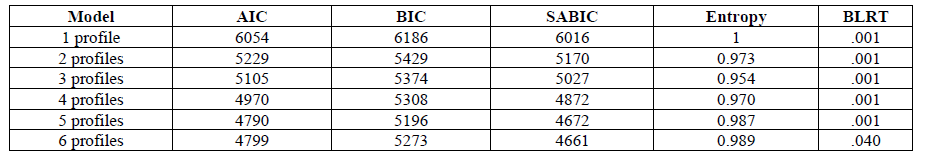
We chose LPA (Latent Profile Analysis) even though it is not the most typical analysis to use in similar studies - it can even be considered a bit naive approach (Den Teuling et al., 2021). On the other hand, it answers the questions posed, and the analysis converges even in our small sample. Moreover, e.g. the growth curves offer a distinctly different perspective compared to the assumption that the points form an overall picture of various respondents.
We decided that although a 3-profile model might be statistically stronger, the 5-profile model is qualitatively justified and provides more insights into students' experiences. This model is an important part of our research, even if it does not fully meet statistical criteria. Using multiple variables in profile analysis is justified because it gives a more accurate picture of the process and adds information for identifying profiles. However, this also increases the risk of random deviation, making it important to examine profiles qualitatively. Furthermore, we chose to use a profile under the 5% threshold due to the nature of our research. Our study allows us to capture valuable nuances and variations. This approach provides deeper insights into the phenomena under investigation, which might not be fully captured through a purely quantitative lens. We believe that showcasing this variation is crucial for a comprehensive understanding of the research context, even if it falls below the typical quantitative threshold. This approach aligns with our research objectives and enhances the richness of our findings.
To find out statistically significant differences between profiles we conducted Chi-Square tests to determine whether there were any differences in gender, Kruskal-Wallis H test for best exam results differences (where the normal distribution of the sample means was not possible), and a one-way analysis of variance (p < .05) in terms of students’ perceived control and value, and emotion differences between profiles followed by a post hoc Tukey HSD test.
Students justified their 5-point Likert-type scale answers (concerning emotions, commitment, and self-efficacy) with open-ended answers. The open-ended responses were coded using an inductive approach and systematically collected into a spreadsheet. Emotions (such as anger, fear, etc.) and relevant aspects like student motivation were identified separately for each measurement point. The first author coded all data and then took selected coding to be discussed with the second and the last author, who discussed the coding until reaching consensus. We included several data excerpts in the results section to allow the reader to judge our interpretations.
In some cases, the justifications could contain additional information. For example, when seeking a justification for the given value of the satisfaction question, the students could also describe their general emotional state or perceived control or value at the same time. The justifications for the answers were analysed in relation to the corresponding question, and in addition, any other comments that the student had made were extracted from the answers.
In each profile, the key issues were identified at each measurement point. These key issues included the difficulty of course assignments and student motivation. A summary was then made of the issues most frequently highlighted in each profile, based on cumulative observations from all measurement points. Additionally, all emotions that emerged from the data (e.g., anxiety, depression, frustration) were identified at each measurement point. For each identified emotion, student responses were recorded. As all student responses were given in the context of studying this course, we interpreted all emotions as achievement emotions. This was supported by the content of the open responses.
From the qualitative analysis, we identified three recurring themes: workload, motivation, and other emotional experiences. Each student profile is described through these three themes and chronologically evolving from the first to the last measurement point.
We explored the evolution and variation in students’ achievement emotions, perceived value, and perceived control, identifying five distinct profiles. The responses to the open-ended questions shed light on what the students perceived as the reasons for their experiences.
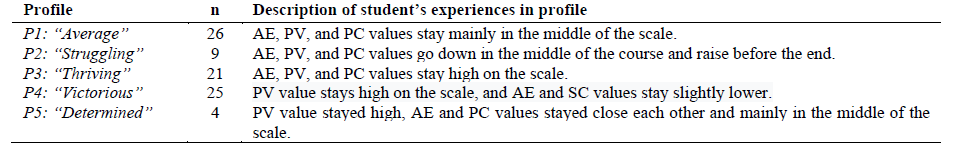
Based on a latent profile analysis, students’ perceived control (PC), perceived value (PV), and achievement emotions experienced (AE) over the duration of a virtual learning course resulted in five profiles. While two of the profiles had very few students (four and nine), the dynamics of their learning experiences seemed to be sufficiently different from other profiles. Hence, we decided to include them in the qualitative analysis. In qualitative analysis exceptional cases can be illuminating (Donaldson et al., 2013). The profiles with distinct experiential paths were named as follows: the “Average”, the “Victorious”, the “Struggling”, the “Thriving”, and the “Determined” (see Table 3).
Table 3
The evolution of students' experiences by profile
Note. AE= achievement emotion, PC=perceived control, PV=perceived value.
There was a significant effect of profile on AE, PC, and PV at the p < .05 level. The post hoc Tukey HSD test showed significant differences in AE and PC values (p .001) between profiles in the first half of the course (at the measuring points 2–4), and in PV at the measuring points 4–7 (see additional Online Resource Appendix 1, Table 11). In the "Determined" profile the values are at their lowest at early measurement points (mp 2 and 3), and in the profiles "Average", "Struggling" and "Victorious" at mp 4 or 5 (see Fig.1) (see additional Online Resource Appendix 1, Table 11 and Appendix 2, Table 12).
In all profiles, AE and PC values (M and SD) stayed lower than PV during the whole course (see Table 4). In the "Determined" profile, it appears that a decrease in AE is followed by a decrease in PC, and in the "Struggling" profile, PV, AE, and PC decrease or increase in similar patterns (see Fig.1). AE and SC values stayed mainly lower in the "Determined" profile and in the "Struggling" profiles all the values (AE, PC, PV) stayed lower than in the other profiles during the whole course (see Fig.1).
Table 4
Students’ achievement emotions, perceived control and values M and SD values
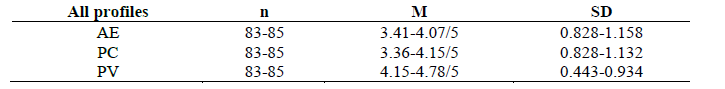
Note. AE=achievement emotion, PC=perceived control, PV=perceived value.
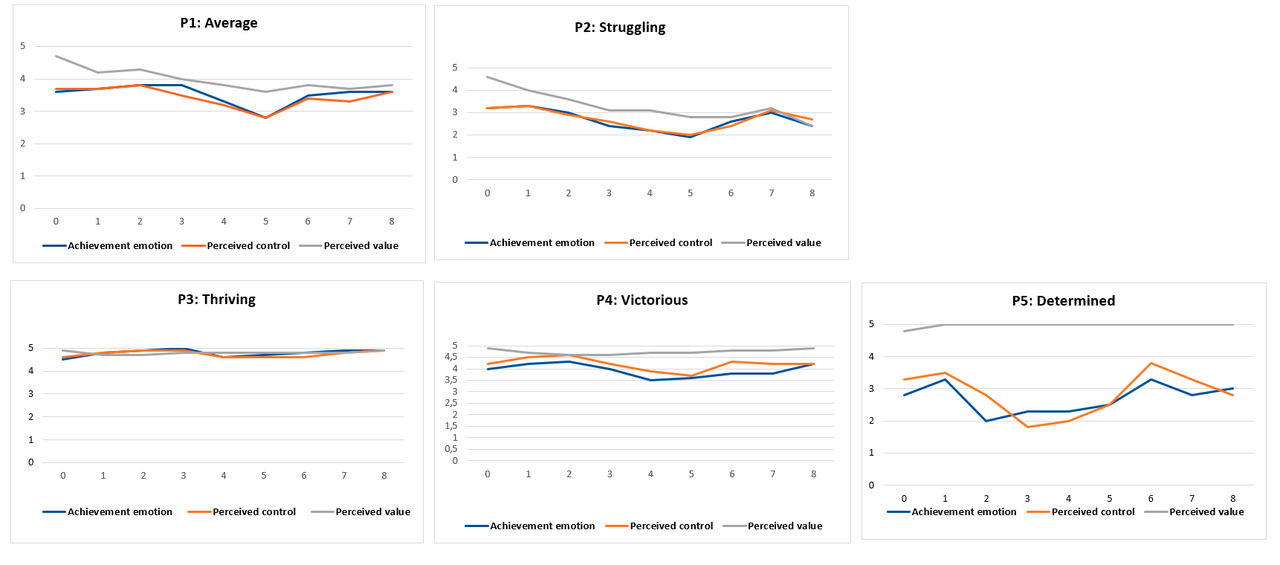
Figure 1. Student’s experiences in achievement emotion,
perceived control, and perceived value by profile.
Note. Values based on weekly surveys results grouped by
the mp (measuring point) 0-8.
A Chi-Square Test showed that the gender differences between the profiles were statistically significant: χ² (4, 2) = 18.153, p < .001. However, it is worth noting that three cells (30%) had an expected count of less than 5 when the minimum expected count was 1.74. In the “Average”, “Determined”, “Struggling”, and ”Victorious” profiles there were more female than male students (see Fig.2, Table 5).
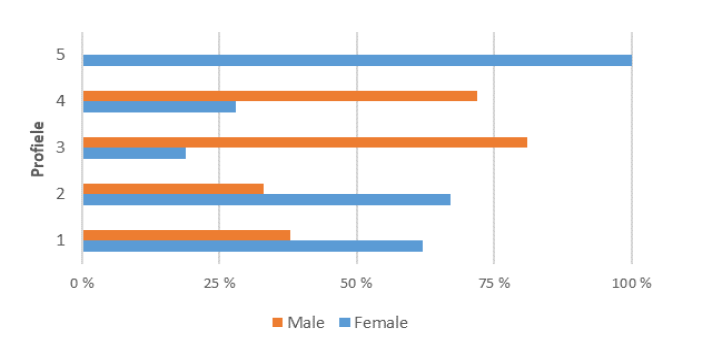
Figure 2. Gender distribution (n=85 students) by profile.
Note. Profiles: 1: “Average” (n=26), 2: “Struggling”
(n=9), 3: “Thriving” (n=21), 4: “Victorious” (n=25), and 5:
“Determined” (n=4).
Furthermore, there were differences between the profiles based on form of course implementation (blended, fast track): χ² (4, 2) = 11.755, p < .05. In every profile, more students chose the blended form of course implementation than fast track. In the “Thriving” (43%) and “Victorious” (32%) profiles, the proportion of students who had chosen fast track was the highest (see Fig.3, Table 5). However, the results should be interpreted with caution as four cells (40%) had an expected count of less than 5 when the minimum expected count was .94.
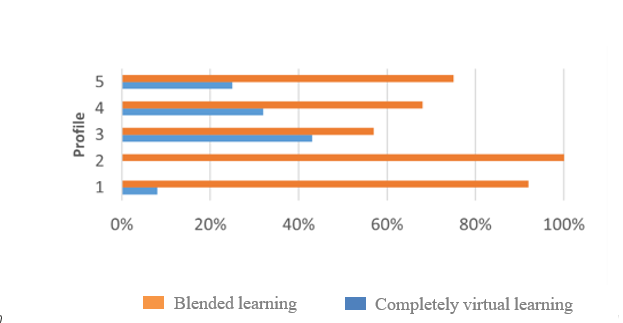
Figure 3. Form of course implementation (n=85 students)
by profile.
Note. Profiles: 1: “Average” (n=26), 2: “Struggling”
(n=9), 3: “Thriving” (n=21), 4: “Victorious” (n=25), and 5:
“Determined” (n=4).
In the “Struggling” profile, there were more students that had previously attempted the course without an approved grade than in the other profiles (see Fig. 4, Table 5). The relationship between the number of previous attempts and the profiles could not be determined, as the number of students who had previous attempts at the course was very small (0-4 students per profile).
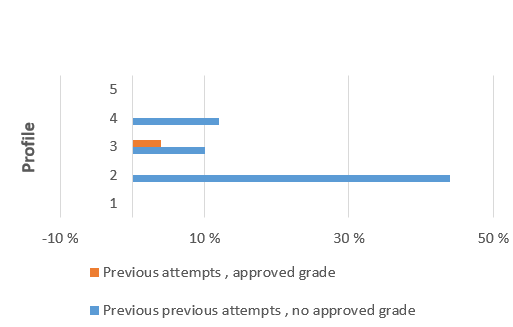
Figure 4. Previous attempts (n=85 students) by profile.
Note Profiles: 1: “Average” (n=26), 2: “Struggling”
(n=9), 3: “Thriving” (n=21), 4: “Victorious” (n=25), and 5:
“Determined” (n=4).
When comparing the Kurskal-Wallis H test’ best exam results of different profiles, we first removed from the data 13 students who had not taken the exam. The main test identified significant differences between profiles (p < .05), but none of the pairwise comparisons had significant differences. The students in the “Victorious” and “Thriving” profiles had the best exam results (see Fig. 5, Table 5).
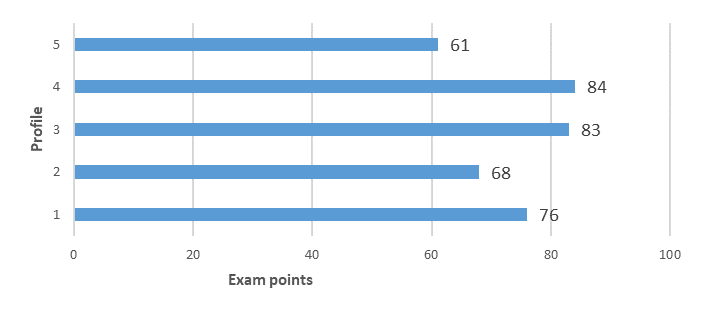
Figure 5. The average exam grade points (n=72 students)
by profile.
Note Students who did not participate in the exam have
been removed.
Note Profiles: 1: “Average” (n=26), 2: “Struggling”
(n=9), 3: “Thriving” (n=21), 4: “Victorious” (n=25), and 5:
“Determined” (n=4).
Table 5
Summary: the distribution of gender, previous attempts, performance, results, and form of implementation
In each weekly survey, students were asked to indicate the reasons for the emotions they experienced “I have a good feeling about the online work of the course” (CVT: achievement emotion), “I cope well with the course's online tasks” (CVT: perceived control), and “I am committed to completing the course” (CVT: perceived value).
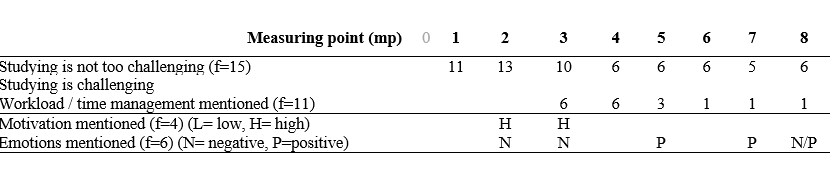
From the qualitative analysis, we identified common themes: perceived feeling of challenge (e.g., with weekly tasks and related materials), workload / time management, motivation , and other emotional experiences. Each student profile is described through these themes and chronologically evolved from the first to the last measurement point (1-8). The initial survey before the start of the course (mp 0) was excluded from open-ended results.
In the first profile, the “Average”, all the values (achievement emotions, perceived control and perceived value) remained at an average level throughout the course and were at their lowest at measuring point five (mp 5) (see Fig. 6).
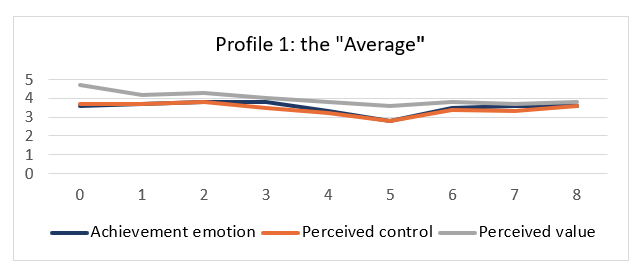
Figure 6. Evolution of students’ experiences (scores 1-5)
in the “Average” profile in different measurement points (mp 0-8).
Commonly, in open-ended responses, students in this profile described their perceived feeling of challenge to be easier at the beginning (mp 1-2) and increasing in challenge in the middle of the course (mp 4-5). Students mentioned challenges concerning time management and weekly tasks. Furthermore, in the profile, low motivation and negative emotions dominated over the high and positive ones in terms of occurrence in the data (see Table 6). Students’ motivation and emotions were mainly related to weekly tasks. Twenty-six students (96%) verbally described their views in open-ended questions at least at one measurement point.
Table 6
Profile the “Average”: identified themes in students’ open-ended descriptions
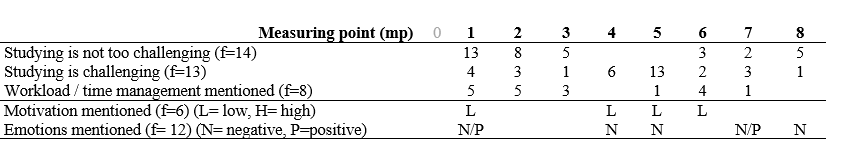
Note. Profile: the “Average” (n=26).
Students described their perceived feeling of challenge e.g., regarding time management and difficulty of weekly task package: ”I haven't spent enough time doing the tasks” (mp 4);“The package was insanely difficult, and the material was not very helpful” (mp 5); “Hopefully things won’t get any harder, otherwise I’ll be lost” (mp 5), and “It’s not very rewarding to do tasks every week on a Sunday night just before the assignments close” (mp 7).
Students reported their perceived level of motivation e.g., regarding weekly task package: "The tasks are going well; the course task system feels motivating rather than punitive. The materials are of high quality" (mp 1); “P4 [weekly task package 4] really hard and lowers motivation” (mp 4);” One weaker week, and motivation declined”;” This week’s tasks were very difficult, and I didn’t understand many things, which reduced my motivation” (mp 5), and “Online assignments were difficult, which reduced my level of motivation” (mp 6).
Students mentioned various emotions e.g., regarding exam and weekly task package: “The exam is coming, and I don’t think I’ve internalized the course matters at any level necessary to succeed in the exam” and “More difficult than the previous packages, begins to distress” and “More difficult than the previous packages, begins to distress” (mp 4) and further at the end of the course: “I invest more in the course, so I don’t stress as much”; ”It feels like everything essential has to be studied online, which is frustrating”; “The assignments made me feel good”; “I am pretty depressed, and I don't get anything done” (mp 7), and “Towards the end, my own enthusiasm may have diminished a little. I'm a little disappointed with that” (mp 8).
In the second profile, the “Struggling”, students’ all values decreased until the fifth measuring point and increased slightly before the end of the course (mp 7–8) (see Fig. 7).
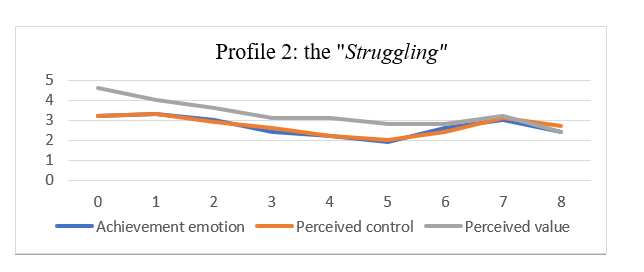
Figure 7. Evolution of students’ experiences (scores
1-5) in the “Struggling” profile in different measuring points (mp
0-8).
Commonly, in open-ended responses students in this profile described perceived time management challenges in relation to the workload. They also mentioned challenges that they had faced but overcome in the weekly assignments. The most challenges were experienced at the fifth measurement point. Furthermore, in this profile, motivation was high, and emotions negative in the beginning, perceived motivation was lower in the middle and began to improve towards the end in terms of occurrence in the data (see Table 7). Students’ motivation and emotions were mainly related to weekly task difficulties and the upcoming exam. Eight students (89%) described their views verbally at least at one measuring point.
Table 7
Profile the “Struggling”: identified themes in students’ open-ended descriptions of their feelings.
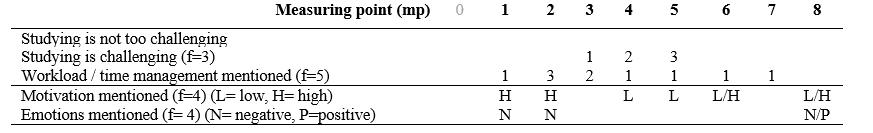
Note. Profile: the “Struggling” (n=9)
Note. The table shows the number of students who have
given an answer under the theme at each measurement point
Note. The frequency (f) indicates how many students have
given any answer related to the theme overall
Students described their perceived feeling of challenge e.g., regarding weekly task package and need of help: “I was successful with the tasks, but the time limits put pressure” (mp 2); “I got most of it done on my own, but I need help“ (mp 5) and “I don't cope very well” (mp 5).
Students reported their perceived level of motivation e.g. regarding weekly task package: "I was quite successful with this week's tasks, and therefore I gained motivation from the package" (mp 1); "If the topics remain equally interesting and not too difficult, I am motivated. However, if the topics become significantly more challenging or less interesting, my motivation can easily decrease”; ”The grade I get from the assignments motivates me to improve my performance or maintain a good average” (mp 2) and further in the middle of the course: “Motivation is still quite poor" (mp4); “Motivation is weak” (mp5); and finally in the end of the course: “Motivation is lost “(mp6); "I gained energy and motivation from the well-executed package”; “Motivation completely lost”, and “I want to study for the exam and get a good one, and I am motivated at the moment” (mp 8). Students felt various emotions e.g., regarding exam, weekly tasks: “Now it feels good to work, but in the back of my head, there is a thought: when you can no longer keep up”; “In the [beginning], I cursed and got frustrated” (mp 1); “The exam is scary” (mp 2); and in the end of the course: "Overall, it has gone quite well on average, and the assignments left a good feeling."; and “Frustrating and tired of the rigidity of the electronic system”, and "the exam is frightening" (mp 8).
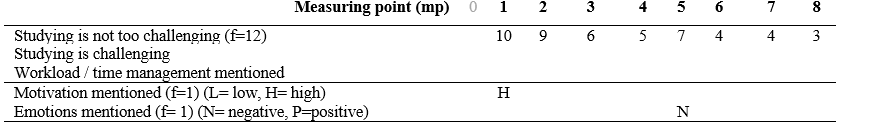
In the third profile, the “Thriving”, students’ all values stayed high during the course (see Fig. 8).
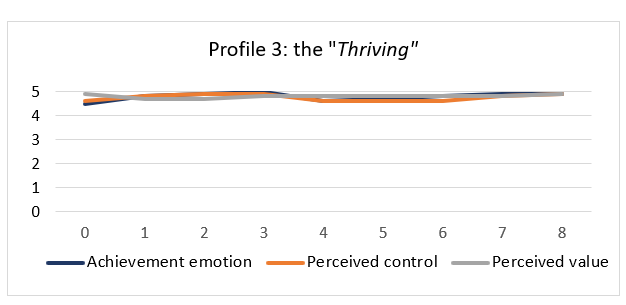
Figure 8. Evolution of students’ experiences (scores 1-5) in the “Thriving” profile in different measuring points (mp 0-8).
Commonly, in open-ended responses students in this profile did not perceive any major inconveniences; they experienced the course as interesting, meaningful, or useful, and they had good experiences studying online: “The things in the course are interesting and online work is right for me” (mp 1); “Important things for working life” (mp 1), and “the tasks are convenient to answer online, and the materials are good” (mp 2). Students did not raise issues related to motivation or emotions much during the course (see Table 8). Fourteen students (67%) described their views verbally at least at one measuring point.
Table 8
Profile the “Thriving”: identified themes in students’ open-ended descriptions to their feelings
Note. Profiles: the “Thriving” (n=21).
Note. The table shows the number of students who have
given an answer under the theme at each measurement point.
Note. The frequency (f) indicates how many students have
given any answer related to the theme overall.
In the fourth profile, the “Victorious”, students’ perceived value stayed high, and both achievement emotion and perceived control slightly lower throughout the whole course (see Fig. 9).
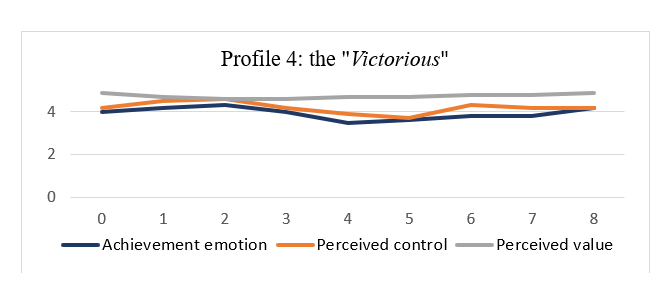
Figure 9. Evolution of students’ experiences (scores 1-5) in the “Victorious” profile in different measuring points (mp 0-8).
Commonly, in open-ended responses, students in this profile, experienced no major challenges during the course except for time management challenges in the middle of the course. For the students, the course was interesting, meaningful, or useful and they had good experiences studying online, just as in the profile “Thriving”. Furthermore, in this profile, some students mentioned high motivation and negative emotions in the beginning and more positive emotions in the end of the course in terms of occurrence in the data (see Table 9). At the beginning, some students were especially upset about the rigorous assessment practices and strict evaluation practices. Nineteen students (76%) described their views verbally at least at one measuring point.
Table 9
Profile the “Victorious”: identified themes in students’ open-ended descriptions to their feelings
Note. Profile: the “Victorious” (n=25).
Note. The table shows the number of students who have
given an answer under the theme at each measurement point.
Note. The frequency (f) indicates how many students have
given any answer related to the theme overall.
Students described their perceived feeling of challenge e.g., regarding to weekly task package, workload / time management and online work: “The time for weekly exercises was short” (mp 2); “Nice to do tasks, but it takes a lot of time”; “Online work is very good for my busy schedule” (mp 3) and “Online work is a good way to learn these things when one has to practice” (mp 3), and “Useful information that I will definitely need in the future” (mp 4).
Students reported their perceived level of motivation e.g., regarding completing the course and time management: “The topics of the course are important, which further motivates you to complete the course well”; “The motivation to complete the course well is high”; "I am ahead of schedule, which increases my motivation and reduces stress about the course" (mp 2), and “The course is a compulsory part of the degree, and I have already spent a considerable amount of my free time on it. I am indeed motivated to complete the course and committed to it” (mp 3).
Students felt various emotions to e.g., regarding the penalty points for the weekly tasks: ”It got a little annoying when careless mistakes were sanctioned so harshly” (mp 2). "It is a bit frustrating how unforgiving the review process is; typos and similar errors are penalized too harshly" (mp 3); “Good feeling when I got through!” (mp 5) and at the end of the course; “Good feelings excluding harsh minus points for task pack delay” (mp 7); “Otherwise, a good feeling, but the past two worst weeks are annoying because they decrease total points” (mp 8).
In the fifth profile, the “Determined”, students’ perceived value was very high throughout the course when the achievement emotion and perceived control stayed on an average level and close to each other. The perceived control decreased more sharply at the beginning (mp 2) and remained near average throughout the rest of the course. The emotions decreased more slowly and increased higher than perceived control towards the end of the course (mp 6) (see Fig. 10).
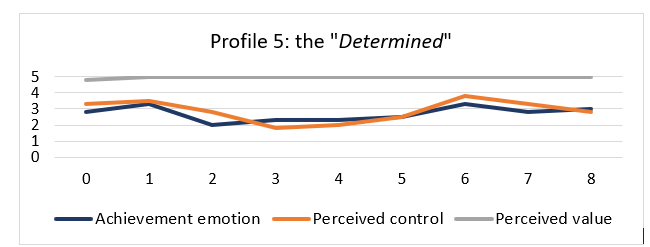
Figure 10. Evolution of students’ experiences (scores 1-5) in the “Determined” profile in different measuring points (mp 0-8).
Commonly, students pushed through even though they had a hard time. Some students reported that one week of good performance influenced their motivation to complete the course. During the course, the students experienced periods in which they had no difficulty and, on the other hand, periods in which they experienced difficulties. Furthermore, in this profile low motivation dominated in the end of the course and negative emotions appeared in measuring points three and six in terms of occurrence in the data (see Table 10). Students’ motivation was related to weekly tasks and emotion to exam and quizzes. Three students (75%) described their views verbally at least at one measuring point.
Table 10
Profile “Determined”: identified themes in students’ open-ended descriptions to their feelings (n=4)
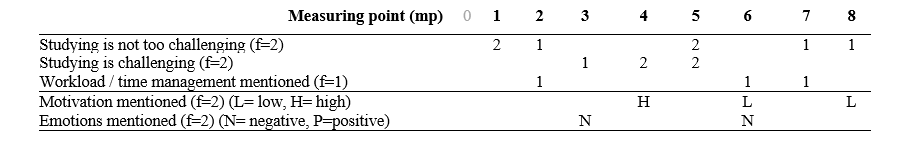
Note. Profile: the “Determined” (n=4)
Note. The table shows the number of students who have
given an answer under the theme at each measurement point.
Note. The frequency (f) indicates how many students have
given any answer related to the theme overall.
Students described their perceived feeling of challenge e.g., regarding difficulties with weekly tasks: “A lot goes wrong” (mp 3); “I haven't been able to do B-tasks properly and it worries me” (mp 4) and “The examples are not given in advance, so everything must be applied on the basis of theory. The points obtained for the tasks have been declining” (mp 5).
Students reported their perceived level of motivation regarding weekly tasks: “This week's tasks went better, which increases motivation” (mp 4); "Completing task sets takes a lot of time at once and concentration wanes. Doing them is very demotivating, so they are not always done as well as they could be” (mp 6), and “Requires far too much independent learning, completing the course is very unmotivating when they don't actually teach how to calculate tasks” (mp 8).
Students felt some emotions e.g., regarding exam and quizzes: “Some of the tasks feel awkward and I don’t know how to cope with the exam” (mp 3); “I would learn things much better through worked-out examples. Quizzes are mostly annoying and even though they prepare for the exam, they don’t seem to help me to internalize things through them” (mp 6).
This study examined university students’ changing emotional states during a virtual foundation course in statistics. We adopted a person-centered approach and used student profiles of perceived control, perceived value, and achievement emotions to identify how these profiles differed in terms of students’ performance, previous attempts, gender, and form of course. This approach aligns with previous research by Orri (2017), which also utilized a person-centered approach to study profiles and emotion regulation.
We identified five distinct profiles of student experiences during the course, namely the “Average”, the “Determined”, the “Struggling”, the “Thriving”, and the “Victorious” profiles. With person-centered profiles we were able to explore the association between the variables of interest at the level of a typical individual in each profile. For example, the “Average” students had motivational and time management challenges and a characteristic of the “Determined” profile was that students pushed through the whole course despite their challenges. Statistically significant differences between profiles were found in the first half of the course with achievement emotions and perceived control. During the latter half of the course, however, profiles had significant differences in their perceived course value (see additional Online Resource Appendix 1, Table 11). Perceived control, and perceived value stayed high throughout the course among students who found the course interesting or useful and who mentioned that they liked virtual learning as a learning method.
With several measurement points we were able to distinguish variation during the course, which would easily go unnoticed unless specifically surveyed. Indeed, most of the challenges were experienced in the middle of the course when the weekly tasks got more challenging, which couldn’t be detected if there were only measurement points at the beginning and the end of the course.
All the students who valued the course had more stability in their emotions and overall, more positive emotions and a better course performance. Students experienced joy and pride when they valued the course outcome and felt in control. They felt enjoyment when they were interested and confident. "Most importantly, when students had problems with a weekly task, changes in their emotional reactions and perceived control sometimes were misaligned. For example, the “Victorious” students reached the lowest point in their emotions at measurement point four, yet their perceived control continued to decline until measurement point five. Moreover, the “Average” students’ perceived control and value showed a declining trend at the third measurement point, while their emotions value showed decline only at the measurement point four. This lack of synchrony in these changes does not align with the assumed model in CVT, where emotion is seen as an outcome of values and control. Further longitudinal studies should examine with more robust measurements whether this observation of non-synchrony can be repeated.
Secondly, we found significant differences according to gender, and differences according to form of course implementation. In the “Average” (62%), the “Determined” (100%), and the “Struggling” (67%) profiles, the females were the majority with lower outcomes (see Table 5). The result corresponds to previous findings indicating that female students have a higher prevalence for emotional distress, which often can have a negative impact on exam performance (Cassady & Johnson, 2002; Hembree, 1988). Females have been shown to exhibit higher levels of test anxiety leading to lower course grades (Chin et al., 2017). At the same time, there were more men in highly successful profiles, namely the “Thriving” (81%) and “Victorious” (72%) profiles. Both of these profiles had more fast-track (totally virtual learning) students. Prior research suggests that students who do not perceive challenges in their learning or performance are more prone to prefer virtual courses than their peers who are struggling with learning and prefer face-to-face courses (McLaren, 2004; Paden 2006; Roach, 2002, Schoenfeld-Tacher et al., 2001).
Thirdly, we were interested in the reasons students gave for the emotions experienced, perceived control, and perceived value in virtual learning. We found that students in the “Average” and “Struggling” profiles lost their sense of a good feeling and had less perceived control and value when they experienced lack of time, and the tasks became more difficult. In the “Average” profile, some students felt anxious or disappointed regarding their success with the weekly tasks or exam and among the “Struggling” profile some students felt tired and frustrated and scared about the exam. Yet, they also had good feelings when successfully completing the tasks. In the “Determined” profile students kept their perceived value throughout the whole course as they pushed through despite difficulties. Similarly, task and time management problems and perceived value (commitment) are known to have an impact on students' emotional experiences in virtual learning (Akojie, 2019; Allan, 2012; Blackmon & Major, 2012; Hilliard et al., 2019; Howland & Moore, 2010; Song et al., 2004). Fear has been related to performance pressure and the desire to complete the task while students also have been proud of themselves and have had a good feeling after handling the task well (Madsgaard et al., 2022).
Students in the “Thriving”, and “Victorious” profiles had high perceived control and values, and good feeling, throughout the course. They enjoyed virtual studying and found the course interesting, meaningful and useful. An interesting difference between these profiles was that although both the “Thriving” and “Victorious” mainly had good feelings and experiences throughout the course, the “Victorious” were at the same time upset about the rigorous or strict practices, harsh minus points, or task delays. Task delays caused time pressure, and similar experiences were found in connection with time management in a previous study in which students felt frustrated because of not being as well prepared as they had hoped (Madsgaard et al., 2022).
Students in the “Thriving”' and the “Victorious” profiles did not experience difficulties studying; they even enjoyed the course, had good motivation, and experienced success. They had high perceived control (e.g., self-efficacy, perceived competence) and high perceived value (e.g., importance of success, intrinsic interest. Students’ difficulties with motivation were related either to performance with weekly tasks (the “Average” and “Determined” profiles) or to course success (the “Struggling”). These findings are in line with CVT (Pekrun, 2006); interested and confident students feel they value the outcome and have perceived control, and anxiety when they feel the outcome is important, but they don’t have enough perceived control to avoid failure. We regard exposing the fluctuation of emotions as a key contribution of this research. This fluctuation gets easily overlooked when emotions are investigated once or twice during a learning process.
The research included only one course, in which case some of the results may be specific to this course. However, such basic courses in statistics are common at many universities. The data came from a small convenience sample with approximately 20% of the students in the course participating in the research. Additionally, 13 students who did not attend the exam were removed from the exam data set. Some of the profiles contained a small number of students, which impeded statistical analyses. The results cannot be generalised. Nevertheless, the results indicate variation among students’ experiences over the duration of a course. Further person-oriented research with bigger samples is needed to identify typical emotional-motivational trajectories and student profiles.
Furthermore, we acknowledge the limitations of using single items for our measurements, which compromises their reliability. However, this shortcoming is counterweighted by using nine measurement points and including qualitative data for more interpretative analysis.
One limitation of this study is the potential inflation of fit indices due to repeated measurements. This phenomenon occurs because each data point is treated as independent, despite being part of repeated measures, which can lead to an overly optimistic assessment of model fit. In the context of latent profile analysis (LPA), this inflation complicates the accurate evaluation of the quality of the identified profiles. The use of multiple variables in profile analysis further complicates the interpretation of fit indices. The small sample size also poses a challenge, as it may not allow for a proper cluster analysis. To mitigate these issues, we have included a detailed explanation of the potential inflation of entropy and its impact on our findings.
We have also provided the analysis code as an appendix (see Appendix 3) to ensure transparency and allow for verification. Furthermore, we have emphasized the qualitative differences that support the selection of the five-profile model over the three-profile model, despite the potential inflation of fit indices.
Our study did not utilize Latent Class Growth Analysis (LCGA), which can provide a more sophisticated approach for analysing growth trajectories over time (Sözer & Kahraman, 2023). Instead, we opted for Latent Profile Analysis (LPA) due to our focus on situational emotions and the combination of quantitative and qualitative data. Furthermore, we were unable to include all fit indices because the statistical package we used, tidyLPA, does not support some specific indices. Consequently, we recommend that future research consider employing LCGA and are willing to provide the data to researchers upon request for further or additional analyses. We have checked the replication of the best log likelihood in our latent profile analysis. Specifically, we tested whether the order of the data affects the results and found that it does not. This indicates that the best fit was established consistently, regardless of the data order. However, we acknowledge that our statistical package, tidyLPA, has limitations in handling multiple sets of random start values. Therefore, we recommend future research to consider using more advanced statistical methods to ensure the robustness of the findings.
This study has highlighted the need to consider a temporal dimension in emotion research. The aim of the study was to provide a better understanding of university students’ dynamically changing academic emotions, perceived control, and perceived value with a person-centered and individual-centered approach. With the help of the profile analysis, we were able to identify different types of students’ experiences in a virtual course. We were able to focus on the fluctuation of students' emotions; something, which alongside a person-centered longitudinal approach has been researched to a lesser extent. Using several frequent measurement points, we were able to identify how changes in emotions in some profiles tended to precede changes in perceived control. Consequently, emotions can be an important indicator of learning, and above all, of a potential trajectory.
Students' challenges during the course may easily stay invisible and the same challenges can be caused by various reasons. The teacher is better able to direct right and timely support to students when they understand how emotions affect learning, and that the role of emotions is different at different points in the course. It is also important to understand students' experiences of virtual learning for the benefit of higher education, because for example, students who have experienced positive experiences and emotions are more likely to re-register for virtual courses (Wang & Newlin, 2000). It can also reveal effective practices, student perceptions, and areas of satisfaction for virtual learning course designers.
Because the study included 85 students and some profiles included a few students, future research would benefit from larger sample sizes to determine how common similar findings are in online courses. Future research may also benefit from comparing emotional fluctuations in virtual/blended and face-to-face learning environments.
Akaike, H. (1987). Factor analysis and AIC. Psychometrika, 52 , 317–332. https://doi.org/10.1007/BF02294359
Akojie, P., Entrekin, F., Bacon, D., & Kanai, T. (2019). Qualitative meta-data analysis: Perceptions and experiences of online doctoral students. American Journal of Qualitative Research, 3(1), 117–135. https://doi.org/10.29333/ajqr/5814
Alghamdi, A., Karpinski, A. C., Lepp, A., & Barkley, J. (2020). Online and face-to-face classroom multitasking and academic performance: Moderated mediation with self-efficacy for self-regulated learning and gender. Computers in Human Behavior , 102, 214–222. https://doi.org/10.1016/j.chb.2019.08.018
Allan, B. (2007). Time to learn? E-learners' experiences of time in virtual learning communities. Management Learning, 38(5), 557–572. https://doi.org/10.1177/1350507607083207
Allen, M. S., Iliescu, D., & Greiff, S. (2022). Single item measures in psychological science: A call to action. European Journal of Psychological Assessment, 38 (1), 1–5. https://doi.org/10.1027/1015-5759/a000699
Ambrose, S. A., Bridges, M. W., DiPietro, M., Lovett, M. C., & Norman, M. K. (2010). How learning works: Seven research-based principles for smart teaching . John Wiley & Sons.
Anwar, A., Rehman, I. U., Nasralla, M. M., Khattak, S. B. A., & Khilji, N. (2023). Emotions matter: A systematic review and meta-analysis of the detection and classification of students’ emotions in stem during online learning. Education Sciences, 13(9), 914. https://doi.org/10.3390/educsci13090914
Arnold, I. (2017). Resitting or compensating a failed examination: does it affect subsequent results? Assessment & Evaluation in Higher Education , 42(7), 1103–1117. https://doi.org/10.1080/02602938.2016.1233520
Ashcraft, M. H. & Krause, J. A. (2007). Working memory, math performance, and math anxiety. Psychonomic Bulletin & Review 14 , 243–248. https://doi.org/10.3758/BF03194059
Bandura, A. (1991). Social cognitive theory of self-regulation. Organizational behavior and human decision processes , 50(2), 248–287. https://doi.org/10.1016/0749-5978(91)90022-L
Bandura A. (1997). Self-Efficacy: The Exercise of Control.Freeman
Baturay, M. H. (2011). Relationships among sense of classroom community, perceived cognitive learning and satisfaction of students at an e-learning course. Interactive Learning Environments, 19(5), 563–575. https://doi.org/10.1080/10494821003644029
Blackmon, S. J., & Major, C. (2012). Student experiences in online courses. A qualitative research synthesis. Quarterly Review of Distance Education , 13(2). https://www.cu.edu/doc/student-experiences-online-classesqual-study.pdf
Cassady, J. C., & Johnson, R. E. (2002). Cognitive test anxiety and academic performance. Contemporary educational psychology, 27 (2), 270–295. https://doi.org/10.1006/ceps.2001.1094
Chaparro-Peláez, J., Iglesias-Pradas, S., Pascual-Miguel, F. J., & Hernández-García, Á. (2013). Factors affecting perceived learning of engineering students in problem based learning supported by business simulation. Interactive Learning Environments, 21(3), 244–262. https://doi.org/10.1080/10494820.2011.554181
Chin, E. C., Williams, M. W., Taylor, J. E., & Harvey, S. T. (2017). The influence of negative affect on test anxiety and academic performance: An examination of the tripartite model of emotions. Learning and Individual Differences , 54, 1–8. https://doi.org/10.1016/j.lindif.2017.01.002
Daniels, L. M., Stupnisky, R. H., Pekrun, R., Haynes, T. L., Perry, R. P., & Newall, N. E. (2009). A longitudinal analysis of achievement goals: From affective antecedents to emotional effects and achievement outcomes. Journal of Educational Psychology, 101(4), 948. https://doi.org/10.1037/a0016096
Diaz-Espinoza, Z. J. (2017). I’m here for a reason: Motivational factors of first-generation Latino males to attend college. University of Tennessee. https://trace.tennessee.edu/cgi/viewcontent.cgi?article=5669&context=utk_graddiss
Den Teuling, N. G. P., Pauws, S. C., & van den Heuvel, E. R. (2021). A comparison of methods for clustering longitudinal data with slowly changing trends. Communications in Statistics - Simulation and Computation, 52(3), 621–648. https://doi.org/10.1080/03610918.2020.1861464
D'Mello, S. (2013). A selective meta-analysis on the relative incidence of discrete affective states during learning with technology. Journal of educational psychology , 105(4), 1082. https://doi.org/10.1037/a0032674
Donaldson, J. A., Ching, J. M. R., & Tan, A. T. M. (2013). Going extreme: Systematically selecting extreme cases for study through qualitative methods. Paper presented at the American Political Science Association Annual Meeting 2013, August 29 - September 1, Chicago . Available at: https://ink.library.smu.edu.sg/soss_research/1509
Eteläpelto, A., Kykyri, V. L., Penttonen, M., Hökkä, P., Paloniemi, S., Vähäsantanen, K., ... & Lappalainen, V. (2018). A multi-componential methodology for exploring emotions in learning: Using self-reports, behaviour registration, and physiological indicators as complementary data. Frontline Learning Research, 6(3). https://doi.org/10.14786/flr.v6i3.379
Forgas, J.P. (2008). Affect and cognition. Perspectives on Psychological Science, 3 (2), 94–101. https://doi.org/10.1111/j.1745-6916.2008.00067.x
Ganotice Jr, F. A., Datu, J. A. D., & King, R. B. (2016). Which emotional profiles exhibit the best learning outcomes? A person-centered analysis of students’ academic emotions. School Psychology International , 37(5), 498–518. https://doi.org/10.1177/0143034316660147
Ge, X. (2021). Emotion matters for academic success: Implications of the article by Jarrell, Harley, Lajoie, and Naismith (2017) for creating nurturing and supportive learning environments to help students manage their emotions. Educational Technology Research and Development, 69(1), 67–70. https://doi.org/10.1007/s11423-020-09925-8
Goetz, T., Zirngibl, A., Pekrun, R., & Hall, N. (2003). Emotions, learning and achievement from an educational-psychological perspective. In P. Mayring & C. von Rhoeneck (Eds.). Learning emotions: The influence of affective factors on classroom learning (pp. 9–28). Peter Lang.
Hailikari, T., Nevgi, A., & Komulainen, E. (2008). Academic self‐beliefs and prior knowledge as predictors of student achievement in mathematics: A structural model. Educational psychology, 28 (1), 59–71. https://doi.org/10.1080/01443410701413753
Hailikari, T., Nevgi, A., & Lindblom-Ylänne, S. (2007). Exploring alternative ways of assessing prior knowledge, its components and their relation to student achievement: A mathematics based case study. Studies in educational evaluation , 33(3-4), 320–337. https://doi.org/10.1016/j.stueduc.2007.07.007
Harley, J. M. (2016). Measuring emotions: A survey of cutting edge methodologies used in computer-based learning environment research. Emotions, technology, design, and learning , 89–114. https://doi.org/10.1016/B978-0-12-801856-9.00005-0
Hembree, R. (1988). Correlates, causes, effects, and treatment of test anxiety. Review of educational research, 58(1), 47–77. https://doi.org/10.3102/00346543058001047
Henritius, E., Löfström, E., & Hannula, M. S. (2019). University students’ emotions in virtual learning: A review of empirical research in the 21st century. British Journal of Educational Technology, 50 (1), 80-100. https://doi.org/10.1111/bjet.12699
Hilliard, J., Kear, K., Donelan, H., & Heaney, C. (2019). Exploring the emotions of distance learning students in an assessed, online, collaborative project. In EDEN Conference Proceedings (No. 1, pp. 260–268). https://www.ceeol.com/search/article-detail?id=846956
Howland, J. L., & Moore, J. L. (2002). Student perceptions as distance learners in Internet-based courses. Distance education, 23 (2), 183–195. https://doi.org/10.1080/0158791022000009196
Human-Vogel, S., & Rabe, P. (2015). Measuring self-differentiation and academic commitment in University students: A case study of education and engineering students. South African Journal of Psychology, 45 (1), 60–70. http://dx.doi.org/10.1177/0081246314548808
Im, Y-W. (2007). A substantial study on the relationship between students' variables and dropout in cyber university. Journal of the Korean Association of Information Education, 11 (2), 205–219. https://koreascience.kr/article/JAKO200732056742348.page
Jarrell, A., Harley, J.M., Lajoie, S., & Naismith, L. (2017). Success, failure and emotions: examining the relationship between performance feedback and emotions in diagnostic reasoning. Education Technology Research and Development, 65, 1263–1284. https://doi.org/10.1007/s11423-017-9521-6
Kim, C., & Hodges, C. B. (2012). Effects of an emotion control treatment on academic emotions, motivation and achievement in an online mathematics course. Instructional Science, 40, 173–192. https://doi.org/10.1007/s11251-011-9165-6
Kim, C., Park, S. W., & Cozart, J. (2014). Affective and motivational factors of learning in online mathematics courses. British Journal of Educational Technology , 45(1), 171–185. https://doi.org/10.1111/j.1467-8535.2012.01382.x
Kurlaender, M., & Howell, J. S. (2012). Academic Preparation for College: Evidence on the Importance of Academic Rigor in High School. Background paper of theCollege Board Advocacy & Policy Center. https://files.eric.ed.gov/fulltext/ED541982.pdf
Lanza, S. T., & Cooper, B. R. (2016). Latent class analysis for developmental research. Child Development Perspectives, 10 (1), 59–64. https://doi.org/10.1111/cdep.12163
Lewis, L. S. (2020). Nursing students who fail and repeat courses: A scoping review. Nurse educator, 45(1), 30–34. https://doi.org/10.1097/NNE.0000000000000667
Li, S., Zheng, J., & Lajoie, S. P. (2021). The Frequency of Emotions and Emotion Variability in Self-Regulated Learning: What Matters to Task Performance? Frontline Learning Research, 9(4), 76–91. https://doi.org/10.14786/flr.v9i4.901
Lin, H. C. K., Chao, C. J., & Huang, T. C. (2015). From a perspective on foreign language learning anxiety to develop an affective tutoring system. Educational Technology Research and Development, 63 , 727–747. https://doi.org/10.1007/s11423-015-9385-6
Lo, Y., Mendell, N. R., & Rubin, D. B. (2001). Testing the number of components in a normal mixture. Biometrika, 88(3), 767–778. https://doi.org/10.1093/biomet/88.3.767
Lu, G., Xie, K., & Liu, Q. (2023). An experience-sampling study of between-and within-individual predictors of emotional engagement in blended learning. Learning and Individual Differences, 107, 102348. https://doi.org/10.1016/j.lindif.2023.102348
Madsgaard, A., Røykenes, K., Smith-Strøm, H., & Kvernenes, M. (2022). The affective component of learning in simulation-based education–facilitators’ strategies to establish psychological safety and accommodate nursing students’ emotions. BMC nursing, 21(1), 91. https://doi.org/10.1186/s12912-022-00869-3
Marsh, H. W., Lüdtke, O., Trautwein, U., & Morin, A. J. (2009). Classical latent profile analysis of academic self-concept dimensions: Synergy of person-and variable-centered approaches to theoretical models of self-concept. Structural Equation Modeling: A Multidisciplinary Journal , 16(2), 191–225. https://doi.org/10.1080/10705510902751010
McLaren, C. H. (2004). A comparison of student persistence and performance in online and classroom business statistics experiences. Decision Sciences Journal of Innovative Education , 2(1), 1–10. https://doi.org/10.1111/j.0011-7315.2004.00015.x
Naghavi, F., Redzuan, M., Asgari, A., & Mirza, M. (2012). Gender differences and construct of the early adolescent’s emotional intelligence. Life Science Journal, 9(2), 124–128. http://www.dx.doi.org/10.7537/marslsj090212.21
Nylund, K. L., Asparouhov, T., & Muthén, B. O. (2007). Deciding on the number of classes in latent class analysis and growth mixture modeling: A Monte Carlo simulation study. Structural equation modeling: A multidisciplinary Journal , 14(4), 535–569. https://doi.org/10.1080/10705510701575396
Orri, M., Pingault, J. B., Rouquette, A., Lalanne, C., Falissard, B., Herba, C., ... & Berthoz, S. (2017). Identifying affective personality profiles: A latent profile analysis of the Affective Neuroscience Personality Scales. Scientific Reports, 7(1), 4548. https://www.nature.com/articles/s41598-017-04738-x
Paden, R. R. (2006). A comparison of student achievement and retention in an introductory math course delivered in online, face-to-face, and blended modalities (Doctoral dissertation, Capella University). https://www.proquest.com/openview/90bd37d4a83aa271ebb557a4df32591a/1?pq-origsite=gscholar&cbl=18750&diss=y
Pekrun, R. (2006). The control-value theory of achievement emotions: Assumptions, corollaries, and implications for educational search and practice. Educational Psychology Review,18(4), 315–341. https://doi.org/10.1007/s10648-006-9029-9
Pekrun, R. (2024). Control-value theory: From achievement emotion to a general theory of human emotions. Educational Psychology Review, 36 , 83. https://doi.org/10.1007/s10648-024-09909-7
Pekrun, R., Goetz, T., Daniels, L. M., Stupnisky, R. H., & Perry, R. P. (2010). Boredom in achievement settings: Exploring control–value antecedents and performance outcomes of a neglected emotion. Journal of educational psychology , 102(3), 531. https://doi.org/10.1037/a0019243
Pekrun, R., Goetz, T., Frenzel, A. C., Barchfeld, P., & Perry, R. P. (2011). Measuring emotions in students’ learning and performance: The Achievement Emotions Questionnaire (AEQ), Contemporary Educational Psychology, 36 (1), 36–48. https://doi.org/10.1016/j.cedpsych.2010.10.002
Pekrun, R., Goetz, T., Titz, W., & Perry, R. P. (2002). Academic emotions in students' self-regulated learning and achievement: A program of qualitative and quantitative research. Educational psychologist, 37(2), 91–105. https://doi.org/10.1207/S15326985EP3702_4
Pekrun, R., & Linnenbrink-Garcia, L. (2012). Academic emotions and student engagement. In A. L. Reschly & S. L. Christenson (Eds.) Handbook of research on student engagement (pp. 259–282). Springer. https://doi.org/10.1007/978-1-4614-2018-7_12
Pekrun, R. & Stephens, E. J. (2010). Achievement emotions: A control value approach. Social and Personality Psychology Compass, 4(4), 238–255. https://doi.org/10.1111/j.1751-9004.2010.00259.x
Pillai, R., & Williams, E. A. (2004). Transformational leadership, self‐efficacy, group cohesiveness, commitment, and performance. Journal of organizational change management , 17(2), 144–159. https://doi.org/10.1108/09534810410530584
Roach, R. (2002). Staying connected. Black Issues in Higher Education, 19 (18), 22–25. https://www.proquest.com/openview/06825bcb3ba5a9c4533ec0d8e32faf2d/1.pdf?pq-origsite=gscholar&cbl=27805
Rosenberg JM, Beymer PN, Anderson DJ, Van Lissa CJ, Schmidt JA (2018). “tidyLPA: An R Package to Easily Carry Out Latent Profile Analysis (LPA) Using Open-Source or Commercial Software.” Journal of Open Source Software , 3(30), 978. doi:10.21105/joss.00978 ,
Rowe, J. (2006). Non-defining leadership. Kybernetes, 35(10), 1528–1537. https://doi.org/10.1108/03684920610688568
Rubinsten, O. & Tannock, R. (2010). Mathematics anxiety in children with developmental dyscalculia. Behavioral and Brain Functions, 6(46). https://doi.org/10.1186/1744-9081-6-46
Schoenfeld-Tacher, R., McConnell, S., & Graham, M. (2001). Do no harm—A comparison of the effects of on-line vs. traditional delivery media on a science course. Journal of Science Education and Technology, 10 , 257–265. https://doi.org/10.1023/A:1016690600795
RStudio Team (2020). RStudio: Integrated Development for R. RStudio, PBC, Boston, MA URL http://www.rstudio.com/ .
Schwarz, G. (1978). Estimating the dimension of a model. The Annals of Statistics, 6(2), 461–464. https://doi.org/10.1214/aos/1176344136
Sclove, S. L. (1987). Application of model-selection criteria to some problems in multivariate analysis. Psychometrika, 52(3), 333–343. https://doi.org/10.1007/BF02294360
Seli, P., Wammes, J. D., Risko, E. F., & Smilek, D. (2016). On the relation between motivation and retention in educational contexts: The role of intentional and unintentional mind wandering. Psychonomic bulletin & review , 23, 1280–1287. https://doi.org/10.3758/s13423-015-0979-0
Snead, S. L., Walker, L., & Loch, B. (2022). Are we failing the repeating students? Characteristics associated with students who repeat first-year university mathematics. International Journal of Mathematical Education in Science and Technology , 53(1), 227–239. https://doi.org/10.1080/0020739X.2021.1961899
Song, L., Singleton, E. S., Hill, J. R., & Koh, M. H. (2004). Improving online learning: Student perceptions of useful and challenging characteristics. The internet and higher education, 7(1), 59–70. https://doi.org/10.1016/j.iheduc.2003.11.003
Spurk, D., Hirschi, A., Wang, M., Valero, D. & Kauffeld, S. (2020). Latent profile analysis: A review and “how to” guide of its application within vocational behavior research. Journal of vocational behavior, 120, p. 103445. https://doi.org/10.1016/j.jvb.2020.103445
Strain, A. C., & D ‘Mello, S. K. (2011). Emotion regulation during learning. In Artificial Intelligence in Education: 15th International Conference, AIED 2011, Auckland, New Zealand, June 28–July 2011 15 (pp. 566-568). Springer Berlin Heidelberg. http://dx.doi.org/10.1007/978-3-642-21869-9_103
Sözer Boz, E., & Kahraman, N. (2023). Latent Trajectories of Subjective Well-Being: An Application of Latent Growth Curve and Latent Class Growth Modeling. International Journal of Contemporary Educational Research , 10(2), 411–423. https://doi.org/10.52380/ijcer.2023.10.2.308
Tamin, R. Z., Tamin, A. Z., & Marzuki, P. F. (2011). Performance based contract application opportunity and challenges in Indonesian national roads management. Procedia engineering, 14, 851-858. https://doi.org/10.1016/j.proeng.2011.07.108
Tan, J., Mao, J., Jiang, Y., & Gao, M. (2021). The influence of academic emotions on learning effects: A systematic review. International journal of environmental research and public health , 18(18), 9678. https://doi.org/10.3390/ijerph18189678
TENK, (2019). National Advisory Board on Research Ethics (2019). Ethical principles of research in the humanities and social and behavioural sciences and proposals for ethical review. Available online at: http://www.tenk.fi/sites/tenk.fi/files/ethicalprinciples.pdf
Tyng, C. M., Amin, H. U., Saad, M. N., & Malik, A. S. (2017). The influences of emotion on learning and memory. Frontiers in psychology , 1454. https://doi.org/10.3389/fpsyg.2017.01454
Um, E., Plass, J. L., Hayward, E. O., & Homer, B. D. (2012). Emotional design in multimedia learning. Journal of educational psychology, 104(2), 485. https://doi.org/10.1037/a0026609
Wang, A. Y., & Newlin, M. H. (2000). Characteristics of students who enroll and succeed in psychology web-based classes. Journal of educational psychology , 92(1), 137. https://doi.org/10.1037/0022-0663.92.1.137
Wang, C., Teng, M. F., & Liu, S. (2023). Psychosocial profiles of university students’ emotional adjustment, perceived social support, self-efficacy belief, and foreign language anxiety during COVID-19. Educational and Developmental Psychologist , 40(1), 51–62. https://doi.org/10.1080/20590776.2021.2012085
Wang, Y., Shen, B., & Yu, X. (2021). A latent profile analysis of EFL learners’ self-efficacy: Associations with academic emotions and language proficiency. System, 103, 102633. https://doi.org/10.1016/j.system.2021.102633
Wytykowska, A., Fajkowska, M., & Skimina, E. (2022). Taking a person-centered approach to cognitive emotion regulation: A latent-profile analysis of temperament and anxiety, and depression types. Personality and Individual Differences , 189, 111489. https://doi.org/10.1016/j.paid.2021.111489
Zajacova, A., Lynch, S. M., & Espenshade, T. J. (2005). Self-efficacy, stress, and academic success in college. Research in higher education , 46, 677–706. https://doi.org/10.1007/s11162-004-4139-z