![]()
Frontline Learning Research Vol.13 No. 3 (2025)
29 - 52
ISSN 2295-3159
1 University of Lima, Peru
2 National Autonomous University of Mexico
FES-Zaragoza, Mexico
Article received 12 August 2024 / Article revised 17 February 2025 / Accepted 15 May 2025/ Available online 27 May 2025
The concept of number emerges from the interaction of psychological, behavioral, and material elements of numerical cognition, collapsing the distinction between "abstract" and "concrete." This dual nature is evident in the Inca numerical system, where tools like the yupana integrate abstract numerical concepts with concrete materials. The Yupana Inka Tawa Pukllay (YITP), a Peruvian arithmetic method, enhances mathematical and visual-spatial skills through tile-based board games. While effective with children, its impact on university students is unexplored. This research used eye tracking to study gaze and attention during YITP operations, comparing novices and experts. Eight university students and two experts participated, with eye-tracking data and scatter plot (dispersion plot) analyses collected using Tobii Pro Glasses. The study introduced the Variation Ratio Tokens (VRT) metric to assess visual attention efficiency, showing significant improvements in VRT dispersion and attention during the arithmetic learning process. These findings suggest YITP's potential in higher education for improving cognitive processes and arithmetic performance, laying a foundation for future research and innovative educational practices. This work establishes a foundation for cross-cultural cognitive studies and innovative STEM education approaches leveraging ancestral knowledge systems.
Keywords: inca number system, inca abacus, arithmetic, pattern recognition, eye tracking
Spatial thinking can be defined as a set of cognitive skills that enable us to organise, reason and mentally manipulate both real and imagined spaces. These skills encompass the capacity to reason about shape, size, orientation, direction, and trajectory of objects, the relationships among them, the mental visualisation of objects and their relationships, and reasoning about the spatial and temporal relationships of objects (Gagnier et al., 2022; Thayaseelan et al., 2024).
The meta-analysis conducted by Uttal et al. (2013) draws the conclusion that spatial skills are highly malleable, that spatial training is durable and transferable, and that it confers benefits to young children. The yupana represents a valuable educational resource, facilitating the integration of spatial reasoning with mathematical learning. Its ability to facilitate the manipulation of abstract concepts through concrete materials renders it an efficacious instrument in the field of mathematics education, promoting a more interactive and visual approach to learning. The link between spatial thinking and mathematical learning can be more firmly established by drawing on the findings of cognitive psychology (Mix & Cheng, 2012). Spatial reasoning can be defined as a way of action within the spatial world, encompassing the localization of objects, the relationships between them, and the perspective of their position from different viewpoints (Uttal et al., 2013).
The Inca abacus, also known as the yupana, is a traditional device that facilitates arithmetic operations through a visual and spatial format. The ability for subitization and spatial thinking appear to be essential cognitive abilities for the effective utilisation of the abacus (Cui et al., 2024; Wang, 2020), such as the yupana (Guzman-Jimenez et al., 2023). These abilities, in conjunction with a profound comprehension of the decimal numerical system, enabled the Incas to undertake intricate calculations with a seemingly straightforward instrument. It is erroneous to assume that numbers are purely mental constructs; they are inextricably linked to material and cultural factors. It is imperative to study these aspects to gain a comprehensive understanding of the nature and evolution of numerical concepts. Subitization constitutes the foundation for the development of numerical sense, while the abacus serves as a visual tool that facilitates comprehension of mathematical concepts. Mental calculation represents the practical application of memory, subitization and spatial visualization skills.
The Yupana Inka Tawa Pukllay (YITP) method developed by author Dhavit Prem and Yupanki Association (Prem D., 2016) is an innovative didactic arithmetic resource based on semiotic alternation (the use of alternative signs to communicate the same concept) that proposes the resolution of arithmetic operations through the recognition of visopraxic patterns (Escotto-Cordova & Sanchez Ruiz, 2018). In its serious game version, the YITP method was incorporated into a tablet and delivered to twelve bilingual primary school children (Spanish-Quechua) in a rural Peruvian community. The children learned autonomously, without teachers, during the period of the global pandemic caused by the SARS-CoV-2 virus (Guzman-Jimenez et al., 2023). These findings indicate the potential of the YITP method as an educational instrument in the teaching and learning of arithmetic in a context of pandemic-related restrictions. Given its visopraxic nature, the objective is to investigate the teaching-learning process of this method, utilising more precise visual process measurement tools, such as eye tracking, within a university learning context.
The term 'visual attention' is used to describe the capacity of the human visual system to selectively process only those areas of visual scenes that are deemed relevant (Borji et al., 2019). The capture of visual attention data is presented in the form of a heatmap, also referred to as an attention map. This represents an aggregation of gaze data over time, typically comprising the number of fixations or the duration of fixations made by a user. The resulting map is usually colour-coded, with green indicating areas of least interest and red indicating areas of greatest interest or hotspots. The colour-coded information is then superimposed on the original stimulus, and the data can be accumulated from all participants. To prevent the display from appearing sparse and to ensure a smooth map, a Gaussian filter is applied to the fixation areas (Duchowski et al., 2002).
The conventional YITP methodology was primarily concerned with attaining assessment outcomes, thereby neglecting to incorporate insights into the cognitive processes underlying student solution-building. Eye tracking enables the capture of this dynamic process in real time, as well as the observation of non-visible aspects such as approaches and strategies, which may not be reflected in the final response (van der Weijden et al., 2018). Furthermore, it provides insights into the internal processes occurring during the cognitive process, such as the reliance on visualisation and mental representations in mathematical abstract concepts. (Hartmann et al., 2016). Given that not all cognitive processes are objectively accessible, eye movements offer insights into cognitive activities that may be challenging or impossible to directly observe and communicate. (Ott et al., 2018).
This research aims to provide information on the gaze dispersion and attention zones involved in solving arithmetic operations obtained with eye tracking technology, with a view to gaining a deeper understanding of the learning and problem-solving processes employed by students (novices) in comparison to experts (authors of the YITP method). Understanding the dynamics of YITP provides educators with a novel pedagogical instrument that facilitates students' problem-solving abilities by encouraging the development of their own strategies and algorithms. Furthermore, the method enables educators to identify the difficulties students encounter when attempting to solve mathematical problems, thereby facilitating the development of targeted interventions designed to enhance their mathematical abilities. The present research has the potential to make a significant contribution to the field of mathematics education by investigating the cognitive processes involved in solving mathematical problems using the YITP method. The findings of this study may provide insight into these processes, thereby facilitating the development of novel pedagogical approaches that can empower students to excel in mathematics. The present study investigates the utilisation of the YITP method in arithmetic operations, employing the analysis of eye movement patterns through heat maps.
The research question was as follows: Does the application of the YITP method result in statistically significant differences in individual heatmaps when comparing the initial and final evaluations of the novice group? This question seeks to identify alterations in visual attention patterns resulting from the acquisition of the YITP method.
It is of great importance to gain insight into the way undergraduate students learn to solve problems with the YITP method, particularly considering the prevailing educational context. To address this need, it is essential to explore innovative research methods, such as eye tracking through heat maps. The maps provide a comprehensive representation of the locations and modes of attention employed by students during the learning process, offering insights into their cognitive strategies and areas of difficulty. By employing this technology in the investigation of the Inca abacus, patterns of attention can be identified and a deeper understanding of student interactions with this traditional mathematical instrument can be attained. The integration of eye tracking analysis with the study of the YITP method has the potential to enhance teaching effectiveness and optimise learning outcomes in university environments.
The sequence of dots on the first row at the base of the Yupana board represents units, while the immediate superior row represents tens, then hundreds, thousands, and finally ten thousand (figure 2a). A token positioned on any given square will assume the value of the point(s) indicated on that square. On each row, the representation of the digit from 0 to 9 is achieved by placing the minimum quantity of tokens needed for that row. In case of digit 0, a row without tokens is used. The numerical values are inscribed from top to bottom, representing all digits in a continuous sequence (figure 2b). It should be noted that additional rows can be included on the top of a yupana according to the requirements of the quantity of digits, but for the purposes of this experimentation, the five-row yupana has been employed.
The columns are represented by the set C = {5, 3, 2, 1}, as
indicated by the numbers at the bottom of the board. Similarly,
the rows are represented by the set R = {1, 2, 3, 4, 5}, while the
tokens are represented by the set T[r,c] = {0, 1}. Each of the
squares [r,c] are assigned one or no token, according to the
aforementioned sets, where 1 represents one token and 0 represents
no token. The representation of a number is in accordance with the
formula (1). 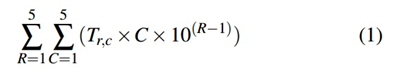
When the addends are placed on the yupana for an arithmetic addition (figure 2c), the value of all tokens represents the final numerical value. However, the resulting value cannot be read directly from the tokens on the board until YITP simplifications have been performed. It is therefore essential to identify the patterns and execute the predefined moves, which do not alter the initial value represented but rather simplify it, taking it to its most readable and optimal representation (appendix 1).
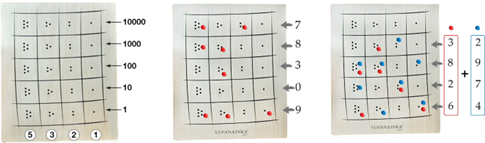
a) Columns & rows values b) Representation of number 78309 c)
Setup of sum 3826 + 2974
Figure 2: YITP numerical values representations
The concept of an algorithm may be defined as a finite sequence of well-defined instructions that, when followed, produce a defined outcome (Kowalski, 1979). Consequently, each strategy developed by each participant may be seen as a set of well-defined instructions that they must follow to finally read the defined outcome (appendix 1).
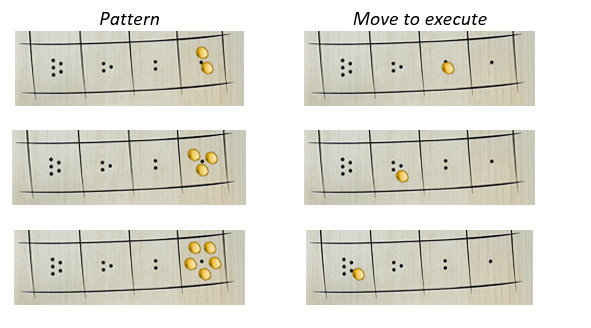
As demonstrated by Dhavit Prem et al., (2022), YITP enables the performance of arithmetic operations through the recognition of patterns formed by tokens on squares and their predefined moves. YITP comprises three types of moves: a) basic moves, which reduce the number of pieces on a square (see Appendix 1), b) expansion moves, which enlarge the pieces on the board when necessary, and c) advanced or compound moves, which are the simplification of two or more basic or expansion moves into a single move. This method eliminates the need for conventional mental arithmetic, while encouraging the development of different strategies comparable to those used in chess (Prem., 2016). This approach diverges from traditional Indo-Arabic mathematics, which was developed by Brahmagupta (590 AD) (Bhattacharyya, 2011; Ram & Ramakalyani, 2022). The execution of YITP arithmetic operations is not constrained by a fixed sequence. The method allows for the implementation of multiple strategies of simplifying operations, either sequentially or in parallel, making it a parallel computational method. To illustrate, in the case of yupana, the sum of numbers must first be represented on the abacus (figure 2c), and then the operations (movements) proposed by the method can be performed as shown in appendix 1.
The Kamachiq challenge, which comprises several tokens distributed randomly on the Yupana board, is often beneficial for novice players. This is because it provides them with a greater opportunity to identify a greater number of YITP patterns and perform compound plays, while simultaneously enhancing their own solution strategies until an optimal representation of a number is achieved (solution) (Prem, 2018). In the case of an arithmetic sum (see figure 2), the total value of all the tokens represents the final numerical value (figure 2c). Nevertheless, the value in question cannot be read directly from the tokens on the board until the requisite YITP simplifications have been performed. It is therefore crucial to identify the patterns and execute the predefined moves, which do not alter the initial value represented but simplify it, thereby bringing it to its readable and optimal representation.
The academic interest in eye tracking technology in higher education lies in its ability to analyze students' visual and cognitive behavior, providing valuable data to improve teaching and learning. This tool allows for the optimization of educational material design by identifying areas of confusion or disinterest, and assessing skills such as Critical Online Reasoning, differentiating between systematic and heuristic approaches (Kunz et al., 2024). Additionally, it monitors cognitive load in real time, helping to adapt teaching strategies to improve retention (Šola et al., 2024). In environments such as Project-Based Learning (PJBL), it reveals how students focus on critical areas, guiding the development of more effective resources (Marlina & Yunas, 2024). It also enhances the usability of educational platforms, such as Learning Management Systems, by creating more intuitive interfaces (Gu & Paracha, 2023). Together, eye tracking transforms education by offering data-driven insights to personalize and improve the learning experience.
The yupana, used by the Incas for arithmetic calculations, is a visual and material semiotic system where pieces on a board represent numerical values. Their arrangement is linked to arithmetic operations, allowing for numerical transformations through spatial relationships. Unlike abstract notation systems, the yupana externalizes cognitive processes, facilitating calculation in a concrete and manipulative way. Additionally, it enables the visualization of multiple solutions, and individuals can create their own solution sequences based on established movement patterns. Furthermore, the integrative approach of YITP incorporates historical, cultural, and linguistic aspects of Quechua, fostering interdisciplinary studies and promoting innovative solutions in more advanced educational contexts. The properties of YITP were validated through a study conducted with rural children during the COVID-19 pandemic, who learned the method through self-directed learning. The results revealed that (a) the children learned in a very short time, (b) they improved digit reading accuracy on the first attempt, (c) they increased their digit reading speed, and (d) they achieved a high percentage of correct readings of numbers containing at least one zero. These improvements in arithmetic accuracy, speed, and autonomy were facilitated by pattern recognition and a playful approach (Guzman-Jimenez et al., 2023). Additionally, follow-up qualitative assessments, based on participant surveys, showed a significant improvement in their perception of mathematics after learning and applying the YITP method. Importantly, eye-tracking provided insights into the cognitive processing involved. This study opens a new line of exploratory research on the YITP method in higher education.
This study employs a mixed-methods approach (Hayes, 1978; Cooper, 1993; Arsalidou & Pascual-Leone, 2016) to investigate visual and cognitive processes during learning with the YITP method within an educational program. This methodology enables a comprehensive analysis of how participants and experts process visual information and actively construct knowledge using the YITP method, facilitating an integrated understanding of learning dynamics.
Eye-tracking is the primary quantitative tool employed in this study, with metrics such as fixation duration, saccade frequency, and gaze patterns being captured before and after YITP implementation. These data facilitate the evaluation of changes in visual attention and processing efficiency, thereby offering insights into learning outcomes and the development of expertise. Qualitative methods—namely, participant observations and semi-structured interviews—are employed to delve deeper into the knowledge construction process and the contextual factors influencing visual behavior.
The present study addresses four key research gaps identified in prior literature (Gegenfurtner, 2011; Dogusoy-Taylan & Cagiltay, 2014; Ooms, 2014): 1) the application of visual expertise findings to educational settings, 2) the examination of contextual moderators of visual behavior, 3) the optimization of visual tool design for varying expertise levels, and 4) the exploration of individual and cultural influences on the development of visual expertise.
Integrating eye-tracking data with qualitative insights allows for a robust evaluation of the YITP method's effectiveness in fostering visual and cognitive proficiency. This approach establishes a comprehensive foundation for analyzing expertise development across diverse learning environments, representing a significant contribution to the field.
The study included eight university students (four male and four female, aged 18–19) in their first semester at a private university, enrolled in humanities programs (Table 1). All were taking an introductory research course, which motivated their voluntary participation. The participants met the following criteria: 1) Normal or corrected-to-normal vision (including color perception). 2) No prior experience with the Inca Yupana or eye-tracking technologies. 3) No significant visual impairments or neurological conditions.
The participants, predominantly from middle-class backgrounds, received no monetary compensation but gained academic benefits by contributing to the research. Although their knowledge of the yupana’s potential benefits was limited, their curiosity about this cultural artifact led them to participate, seeking to enhance their self-efficacy in mathematics
Table 1
Subjects distribution by sex and major
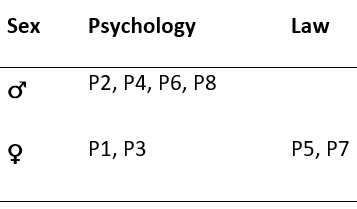
Note: All participants were 18 years old except P7, who
was 19. P → Study subject.
All students attended an introductory session in the neuroscience laboratory, where they provided informed consent. The program consisted of three phases: Week 1: An expert delivered a lesson on the YITP, covering number representation, basic movements, addition, and an introduction to subtraction. A second expert provided individualized reinforcement. Each participant solved a four-digit addition problem, which was video-recorded. Notably, numerical representation in the Indo-Arabic system on the yupana board required the use of 27 tokens distributed across the board (in both Test 1 and Test 2). Week 2: Reinforcement of previous content and introduction to subtraction. A WhatsApp group was created to facilitate learning between sessions. Week 3: Participants performed arithmetic addition operations and the "Kamachiq Challenge," which involved randomly generating an operation with 50 tokens on the Inca Yupana board. For this study, only addition operations were considered.
During the experiment, the following software and tools were used: Tobii Pro 3 eye-tracking glasses and Tobii Pro Lab software. The eye-tracking glasses were calibrated and connected via Wi-Fi to the laptop, enabling the collection of a substantial amount of raw data on high-frequency eye movements (Sundstedt & Garro, 2022). Tobii Pro Lab facilitated the generation of heatmaps in jpeg formats, suitable for presentations or publications. These heatmaps were later processed using Fiji software, which is based on the Java ImageJ extension for digital image processing. Additionally, the csv files generated by the Tobii Pro Glasses 3 provided a comprehensive dataset, including gaze positions, pupil measurements, and event markers, which were crucial for analyzing eye-tracking data. This structured format allowed for further analysis and visualization of user behavior and interactions with the YITP board stimuli using statistical software.
To conduct the experiment, video cameras were positioned in the four corners of the neuroscience laboratory (NeuroLab), alongside a video conferencing camera and a laptop. This configuration enabled the neuroscientist to monitor the experiments in real-time and record semi-structured interviews for later review by neuroscience experts. The sessions utilized a Yupana board with magnetic tokens, as well as cardboard Yupanas and corn seeds (used as tokens), as illustrated in Figure 1. The Yupana magnetic board was placed on an adjustable podium with a table stand to ease the arrangement of the magnetic tokens. The height of the podium was modified to ensure a perpendicular view, minimizing muscle strain for the student solving exercises in front of the board. In addition, a whiteboard was positioned nearby to facilitate the verification of arithmetic operations.

Figure 1: Neuro Lab: a) Workshop,b) Tobii glasses and c)
Tobii Pro Lab software.
Eye-tracking data often do not meet the assumptions of normality, particularly in small samples, with fixation metrics commonly exhibiting skewed distributions or outliers. The study, conducted with a small sample size of 10 participants, uses the Wilcoxon test (allows for the comparison of two related samples when the data do not follow a normal distribution) to compare tests 1 and 2, and the Friedman test (provides a nonparametric alternative to repeated measures ANOVA, offering robustness to non-normality and making it well-suited for this type of data (Conover, 1999; Duchowski, 2002) to compare tests 1, 2, and 3. These non-parametric tests were integrated as complementary analyses, allowing for a deeper understanding of the data and helping to mitigate the limitations associated with the small sample size. Although the results are preliminary due to the sample size, this multi-method approach provides a solid foundation for future research with larger samples.
Furthermore, specific metrics were included, such as Seconds per move (s/move), which measures the relationship between the time spent and the number of token moves when solving the proposed exercises, and the Token Variation Ratio (VRT), calculated by dividing the standard deviation (sd) of heatmap areas by the time in seconds (s) and multiplying by the number of tokens (T) at the start (VRT = T x sd/s). The VRT was obtained through heatmap processing and the FIJI software (Kerkhoff et al., 2022), and is divided into two types: VRT Dispersion (green areas, reflecting dispersion efficiency) and VRT Attention (red areas, reflecting attention efficiency). For the analysis, the Wilcoxon test was used for tests 1 and 2, and the Friedman test for test 3. The robustness of the Friedman test to non-normality makes it suitable for this data, while the additional analyses provide a deeper understanding and mitigate the limitations associated with the small sample size. Although the findings are interpreted with caution, this multi-method approach strengthens the validity of the results, laying the groundwork for future research with larger samples.
To assess the impact of learning the YP arithmetic operations on visual attention, it is important to examine how novices' eye-tracking patterns might change before and after the learning process. Eye-tracking data, particularly regarding dispersion and attention, can provide valuable insights into cognitive and perceptual shifts during the learning experience. Based on this, the following hypothesis is proposed:
- H0: There are no significant differences in eye-tracking patterns (dispersion and attention) in novices before and after learning the YITP arithmetic operations.
- H1: There are significant differences in eye-tracking patterns (dispersion and attention) in novices before and after learning the YITP arithmetic operations
An important aspect of learning is how novices' cognitive processes evolve as they gain experience. In the context of eye-tracking patterns, it is valuable to explore whether the visual attention and gaze dispersion of novices move closer to those observed in experts as they progress. This leads to the following hypothesis:
- H0: The ratios of eye-tracking patterns (attention and dispersion) in novices do not tend to converge towards those of experts.
- H1: The ratios of eye-tracking patterns (attention and dispersion) in novices tend to converge towards those of experts.
A quantitative comparison, based on the visual analysis of the heat maps, between novices and experts, and a before and after for each novice, reveals a pattern whereby the extent of the continuously coloured area in the heat maps is reduced and becomes more localized in specific isolated points, similar to small "islands" (see Figure 3). In the case of the experts, the localizable points, or "islands of attention," are the dominant feature of the pattern, although there are points on the board where it extends and connects, forming "connected beach paths" (see Appendix 2 for each participant). For clarity in the figures, green represents dispersion, red represents focused attention, and yellow represents borderline areas. This color coding helps distinguish between regions of broad visual exploration, focused attention, and transitional zones, respectively.
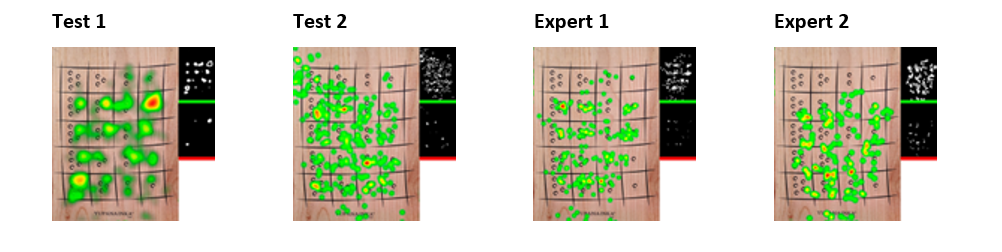
Figure 3: Participant P2’s Tests 1 & 2 and experts (27 tokens) solving addition: 5988 + 6417 + 4332 + 8675
To comprehensively evaluate the participants' knowledge gained during the experiment, another operation, known as "Kamachiq challenge" (see figure 4), was tested. As detailed in the figure 5, this operation employed 50 tokens, in contrast to the 27 tokens used in earlier experiment stages. Operation Kamachiq requires the proficient application of learned moves for a comprehensive evaluation of mastery of the YITP method. The implementation of this operation facilitated the acquisition of insights into the way participants transferred their newly acquired skills to a more complex and demanding context. This allowed for a more comprehensive evaluation of their progress and competency in the YITP (see figure 6).
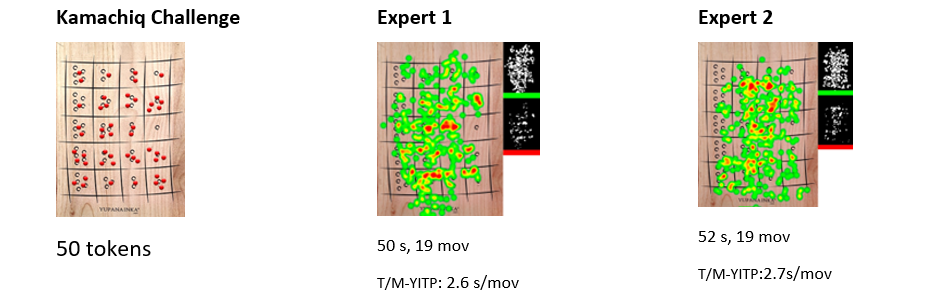
Figure 4: Experts heat maps references (50 tokens)
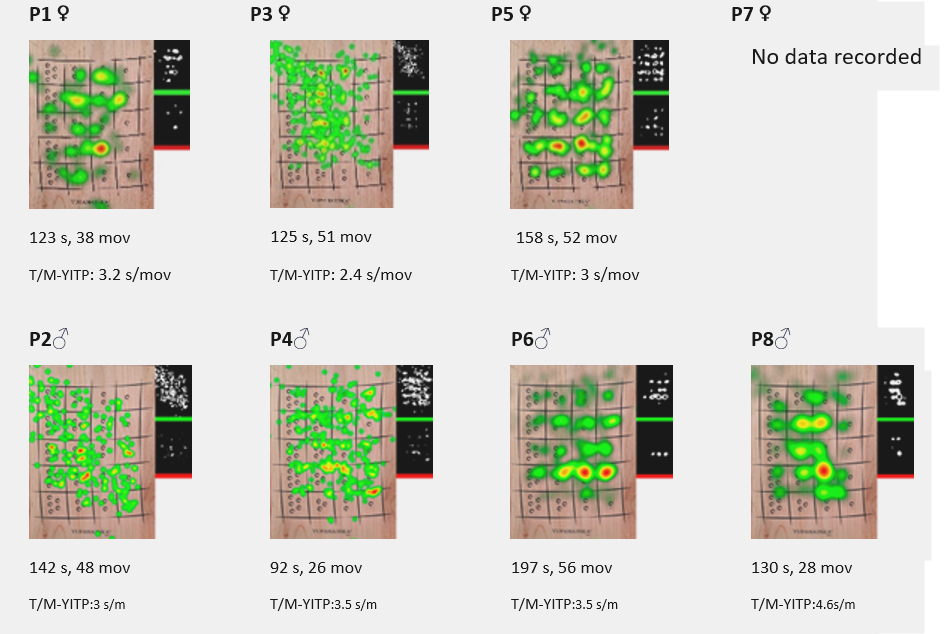
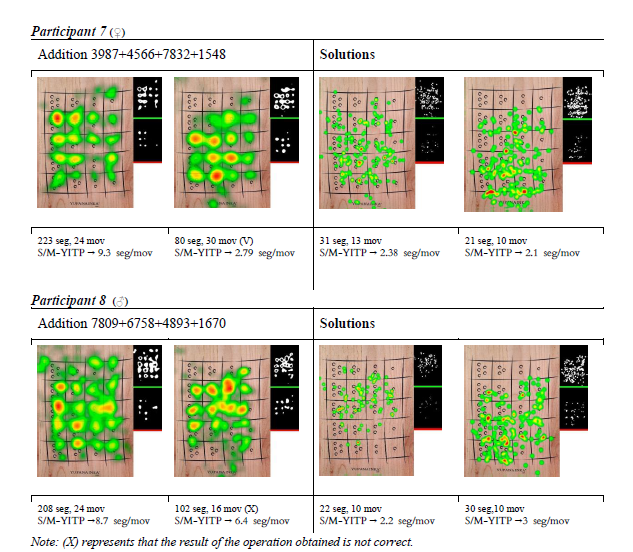
Figure 5: Participants heat maps (50 tokens)
Note: Participant 7’s heatmaps were unavailable due to
an eye-tracking device issue
In Table 2, the dispersion zone (green, p = 0.01) shows a statistically significant relationship, suggesting that participants distribute their gaze across the board, searching for a movement pattern they can perform rather than focusing on a specific area due to the nature of the game. The attention zone (red, p = 0.08), while not statistically significant at the conventional 95% confidence level, is significant at a 90% confidence level. Given the small sample size, this result suggests a potential trend toward statistical significance, indicating that participants may exhibit a high concentration of visual attention in this zone. However, these marginal results should be interpreted with caution and warrant further investigation.
One interpretation is that there is no single solution sequence, with each participant developing their own movement sequence or creating their own moves. This aligns with the authors' description of the YITP method and their empirical observations over 10 years. Additionally, the relationship between the dispersion zone (p = 0.01) and the attention zone (p = 0.08) should be noted, as both reflect complementary aspects of the visual search process on the board. It is recommended to conduct further studies with a larger sample size or apply alternative metrics to explore the attention zone more robustly. Future studies should also consider the visual context of the task (e.g., board design, distractors) to draw stronger conclusions about these patterns of ocular behavior.
To investigate changes in performance across learning stages, a Friedman rank sum test was conducted. The study included three stages: Stage A (Test 1, conducted during the workshop with 27 tokens), Stage B (Test 2, administered two weeks later with 27 tokens), and Stage C (Test 3, conducted in Kamachiq with increased complexity and 50 tokens). The results revealed a statistically significant difference in performance across the three stages (p-value = 0.004) at a significance level of 0.05, with a chi-squared value of 11.143 indicating a moderate to strong effect size. However, the attention VRT analysis showed a p-value of 0.04, which is statistically significant at the 0.05 level but marginal if using a 0.10 threshold. Data from participant P7 were excluded from the analysis due to missing records. The degrees of freedom (df) for the Friedman test were 2, corresponding to the three stages. These findings are summarized in Figure 6.
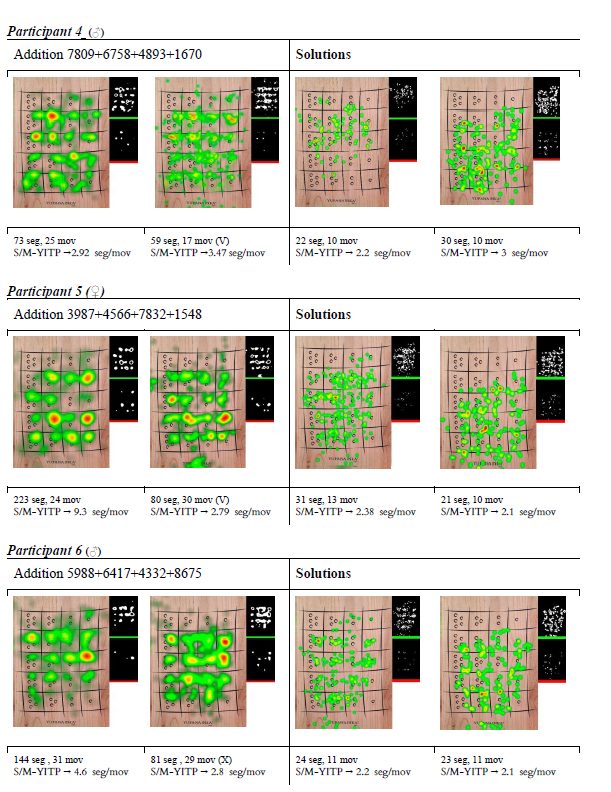
Additionally, participants with the exception of P5 and P6, exhibited an increase in their VRT from Test 1 to Test 2, as well as from Test 2 to Test 3 (when playing the Kamachiq with 50 tokens). This indicates that an augmented number of tokens enhances the probability of identifying patterns that can be simplified through the utilisation of composite moves, thereby facilitating the generation of a greater number of solution strategies. Consequently, there is a greater search for patterns in a dispersed manner (i.e., a greater degree of dispersion) and less time spent on this process. In the case of P5, the VRT remains equal to that of the additional evaluation. In contrast, in the case of P6, the VRT decreases, although it remains higher than the VRT shown during the learning process. The VRT values demonstrate an increase across the tests, indicating a greater variability in attention patterns as the tasks become more complex (basic to advanced) and require a greater number of tokens (27 to 50).
Table 2: Participants (P) VRT Dispersion, VRT Attention for three tests and experts references
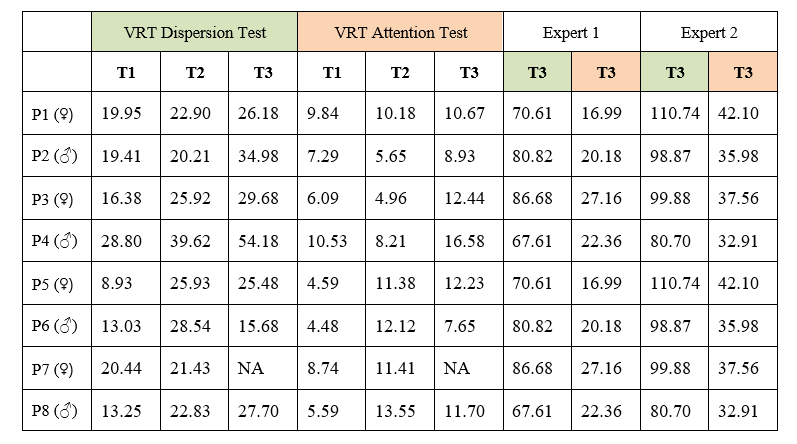
Note: P→ participant. T→ tests
In Table 3 Both women and men showed an increase in VRT for dispersion and attention across all three tests. This suggests that both groups devoted more attention to exploring different areas of the board (dispersion), while maintaining a certain level of concentration on a particular area (attention) as the trials progressed. While both groups showed similar trends, the VRT results suggest that both groups' attention became more dispersed and more focused at the same time as the tests progressed. Although there appears to be a similar pattern, with men scoring slightly higher than women, further analysis is needed to confirm whether there are significant differences between them.
Table 3: Sex Differences in VRT Dispersion and Attention inter-participant across Tests (1, 2 & 3)
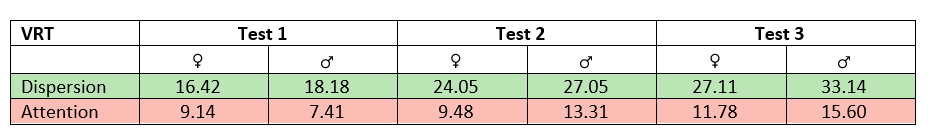
The data for Test 1 to Test 2 and Test 2 to Test 3 were examined separately for female and male participants (see Table 3). In contrast, for male participants, the VRT Dispersion increased by approximately 48.79% from Test 1 to Test 2, and by approximately 22.47% from Test 2 to Test 3. The VRT Attention experienced a significant increase of approximately 79.30% from Test 1 to Test 2. This was followed by a smaller increase of approximately 15.64% from Test 2 to Test 3 (see figure 6).
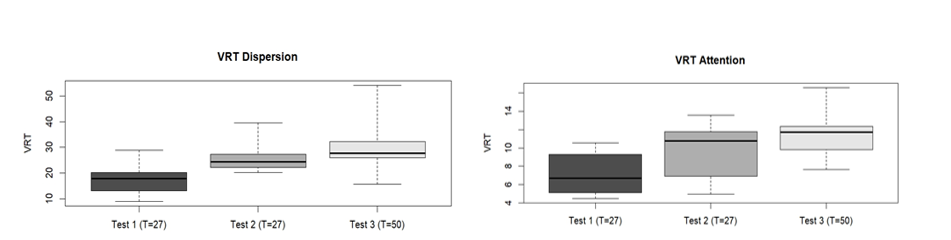
Figure 6: a) VRT Dispersion and b) VRT Attention intra-
participant analysis (Test 1 & Test 2)
The findings of the present study indicate that learning the YITP method results in substantial alterations to both the visual and dispersion patterns of attention observed in the three tests conducted with novice participants. As anticipated based on the heat maps (Blascheck et al., 2017), the proportion or variance ratio of dispersion zones (green zones) demonstrated an increase for all novice participants. Consequently, this suggests a tendency for the dispersion patterns of novices to resemble those of experts over time. This also indicates that novice participants were able to expand the range of search patterns and identify the relevant information in a more efficient manner. The number of fixation zones (red zones) increased for participants 5, 6, 7 and 8, while a decrease was observed for participants 2, 3 and 4. To gain further insight into the cognitive processes and perceptions associated with learning arithmetic with YITP, open-ended interviews were conducted with each participant (see Appendix 3). These findings lend support to the hypothesis that training in the YITP method fosters more focused and efficient attention in tasks pertaining to the operation of addition under the inca numeric system. The results indicate that, following the learning, after Test 1 and Test 2, participants are capable of inhibiting responses to distracting stimuli and directing their attentional resources in a more selective manner towards relevant information. Additionally, the participants demonstrate enhanced visuospatial and subitizing skills, which are essential for the execution of movements on the YITP method. This increase in the VRT dispersion also suggests that novices progressively expand their search zones for new strategies while adopting a more rhizomatic approach (without a predetermined order) rather than adhering to a rigid, linear procedure, as is characteristic of Indo-Arabic mathematics. Furthermore, after Test 3, it is observed that the dispersion zones of novices tend to resemble those of experts, becoming increasingly scattered.
The processing of numerical information is contingent upon visual attention, as evidenced by studies that have compared the performance of abacus experts and non-experts (Lo & Andrews, 2022). Abacus experts employ visuospatial strategies for digit recall and mental calculations, in contrast to the linguistic strategies utilised by non-experts. The results of the research indicate that mental abacus calculation training improves visual image processing skills, which may influence how experts focus their attention on numerical tasks. Furthermore, practice with the abacus results in the automation of the decoding of the information represented on the abacus, thereby making this process more efficient (Srinivasan, 2018). This abacus training may elucidate the mechanisms by which mental abacus users are able to group abacus beads into columns and represent the abacus within the boundaries of visual working memory (Frank & Barner, 2012, cited by Srinivasan, 2018).
Although the abacus and Inca yupana board are not identical, the design of this one makes use of the principles of the former, facilitating the manipulation of tokens and the spatial location and subitization of the ones. Furthermore, it requires memorising predefined patterns of movements in order to apply the most appropriate movements according to the strategy of each participant in search of the answer to the operation posed in the Yupana cardboard. It should be noted, however, that the present study focused on a group of eight novice participants and the YITP method for only addition arithmetic operation.
About significant differences in VRT ratio across tests before and after learning the YITP method in the novice group. Attention analysis revealed a marginally significant difference between VRT values before and after learning (W=15, p=0.08298), suggesting a potential change in measurement location after learning. Furthermore, it was observed that as the VRT value increased, there was a corresponding increase in the dispersion of the subject's attention on the yupana board. The mean VTR dispersion per test was 17.52 (Test 1), 25 (Test 2) and 30.55 (Test 3), indicating a wider exploration of the Yupana board. While the mean VTR attention scores for each test were 7.14 (Test 1), 9.68 (Test 2) and 11.46 (Test 3), respectively, and did not exhibit a concentration on specific areas of the board, an increase in the value was also observed, indicating a tendency for the participants to focus their attention on specific areas of the screen as they progressed. This greater focus, accompanied by an increase in the precision of eye movements, suggests an adaptation and learning process. It is noteworthy that the experts exhibited notably elevated values for both VRT dispersion. The results indicate that they were in exploration mode, actively seeking information on the board. Expert 2 displayed an even more intense exploration mode. Similarly, both exhibited a high degree of concentration in specific areas of the board, indicating an efficient and directed visual strategy.
The number system and mathematical practices of Inca culture, as well as the specific symbolic representations and notations used by them, may have engaged different brain regions or required the recruitment of additional neural resources during mathematical operations compared to modern symbolic systems. This has also been observed in Maya culture, particularly in its number system and mathematical practices, as well as in the specific symbolic representations and notations used by the Maya (Richeson, 1933; Nickerson, 1988)
Subitization of small quantities (1-5 points) on the Yupana board, for example, is likely associated with the Approximate Number System (ANS) (Dehaene, 1997, 2011; Ansari, 2008), which represents an ancient evolutionary system for approximating numerical magnitudes. Heatmaps may indicate brief fixations on clusters of points, reflecting a rapid approximation of quantities by the ANS, likely following the initial subitizing. The representations in question can currently be used as semiotic alternations in the YITP method (Guzmán-Jiménez et al., 2023).
It should be noted that Tests 1 and 2 involved 27 tokens, with the addition arithmetic of four 4-digit numbers, and that this was the same in both tests. Test 3, however, used 50 tokens from the Kamachiq challenge. The results indicate that as novice participants become more familiar with the YITP method, their attention becomes more focused on relevant areas and there is a greater exploration of the entire board in search of potential pattern moves.
Following the culmination of the tests, based on the open-ended interviews, it was evident that participants (p) exhibited the activation of a multitude of cognitive processes throughout their interaction with the YITP. In accordance with the theoretical frameworks put forth by Piaget (1970). Bruner (1974), Ausubel et al., (1978) and Dehaene et al., (2004, 2005), the participants demonstrated a focused attention on the pertinent elements of the board, which underscores the concentration required to effectively manipulate the tokens. The perception of numerical and symbolic information was of great consequence, with the YITP being perceived as a game with unambiguous rules (p5, p6). Memory was identified as a fundamental component in the recall of rules, actions, and mathematical knowledge (p1, p2, p3, p6, p8). Furthermore, the formation of mental models pertaining to mathematical operations was discerned (p6), which is pivotal for comprehension. Problem-solving skills were evidenced by the utilisation of existing knowledge to identify solutions (p8). Furthermore, the participants demonstrated metacognition by reflecting on their learning process, identifying their strengths and weaknesses, and evaluating their personal strategies (p3, p4, p5, p6, p8). This suggests that YITP encourages active learning that engages multiple cognitive processes, from initial perception to metacognitive reflection.
Furthermore, participants reported positive experiences associated with the utilisation of the YITP, including an increase in enjoyment, self-confidence, self-efficacy, and curiosity. A number of participants drew attention to the playful aspect of the YITP, likening it to a game (p1, p3, p4). Furthermore, an enhancement in comfort and the capacity to err without trepidation was observed (p3). Some participants indicated an increase in mathematical self-esteem due to the utilisation of the YITP, comparing it favourably with traditional methodologies (p2). Ultimately, the potential of the YITP to cultivate interest in Incan culture was emphasised (p8).
Participants expressed positive experiences related to the practice of the YITP method, reporting an increase in enjoyment, self-confidence, self-efficacy and curiosity. Several participants highlighted the playful nature of the YITP method, comparing it to a game (p1, p3, p4). In addition, an increase in comfort and the skill to make mistakes without fear was mentioned (p3). Some participants reported an increase in mathematical self-esteem due to the practice of the YITP, comparing it favourably with traditional methods (p2). Finally, the potential of the YITP method to generate interest in Incan culture was highlighted (p8). Chang et al., (2022) highlight the influence of cultural factors on mathematical performance.YITP, by connecting with cultural identity, can increase student motivation and performance.
Moreover, the findings of the present study revealed discrepancies in eye movement patterns between men and women during YITP learning. However, both the dispersion and attention VTR exhibited low values and minimal increases across the three tests. However, previous research (Yuan et al., 2019; Yang et al., 2022) has indicated that there are gender differences in spatial abilities and that women may have superior verbal and information processing skills. In agreement with the findings of Kaczkurkin et al. (2019), we advocate for further investigation into these cognitive discrepancies.
The comparison between the Inca Yupana, chess, and the abacus is particularly insightful, as it highlights shared elements related to spatial representation, as well as visual and motor processing, especially in terms of differences in VTR between experts and novices in YITP. However, a more in-depth analysis is necessary considering previous studies on eye movement patterns and spatial representations. Both chess and the Yupana board utilize a spatial arrangement to represent information. Studies on chess (Sheridan & Reingold, 2014; Ribeiro da Silva Junior et al., 2018) have shown that experts develop highly efficient visual search patterns to identify relevant information. It is likely that prolonged practice with the YITP method also leads to the development of specific visual search patterns, although further research is needed to confirm this. Additionally, subitizing and visual processing play a crucial role in both the abacus and the Inca Yupana board.
However, the Yupana board combines elements of subitising with a more complex spatial structure, similar to chess. This suggests that YITP boards can train both subitising and spatial processing skills. Furthermore, previous studies (Duchowski et al., 2002; Sheridan & Reingold, 2014; Silva et al., 2022) have shown that experts develop more efficient eye patterns than novices. Expert Yupana users also tend to show characteristic eye patterns, such as lower dispersion and longer fixation durations on relevant areas. Experts showed significantly increased values for both VRT dispersions. The results suggest that they were in scanning mode, actively searching for information on the screen. Expert 2 showed an even more intense scanning mode. Both also showed a high degree of concentration on specific areas of the board, indicating an efficient and focused visual strategy.
The aim of the present study was to evaluate the differences in visual attention patterns during the teaching-learning process, measured by eye tracking, between groups of novices and experts in the YITP method as well as the changes in these patterns before and after learning the method.
The results obtained support the hypotheses raised and confirm significant differences in the areas of dispersion and ocular attention between the tests carried out before and after learning YITP Method in the group of novices. These results suggest that learning the YITP method influences the way in which participants direct their visual attention when solving arithmetic problems on the Yupana board. Significant differences were found in the patterns of visual attention between the groups of experts and novices in the YITP method. The experts showed greater efficiency in the use of visual attention, characterised by less dispersion and greater concentration in relevant areas. These results support the idea that experience and mastery of a method influence the cognitive processes underlying problem solving, and it is seen that the strengthening process of attention and the patterns of dispersion are closer to experts.
The results of this study have important implications for an initial exploration of the cognitive processes involved in learning and solving mathematical problems using the YITP method. Identifying differences in the patterns of ocular attention between novices and experts contributes to the development of more effective teaching and training strategies. Similarly, the findings regarding changes in visual attention after learning the YITP method provide valuable information for the design of educational interventions that promote the development of cognitive skills related to problem solving.
This exploratory study provides evidence that the Yupana Inka Tawa Pukllay (YITP) method enhances arithmetic learning in university students by strengthening visuospatial and spatial skills. Eye-tracking data reveal that, after applying the method, novice students exhibit reduced gaze dispersion and improved focus on key patterns, suggesting more efficient processing in basic operations with natural numbers involved in yupana manipulation.
Furthermore, their visual fixation patterns progressively align with those of experts, confirming that YITP facilitates the adoption of new strategies, such as rapid identification of relevant elements and effective use of spatial visualization. However, due to the small sample size, the novelty of the arithmetic system, and the observed results, further research with larger sample sizes is recommended to enable statistical comparisons and generalize findings across all arithmetic operations.
Qualitative findings complement these results, indicating that students gain confidence in handling abstract concepts through the method’s concrete visual aids. They also perceive it as a motivating, game-like tool—factors that facilitate the teaching-learning process (playful motivation factors that encourage learning, particularly in mathematics). This effect is more significant because participants were enrolled in non-mathematical degree programs, suggesting that the method’s playful nature may help reduce student resistance.
Thus, YITP emerges as an innovative pedagogical tool that enables personalized problem-solving approaches and helps educators identify specific student difficulties. This study supports YITP as a valuable resource for modern mathematics education, illustrating how ancestral tools like the yupana can be adapted to contemporary academic contexts. Its visual and interactive approach not only optimizes arithmetic instruction but also fosters more inclusive and effective learning environments. These findings open new avenues for integrating cognitive and cultural techniques in higher education, particularly in fields requiring spatial and logical-mathematical competence.
Additionally, to ensure concurrent validity, it is advisable to use EEG as an objective complementary tool for assessing changes in brain activity dynamics, especially given the limited subject group in this study. The results support the idea that YITP produces numerical outcomes, which aligns with findings from other studies, such as those on semiotic alternation in mathematics.
We would like to express our sincere gratitude to the students of the General Studies program at the University of Lima, who participated in this study in a voluntary and invaluable capacity. This research project received institutional support from the Directorate of General Studies and the Neuroscience Laboratory, under the direction of the Dean and her staff. The Research Institute of the University of Lima must be acknowledged for its pivotal role in facilitating the research that recovers ancestral knowledge and the use of emerging technology. The Yupanki Association also warrants recognition for its invaluable academic collaboration that has been instrumental in propelling this line of research forward.
Ansari, D. (2008). Effects of development and enculturation on number representation in the brain. Nature reviews neuroscience, 9 (4), 278-291. https://doi.org/10.1038/nrn2334
Arsalidou, M., & Pascual-Leone, J. (2016). Constructivist developmental theory is needed in developmental neuroscience. npj Science Learning, 1 , 16016.https://doi.org/10.1038/npjscilearn.2016.16
Ausubel, D. P., Novak, J. D., & Hanesian, H. (1978). Educational psychology: A cognitive view .(2nd ed.). Holt, Rinehart and Winston.
Bhattacharyya, R. K. (2011). Brahmagupta: The ancient Indian mathematician. In B. Yadav & M. Mohan (Eds.), Ancient Indian leaps into mathematics (pp. 185–192). Birkhäuser Boston.https://doi.org/10.1007/978-0-8176-4695-0_12
Blascheck, T., Kurzhals, K., Raschke, M., Burch, M., Weiskopf, D., & Ertl, T. (2017). Visualization of eye tracking data: A taxonomy and survey. Computer Graphics Forum, 36(1), 260–284.https://doi.org/10.1111/cgf.13079
Borji, A., Cheng, M., Hou, Q., Jiang, H., & Li, J. (2019). Salient object detection: A survey. Computational Visual Media, 5(2), 117–150.https://doi.org/10.1007/s41095-019-0149-9
Bruner, J. (1974). Toward a theory of instruction. Harvard University Press.
Chang, T. T., Chen, N. F., & Fan, Y. T. (2022). Uncovering sex/gender differences of arithmetic in the human brain: Insights from fMRI studies. Brain and Behavior, 12(10), e2775.https://doi.org/10.1002/brb3.2775
Cooper, P. A. (1993). Paradigm shifts in designed instruction: From behaviorism to cognitivism to constructivism. Educational Technology, 33 (5), 12-19.
Cui, Z., Hu, Y., Wang, X., Li, C., Liu, Z., Cui, Z., & Zhou, X. (2024). Form perception is a cognitive correlate of the relation between subitizing ability and math performance. Cognitive Processing, 1-11.https://doi.org/10.1007/s10339-024-01175-3
Dehaene, S. (2011). The number sense: How the mind creates mathematics . Oxford University Press.
Dehaene, S., Piazza, M., Pinel, P., & Cohen, L. (2005). Three parietal circuits for number processing. In J. I. D. Campbell (Ed.), Handbook of mathematical cognition (pp. 433–453). Psychology Press.
Dehaene, S., Molko, N., Cohen, L., & Wilson, A. J. (2004). Arithmetic and the brain. Current Opinion in Neurobiology, 14(2), 218-224.https://doi.org/10.1016/j.conb.2004.03.008
Dehaene, S. (1997). The Number Sense: How the Mind Creates Mathematics . New York, NY: Oxford University Press.
Dogusoy-Taylan, B., & Cagiltay, K. (2014). Cognitive analysis of experts’ and novices’ concept mapping processes: An eye tracking study. Computers in Human Behavior, 36, 82-93. https://doi.org/10.1016/j.chb.2014.03.036
Duchowski, A. T., Medlin, E., Cournia, N., Gramopadhye, A., Melloy, B., & Nair, S. (2002). 3D eye movement analysis for VR visual inspection training. In Proceedings of the 2002 Symposium on Eye Tracking Research & Applications (pp. 103–110). Association for Computing Machinery.https://doi.org/10.1145/507072.507094
Escotto-Cordova, A., & Sanchez Ruiz, J. G. (2018). Recursos semióticos en la enseñanza de las matemáticas . Universidad Nacional Autónoma de México, Facultad de Estudios Superiores Zaragoza.
Gagnier, K. M., Holochwost, S. J., & Fisher, K. R. (2022). Spatial thinking in science, technology, engineering, and mathematics: Elementary teachers' beliefs, perceptions, and self‐efficacy. Journal of Research in Science Teaching, 59 (1), 95-126.https://doi.org/10.1002/tea.21722
Gegenfurtner, A., Lehtinen, E., & Säljö, R. (2011). Expertise differences in the comprehension of visualizations: A meta-analysis of eye-tracking research in professional domains. Educational Psychology Review, 23 , 523-552. https://doi.org/10.1007/s10648-011-9174-7
Gu, Y., & Paracha, S. (2023, November). When Eyes tell a story… An Eye-tracking Approach towards creating a fit-for-purpose Learning Management System for Higher Education. In 2023 IEEE International Conference on Development and Learning (ICDL) (pp. 306-311). IEEE. https://doi.org/10.1109/ICDL55364.2023.10364450
Guzman-Jimenez, R., Dhavit-Prem, Saldívar, A., & Escotto-Córdova, A. (2023). Semiotic alternations with the Yupana Inca Tawa Pukllay in the gamified learning of numbers at a rural Peruvian school. Educational Technology & Society, 26 (1), 79–94.
Hartmann, M., Mast, F. W., & Fischer, M. H. (2016). Counting is a spatial process: Evidence from eye movements. Psychological Research, 80 (3), 399-409. https://doi.org/10.1007/s00426-015-0722
Hayes, P. J. (1978). Cognitivism as a paradigm. Behavioral and Brain Sciences, 1 (2), 238–239. https://doi.org/10.1017/S0140525X00074231
Kaczkurkin, A., Raznahan, A., & Satterthwaite, T. (2019). Diferencias sexuales en el cerebro en desarrollo: Conocimientos de la neuroimagen multimodal. Neuropsychopharmacology, 44(1), 71–85.https://doi.org/10.1038/s41386-018-0111-z
Kowalski, R. (1979). Algorithm = logic + control. Communications of the ACM, 22 (7), 424–436. https://doi.org/10.1145/359131.359136
Kerkhoff, Y., Wedepohl, S., Nie, C., Ahmadi, V., Haag, R., & Behrends, S. (2022). A fast open-source Fiji-macro to quantify virus infection and transfection on single-cell level by fluorescence microscopy. MethodsX, 9 , 101834.https://doi.org/10.1016/j.mex.2022.101834
Kunz, A. K., Zlatkin-Troitschanskaia, O., Schmidt, S., Nagel, M. T., & Brückner, S. (2024). Investigation of students' use of online information in higher education using eye tracking. Smart Learning Environments, 11 (1), 44. https://doi.org/10.1186/s40561-024-00300-3
Lo, S., & Andrews, S. (2022). The effects of mental abacus expertise on working memory, mental representations, and calculation strategies used for two-digit Hindu-Arabic numbers. Journal of Numerical Cognition, 8(1), 89–122.https://doi.org/10.5964/jnc.8073
Marlina, Y., & Yunas, M. F. (2024). Evaluation of Digital-English Project Based Learning (PJBL) Model through Eye Tracking Analysis in Higher Education. EDUTEC: Journal of Education And Technology, 7(3), 401–411.
Mix, K. S., & Cheng, Y. L. (2012). The relation between space and math: Developmental and educational implications. In Advances in Child Development and Behavior, 42 , 197–243.https://doi.org/10.1016/B978-0-12-394388-0.00006-X
Nickerson, R. S. (1988). Counting, computing, and the representation of numbers. Human Factors: The Journal of the Human Factors and Ergonomics Society, 30 (2), 181–199.https://doi.org/10.1177/001872088803000206
Ooms, K., De Maeyer, P., & Fack, V. (2014). Study of the attentive behavior of novice and expert map users using eye tracking. Cartography and Geographic Information Science, 41 (1), 37–54. https://doi.org/10.1080/15230406.2013.860255
Ott, N., Brünken, R., Vogel, M., & Malone, S. (2018). Multiple symbolic representations: The combination of formula and text supports problem solving in the mathematical field of propositional logic. Learning and Instruction, 58 , 88–105.https://doi.org/10.1016/j.learninstruc.2018.04.010
Piaget, J. (1970). Piaget’s theory. In P. H. Mussen (Ed.), Carmichael’s manual of child psychology (Vol. 1, pp. 703–732). Wiley.
Prem, D. (2016). Yupana Inka - Decodificando la matemática Inka: Método Tawa Pukllay. Asociación Yupanki.
Prem, D. (2018). Hatun Yupana Qellqa: Método Tawa Pukllay. Asociación Yupanki.
Prem, D., Guzman-Jimenez, R., Sotomayor, F., & Saldivar, A. (2022). Tawa Pukllay proof: New method for solving arithmetic operations with the Inca Yupana using pattern recognition and parallelism. In 2022 International Conference on Frontiers of Artificial Intelligence and Machine Learning (FAIML) (pp. 209–218).https://doi.org/10.1109/FAIML57028.2022.00048
Ram, S. S., & Ramakalyani, V. (Eds.). (2022). History and development of mathematics in India: Proceedings of the Annual Conference on History and Development of Mathematics, 2018 . National Mission for Manuscripts.
Richeson, A. W. (1933). The number system of the Mayas. The American Mathematical Monthly, 40 (9), 542–546.https://doi.org/10.1080/00029890.1933.11987486
Ribeiro da Silva Junior, L., Henrique Goncalves Cesar, F., Theoto Rocha, F., & Eduardo Thomaz, C. (2018). A combined eye-tracking and EEG analysis on chess moves. IEEE Latin America Transactions, 16(5), 1288–1297.https://doi.org/10.1109/TLA.2018.8407099
Sheridan, H., & Reingold, E. M. (2014). Expert vs. novice differences in the detection of relevant information during a chess game: Evidence from eye movements. Frontiers in Psychology, 5, Article 941.https://doi.org/10.3389/fpsyg.2014.00941
Silva, A., Afonso, J., Sampaio, A., Pimenta, N., Lima, R., Castro, H., & Murawska-Ciałowicz, E. (2022). Differences in visual search behavior between expert and novice team sports athletes: A systematic review with meta-analysis. International Journal of Environmental Research and Public Health, 19 (12), 7172.https://doi.org/10.3389/fpsyg.2022.1001066
Šola, H. M., Qureshi, F. H., & Khawaja, S. (2024). AI Eye-Tracking Technology: A new era in managing cognitive loads for online learners. Education Sciences, 14(9), 933. https://doi.org/10.3390/educsci14090933
Srinivasan, M., Wagner, K., Frank, M. C., & Barner, D. (2018). The role of design and training in artifact expertise: The case of the abacus and visual attention. Cognitive Science, 42(Suppl 3), 757–782.https://doi.org/10.1111/cogs.12611
Sundstedt, V., & Garro, V. (2022). A systematic review of visualization techniques and analysis tools for eye-tracking in 3D environments. Frontiers in Neuroergonomics, 3 , 910019.https://doi.org/10.3389/fnrgo.2022.910019
Thayaseelan, K., Zhai, Y., Li, S., & Liu, X. (2024). Revalidating a measurement instrument of spatial thinking ability for junior and high school students. Disciplinary and Interdisciplinary Science Education Research, 6 (1), 3.https://doi.org/10.1186/s43031-024-00095-8
Uttal, D. H., Meadow, N. G., Tipton, E., Hand, L. L., Alden, A. R., Warren, C., & Newcombe, N. S. (2013). The malleability of spatial skills: A meta-analysis of training studies. Psychological Bulletin, 139(2), 352.https://doi.org/10.1037/a0028446
van der Weijden, F. A., Kamphorst, E., Willemsen, R. H., Kroesbergen, E. H., & van Hoogmoed, A. H. (2018). Strategy use on bounded and unbounded number lines in typically developing adults and adults with dyscalculia: An eye-tracking study. Journal of Numerical Cognition, 4(2), 337–359.https://doi.org/10.5964/jnc.v4i2.115
Wang, C. (2020). A review of the effects of abacus training on cognitive functions and neural systems in humans. Frontiers in Neuroscience, 14 , 913.https://doi.org/10.3389/fnins.2020.00913
Yang, C. C., Totzek, J. F., Lepage, M., & Lavigne, K. M. (2022). Normative sex differences in cognition and morphometric brain connectivity: Evidence from 30,000+ UK Biobank participants. bioRxiv.https://doi.org/10.1101/2022.10.12.511938
Yuan, L., Kong, F., Luo, Y., Zeng, S., Lan, J., & You, X. (2019). Gender differences in large-scale and small-scale spatial ability: A systematic review based on behavioral and neuroimaging research. Frontiers in Behavioral Neuroscience, 13 , 128.https://doi.org/10.3389/fnbeh.2019.00128
All these moves are part of the method Yupana Inka Tawa Pukllay (YITP), developed by author Dhavit Prem and the Yupanki Association (Prem, D., 2016).
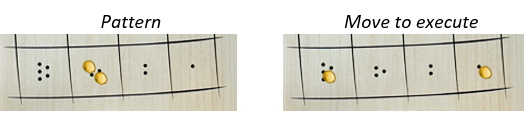
Short open movement. This move is made when square 2 has more than one piece. It consists of taking half of the tokens from box 2 to box 1 and the other half to box 3. If the number of tokens is odd, one token is left in box 2, and with the remaining tokens proceed as in the case of the even number of tokens (see figure 2).
Figure 2
“Short open” movement. YITP
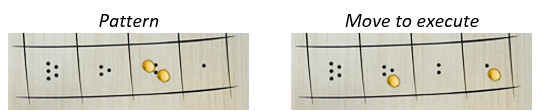
Figure 3
“Long open” movement. YITP
Pisqa movement (birth of new line). This move is made when square 5 has more than one piece. It consists of taking half of the pieces from square 5 to square 1 of the row immediately above and removing the other half from the board. If the number of tokens in box 5 is odd, 1 token is left in box 5, and with the remaining tokens proceed as in the case of the even number of tokens (see figure 4).
Figure 4
“Pisqa” movement YITP
KIKIN movement (box 1, mnemonic: “2 in 1 = 1 in 2”; “3 in 1 = 1 in 3”; “5 in 1 = 1 in 5”) : This movement consists of replacing a group of 5 pieces of box 1 for 1 token in box 5; replace a group of 3 checkers in box 1 with a 1 checker in box 3 and replace 2 checkers in box 1 with 1 checker in box 2, whichever is the case (see figure 5).
Figure 5
“Kikin” movement YITP
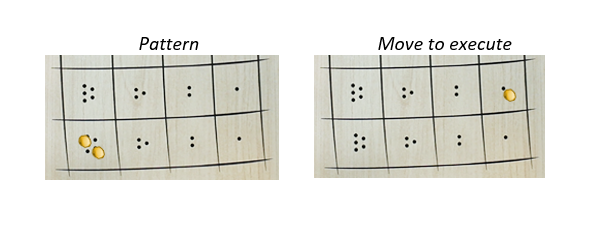
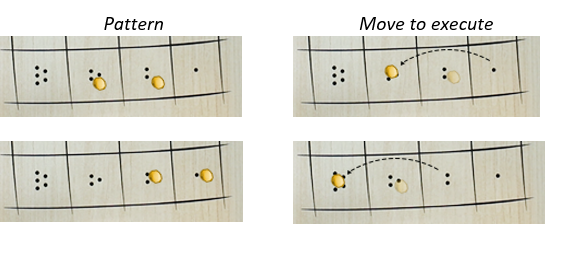
PICHANA movement (boxes 1 and 2): This movement is performed in two cases, (see figure 6): Pichana (1 and 2) This movement consists of moving as many pieces from box 1 to box 3 as there are pieces in box 2 of the same row and then removing that number of pieces from the board from box 2. Pichana (2 and 3) This movement consists of moving as many pieces from square 2 to square 5 as there are pieces in square 3 of the same row and then removing that number of pieces from the board from square 3.
Figure 6
PICHANA movement YITP
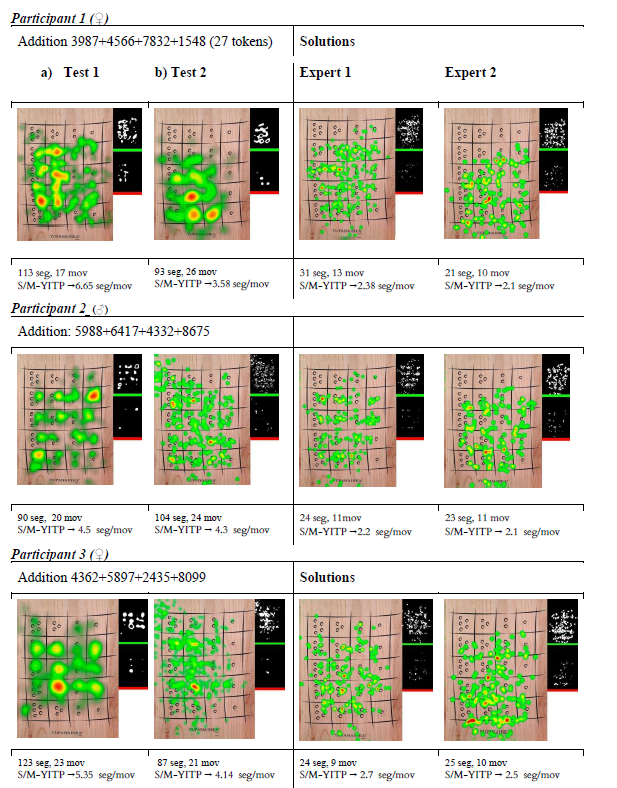
P1 (♀ ): Solved maintaining an order in columns starting with the ”pisqa” move (5 dots column) and ending with ”kikin” (1 dot column). She used her own algorithm, which was evidenced by observing the heat map in the fixation areas.
of figure 3. She correctly solved all 7 additional exercises. Its average addition resolution time is 1.13 min. No advanced moves were observed. Test 2 took 9 more moves to solve the exercise, but 20 seconds less. Even though she has used more moves, she has decreased her solution time by 20%. Time per move (T/M-YITP) has reduced by 46%.
P2 (♂ ): Solved maintaining order by columns (basic moves). On Test 2 she correctly solved 3 of the 7 addition exercises and her average time for solving additions was 1.04 min. No advanced moves were observed. Test 2 took 4 more moves to solve the exercise, but 14 seconds less, so the M/R- YITP was reduced by 4%
P3 (♀ ): Solved maintaining order by columns (basic moves). On Test 2 she correctly solved 6 of the 7 additional exercises and his average solution time was 1.01 min. No composite moves were observed. On Test 2 she used two moves less than in Test 1 and it took her 36 seconds less to solve the exercise (29.3% less). T/M-YITP fell by 22.6%. A notable increase is observed in the VRT Dispersion with a tendency towards the patterns observed in experts.
P4 (♂ ): Solved by maintaining order from units to ten thousands (bottom to top). On Test 2 he correctly solved 6 of 7 addition exercises and her average time for solving additions is 51 s. He performed an advanced move, ”Hatun pichana”. On Test 2 he reduced 8 moves and did it 14 seconds faster. Although the T/M-YITP increased, the number of final moves was reduced, which responds to the participant’s use of composite moves. A difference has been seen in the heat points, greater dispersion in the evaluation. He showed great confidence when solving the exercise.
P5 (♀ ): Solved by maintaining order from units to tens of thousands (from bottom to top). On Test 2 she was not able to solve any sum correctly, she knows the moves, but she made mistakes in one move per game and her average time for solving sums is 1:10 min. No composite moves were observed. Test 2 needed 6 more moves, but it was 2:23 minutes faster. The T/M-YITP was accelerated by 70%. Heat zones remain similar with a slight increase in dispersion.
P6 (♂ ): Solved maintaining order from units to tens of thousands (from bottom to top). On Test 2 he solved 5 of 7 sums correctly and his average time for solving sums was 1:22 min. No composite moves were observed. Test 2 needed 2 fewer moves than in Test 1 and did it 1:03 minutes faster. Heat zones remain similar. T/M-YITP fell by 39%.
P7 (♀ ): Solved maintaining order, starting from thousands and going down to units. On Test 2 she solved 1 of 8 sums correctly. She is confused about one of the basic moves: ”kikin”, which leads to bad results. She does the other moves well and her average time for solving sums is 1:38 min. One advanced move was observed: ”sonqo”. Test 2 took 4 moves less and 6 seconds longer to solve the exercise. T/M-YITP rose 26%.
P8 (♂ ): Solved by maintaining order Kimsa, Kikin, Pisqa, Iskay. In the evaluation, he solved 3 of 7 sums correctly and his average time for solving sums is 1:13 minutes. No composite moves were observed. Test 2 took 8 moves less and 1:46 min less. The T/M-YITP ratio decreased by 26% Experts, they prioritise advanced moves. If there are none, experts seek to create their own composite moves. If not, basic moves are performed. It is observed that in the Kamachiq both experts use different algorithms evidenced in the heat map (see Figure 3c and 3d). The average time for solving sums was between 21-31 s. T/M-YITP is similar for both experts. Both experts correctly solved all 7 sums.