Transforming Confocal Microscopy Imaging Data of Retinal Vasculature into 3D Animation | |
|
Emilyn Frohn1, Leah Lebowicz1, Rex Twedt1, Christine Young1 |
|
![]()
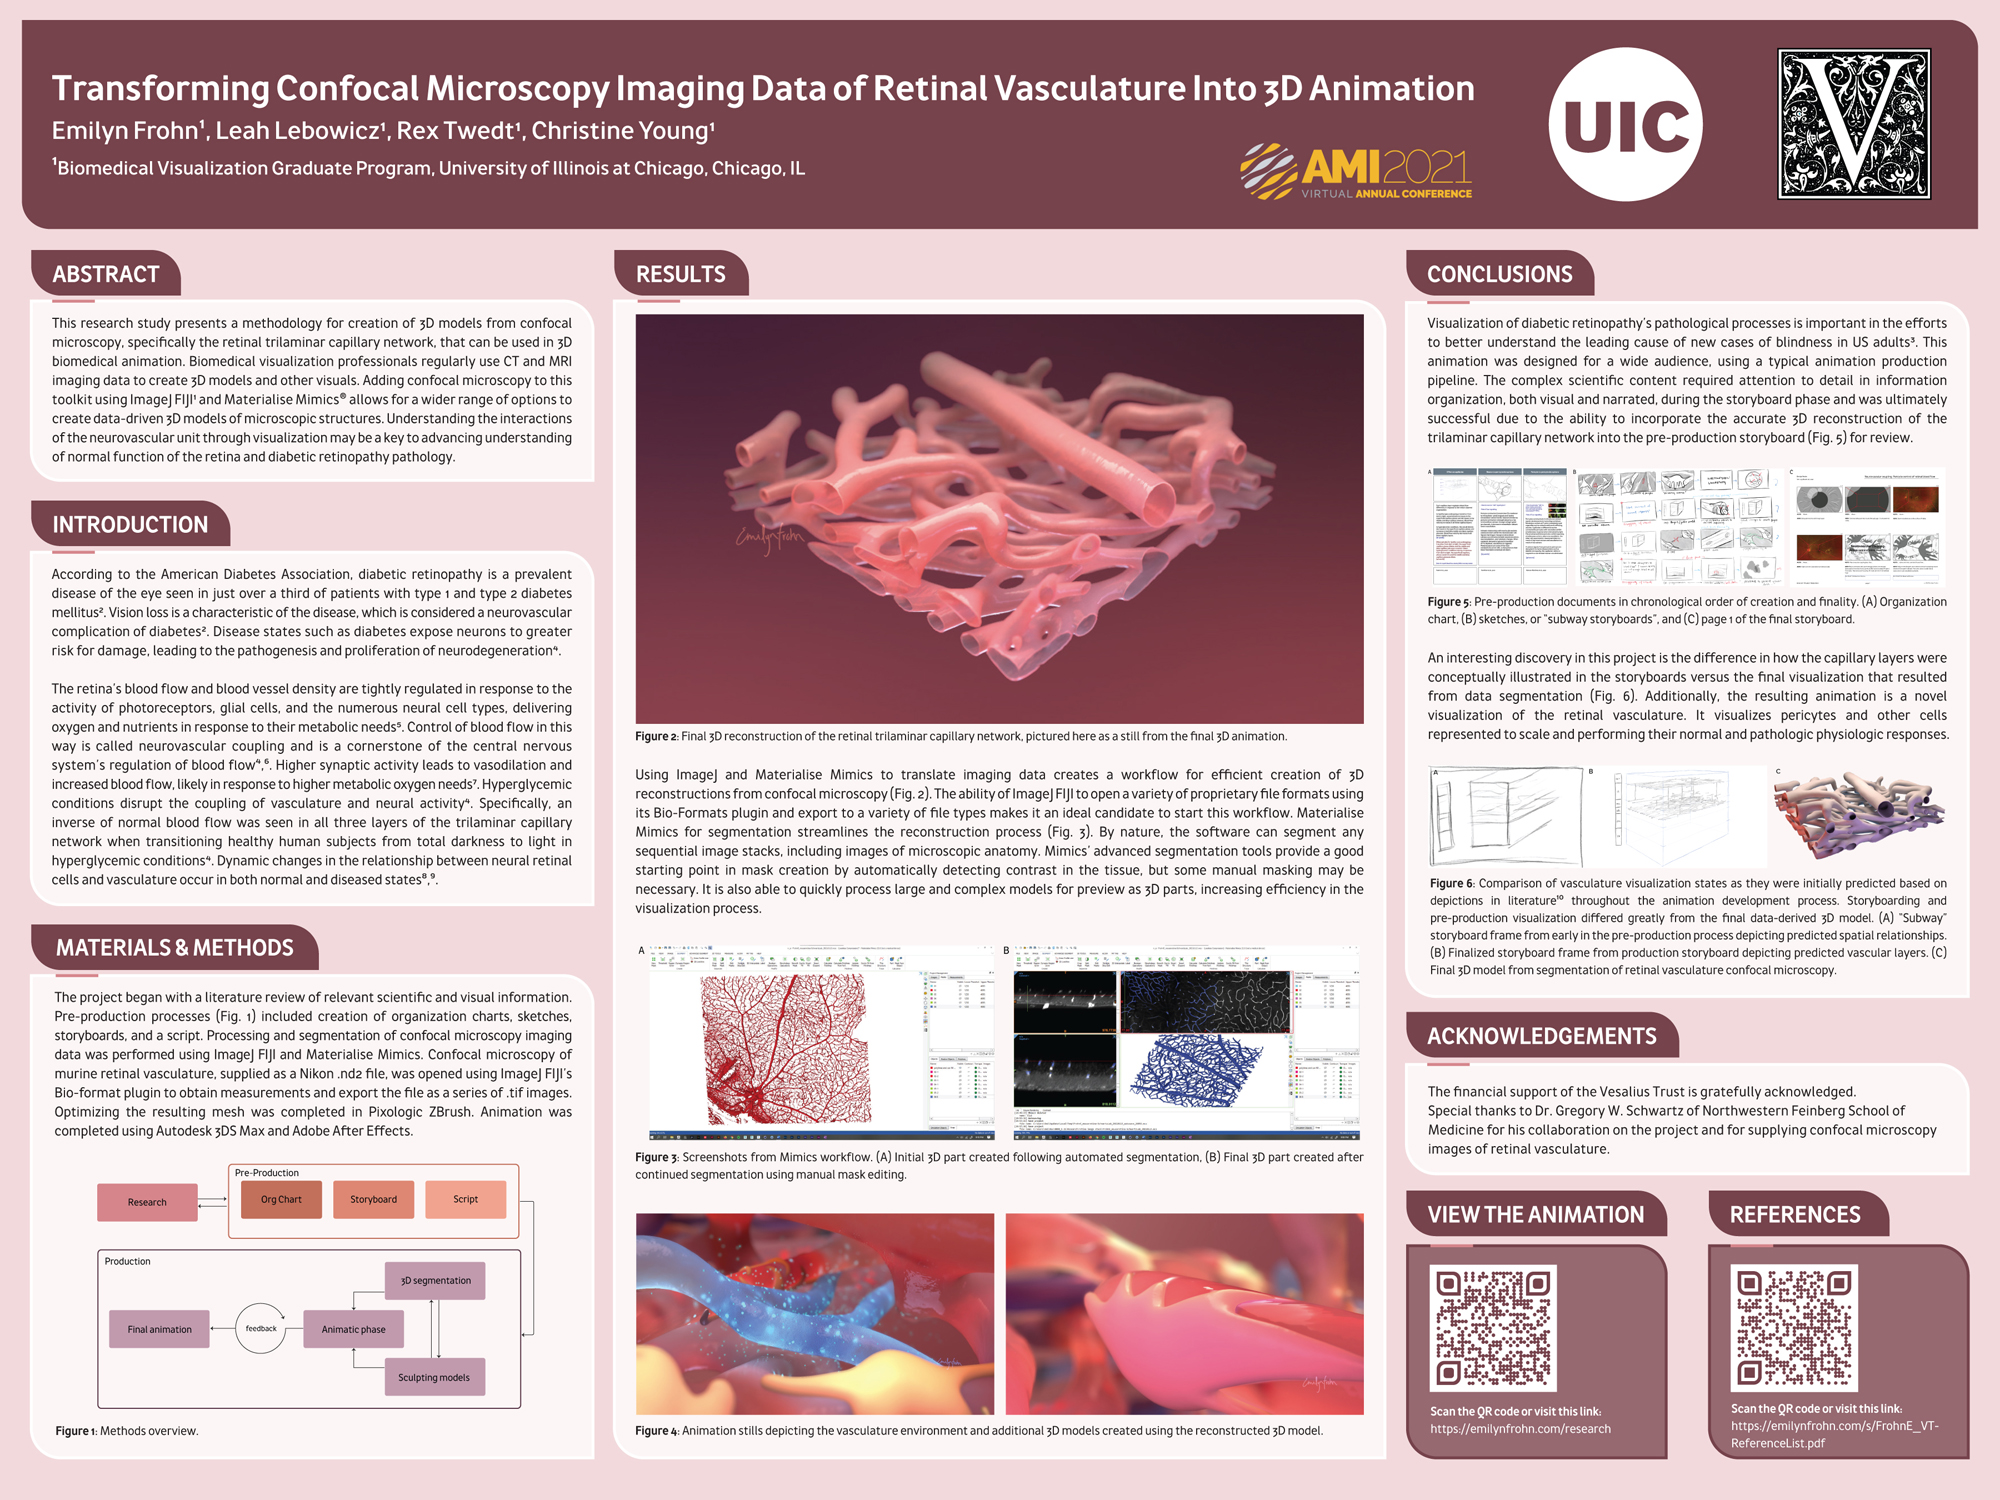
Abstract This research study presents a methodology for creation of 3D models from confocal microscopy, specifically the retinal trilaminar capillary network, that can be used in 3D biomedical animation. Biomedical visualization professionals regularly use CT and MRI imaging data to create 3D models and other visuals. Adding confocal microscopy to this toolkit using ImageJ FIJI1 and Materialise Mimics® allows for a wider range of options to create data-driven 3D models of microscopic structures. Understanding the interactions of the neurovascular unit through visualization may be a key to advancing understanding of normal function of the retina and diabetic retinopathy pathology.
|
Introduction
According to the American Diabetes Association, diabetic retinopathy is a prevalent disease of the eye seen in just over a third of patients with Type 1 and Type 2 diabetes mellitus2. Vision loss is a characteristic of the disease, which is considered a neurovascular complication of diabetes2. Disease states such as diabetes expose neurons to greater risk for damage, leading to the pathogenesis and proliferation of neurodegeneration4.
The retina's blood flow and blood vessel density are tightly regulated in response to the activity of photoreceptors, glial cells, and the numerous neural cell types, delivering oxygen and nutrients in response to their metabolic needs5. Control of blood flow in this way is called neurovascular coupling and is a cornerstone of the central nervous system's regulation of blood flow4,6. Higher synaptic activity leads to vasodilation and increased blood flow, likely in response to higher metabolic oxygen needs7. Hyperglycemic conditions disrupt the coupling of vasculature and neural activity4. Specifically, an inverse of normal blood flow was seen in all three layers of the trilaminar capillary network when transitioning healthy human subjects from total darkness to light in hyperglycemic conditions4. Dynamic changes in the relationship between neural retinal cells and vasculature occur in both normal and diseased states8,9.
Materials and Methods
The project began with a literature review of relevant scientific and visual information. Pre-production processes (Figure 1) included creation of organization charts, sketches, storyboards, and a script. Processing and segmentation of confocal microscopy imaging data was performed using ImageJ FIJI and Materialise Mimics. Confocal microscopy of murine retinal vasculature, supplied as a Nikon .nd2 file, was opened using ImageJ FIJI's Bio-Format plugin to obtain measurements and export the file as a series of .tif images. Optimizing the resulting mesh was completed in Pixologic ZBrush. Animation was completed using Autodesk 3DS Max and Adobe After Effects.

Figure 1: Methods overview.

Figure 2: Final 3D reconstruction of the retinal trilaminar capillary network, pictured here as a still from the final 3D animation.
Results
Using ImageJ and Materialise Mimics to translate imaging data creates a workflow for efficient creation of 3D reconstructions from confocal microscopy (Figure 2). The ability of ImageJ FIJI to open a variety of proprietary file formats using its Bio-Formats plugin and export to a variety of file types makes it an ideal candidate to start this workflow. Materialise Mimics for segmentation streamlines the reconstruction process (Figure 3). By nature, the software can segment any sequential image stacks, including images of microscopic anatomy. Mimics' advanced segmentation tools provide a good starting point in mask creation by automatically detecting contrast in the tissue, but some manual masking may be necessary. It is also able to quickly process large and complex models for preview as 3D parts, increasing efficiency in the visualization process.

Figure 3: Screenshots from Mimics workflow. (A) Initial 3D part created following automated segmentation, (B) Final 3D part created after continued segmentation using manual mask editing.

Figure 4: Animation stills depicting the vasculature environment and additional 3D models created using the reconstructed 3D model.
Conclusions
Visualization of diabetic retinopathy's pathological processes is important in the efforts to better understand the leading cause of new cases of blindness in US adults3. This animation was designed for a wide audience, using a typical animation production pipeline. The complex scientific content required attention to detail in information organization, both visual and narrated, during the storyboard phase and was ultimately successful due to the ability to incorporate the accurate 3D reconstruction of the trilaminar capillary network into the pre-production storyboard (Figure 5) for review.

Figure 5: Pre-production documents in chronological order of creation and finality. (A) Organization chart, (B) sketches, or "subway storyboards," and (C) page 1 of the final storyboard.
An interesting discovery in this project is the difference in how the capillary layers were conceptually illustrated in the storyboards versus the final visualization that resulted from data segmentation (Figure 6). Additionally, the resulting animation is a novel visualization of the retinal vasculature. It visualizes pericytes and other cells represented to scale and performing their normal and pathologic physiologic responses.

Figure 6: Comparison of vasculature visualization states as they were initially predicted based on depictions in literature10 throughout the animation development process. Storyboarding and pre-production visualization differed greatly from the final data-derived 3D model. (A) "Subway" storyboard frame from early in the pre-production process depicting predicted spatial relationships. (B) Finalized storyboard frame from production storyboard depicting predicted vascular layers. (C) Final 3D model from segmentation of retinal vasculature confocal microscopy.
To view a high resolution PDF of this poster, select on the above image or this "PDF" link.
View the Animation
Scan the QR code within the above poster or visit this link: https://emilynfrohn.com/research
References
1. Schneider CA, Rasband WS, Eliceiri KW. NIH Image to ImageJ: 25 years of image analysis. Nature Methods. 2012; 9(7):671-675. doi:10.1038/nmeth.2089
2. Solomon SD, Chew E, Duh EJ, et al. Diabetic retinopathy: A position statement by the American Diabetes Association. Diabetes Care. 2017; 40(3):412-418. doi:10.2337/dc16-2641
3. Centers for Disease Control and Prevention (CDC). National Diabetes Statistics Report 2020: Estimates of Diabetes and Its Burden in the United States.; 2020.
4. Kwan CC, Lee HE, Schwartz GW, Fawzi AA. Acute hyperglycemia reverses neurovascular coupling during dark to light adaptation in healthy subjects on optical coherence tomography angiography. Investigative Ophthalmology & Visual Science. 2020; 61(4):1-9. doi:https://doi.org/10.1167/iovs.61.4.38
5. Nesper PL, Lee HE, Fayed AE, Schwartz GW, Yu F, Fawzi AA. Hemodynamic response of the three macular capillary plexuses in dark adaptation and flicker stimulation using optical coherence tomography angiography. Investigative Ophthalmology and Visual Science. 2019; 60(2):694-703. doi:10.1167/iovs.18-25478
6. Kur J, Newman EA, Chan-Ling T. Cellular and physiological mechanisms underlying blood flow regulation in the retina and choroid in health and disease. Progress in Retinal and Eye Research. 2012; 31(5):377-406. doi:10.1016/j.preteyeres.2012.04.004
7. Kornfield TE, Newman EA. Regulation of blood flow in the retinal trilaminar vascular network. Journal of Neuroscience. 2014; 34(34):11504-11513. doi:10.1523/JNEUROSCI.1971-14.2014
8. Antonetti DA, Klein R, Gardner TW. Mechanisms of disease: Diabetic retinopathy. The New England Journal of Medicine. Published online 2012; 366(13):1227-39.
9. Jampol LM, Glassman AR, Sun J. Evaluation and Care of Patients with Diabetic Retinopathy. The New England Journal of Medicine. 2020; 382(17):1629-1637. doi:10.1056/NEJMra1909637
10. Nesper PL, Fawzi AA. Human parafoveal capillary vascular anatomy and connectivity revealed by optical coherence tomography angiography. Investigative Ophthalmology & Visual Science. 2018; 59(10):3858-3867. doi:10.1167/iovs.18- 24710
Acknowledgments
The financial support of the Vesalius Trust is gratefully acknowledged. Special thanks to Dr. Gregory W. Schwartz of Northwestern University Feinberg School of Medicine for his collaboration on the project and for supplying the confocal microscopy images of retinal vasculature.
Licensing
The authors have chosen to license this content under a Creative Commons Attribution, NonCommercial, NoDerivatives 4.0 International License.
![]()