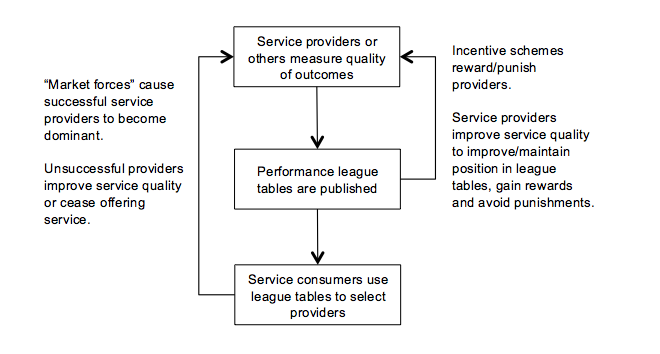
Figure 2: Assumed model of performance measurement process
Several trends are increasing the amount of data available to citizens. One is ever-increasing internet access, which facilitates public dissemination of information on an unprecedented scale. At the same time there is demand for greater transparency and freedom of information; knowledge is power, the “oxygen of democracy” and so on. This view underpins a growing movement towards publication of data wherever practicable. Manifestations of this trend include the Open Data movement, which seeks to make many kinds of public sector data freely available, and the Semantic Web, which aims to link freely-available data in useful ways (Berners-Lee, Hendler, & Lassila, 2001; Hogge, 2010).
Government data are now produced for public consumption on a range of subjects. For example, data are published on the performance of public bodies, including hospital waiting list statistics, police crime data and school performance league tables. It is thought that publishing data will facilitate performance improvement and deter corruption (UK Government, 2011). The idea has spread to the private sector, with, for example, the salaries of the highest-paid CEOs being published.
Yet it is not clear that the anticipated benign outcomes are always realised. Anecdotal evidence suggests that publication of data can produce unanticipated negative effects. For example, the publication of school league tables may be associated with declining performance in some schools; data showing a diminishing threat of crime seem to be linked with a pervasive, heightened sense of danger; publication of CEO salaries has been blamed for accelerating inflation in directors’ pay levels. These problems seem to stem from the collective impact of individual behaviour when people react to information.
Individuals respond to their environment, which includes data. Considered together, the government organisations being measured, the media which report on performance, and the public who receive reported performance data constitute a complex social system. Like many complex systems, this system has the potential to exhibit unpredictable and counterintuitive behaviour. Although the publication of data may be well-intentioned and “promotes a spirit of openness that may be valuable for enhancing trust”, it may well also “inadvertently reduce, rather than improve, quality” (Werner & Asch, 2005).
This paper looks at how and why perverse outcomes may arise from the publication of data, with an emphasis on government performance data. The analysis does not focus on problems accruing from measurement per se, which have been explored in detail elsewhere (Bird et al., 2005; Pidd, 2005; Wankhade, 2011). Instead, attention is paid to issues that arise when data are published, and in particular to the impact of published data on mass behaviour.
The paper is structured as follows. The next section reviews the widespread use of performance measurement and performance indicators. Section 3 discusses the emergence of unintended consequences in complex social systems. Section 4 explores unintended consequences when performance measures are published. Section 5 concludes with a summary of findings and suggestions for further work.
Performance measurement (or "performance management”) has become popular since the 1980s, particularly in the West, thanks to business thinkers such as Rockart (1979), Deming (1986) and Kaplan (Kaplan & Norton, 1993). It works by identifying representative indicators of performance for some task or function. The measures often focus on highly visible aspects of output quality such as exam marks, waiting lists and response times. Numerical values are obtained to track the indicators over time, and target values are set so that conclusions can be drawn about performance. This way of assessing quality strongly contrasts with the idea of inspection, where an observer experiences a system or process first hand and forms some intuitive judgement about its relative merits.
The idea of applying “scientific” measurement techniques in business was inspired by statistical process control, and was appealing to Western firms as it became necessary to compete with rising Eastern economies such as Japan (Forester, 1993). The idea spread from business to government, and performance statistics are now used routinely in many countries in education, health, transport, emergency services and other fields (data.gov, 2012; data.gov.au, 2012; data.gov.uk, 2012; Goddard & Mannion, 2004; TBCS, 2012).
The resulting performance data are often published in the form of league tables (Figure 1), which rank providers according to their performance scores. League tables provide a convenient, compact and easy-to-understand way of communicating complex performance outcomes. A league table is simply a list of comparable service providers, ordered according to some statistic. For example, schools may be ranked according to average exam marks or the proportion of students achieving a particular grade. The provider with the best score appears highest in the list, the next-best score appears second, and so on, down to the provider with the worst score at the bottom of the table.
|
School name |
Average GCSE Points |
5
GCSE A*-C |
5
GCSE A*-C
|
|
Pitburgh Grammar |
738.5 |
100% |
100% |
|
Newtown Boys' Grammar |
551 |
99% |
99% |
|
Roundell's |
529.9 |
97% |
99% |
|
Newtown Girls Grammar |
526.6 |
100% |
100% |
|
The Jensen School |
512.9 |
98% |
98% |
|
Collar Valley |
504 |
78% |
86% |
|
Fernroad Community College |
493.6 |
64% |
79% |
|
Harlton Grammar |
489.5 |
97% |
99% |
|
West Deerland |
481.7 |
91% |
99% |
|
St Michael's Church of England Aided |
475.5 |
68% |
80% |
|
St Winifred's |
460.1 |
79% |
100% |
|
St William's |
454.9 |
88% |
88% |
|
Christchurch |
452.1 |
75% |
100% |
|
Cookton |
446 |
63% |
94% |
|
Broadway Community College |
436.2 |
60% |
79% |
|
Gormley Valley |
436.1 |
59% |
100% |
|
Highcombe |
435.6 |
86% |
95% |
|
Hardmouth |
434.5 |
0% |
99% |
|
Bigton Community College |
426.6 |
59% |
77% |
|
Dufer College |
420.3 |
57% |
78% |
|
Bentonley |
418.6 |
61% |
79% |
|
South Rufus Community College |
418 |
60% |
76% |
|
The Queen's |
405.2 |
68% |
77% |
|
Rotunda House |
362.9 |
73% |
100% |
|
Mary Court |
339.8 |
54% |
85% |
Figure 1: Part of a performance league table
Policymakers are often enthusiastic about the potential of performance management to improve public services, and assume that measurement will necessarily lead to improvement. But the mechanisms for improvement may not be spelled out. In the context of education “much of this work is characterized by the assumption that (performance indicators) will somehow ‘speak for themselves’ and strikingly little effort has been made to explore how they can be used to promote school improvement” (Strand, 1997).
Often a “carrot and stick” mechanism is implicit. Performance measures may be “attached to regulatory mechanisms whereby organisations are rewarded or punished according to the outcome” (Jacobs et al., 2006). It is assumed that this will motivate service providers to achieve more (carrot), while “naming and shaming” will motivate poor performers to improve (stick). If performance data are published, it is expected that service consumers will react rationally, by selecting the best-performing providers. On the face of it, this is a sensible use of transparency, with potential benefits for all involved. Figure 2 summarises the process.
Figure 2: Assumed model of
performance measurement process
The principles of performance measurement are not universally accepted, however. For example, in education, some countries (such as Wales and Northern Ireland) do not use performance indicators for schools, and others (such as Australia and the Republic of Ireland) have legislated explicitly against the publication of performance indicators for schools because of “dissatisfaction with the lack of contextualisation … and the negative ‘side-effects’” (Bird, et al., 2005). Finland, whose education system is ranked highly relative to other countries, reportedly has no school rankings or even assessments of schools (Gavrielatos, 2009).
Performance indicators are often used as part of “evidence-based” management (Pfeffer & Sutton, 2006). The data are taken as evidence of actual performance and are acted upon. But, perhaps ironically, there appears to be little strong evidence for the efficacy of using performance indicators. Once a performance measurement scheme is in operation, it becomes difficult to assess any resulting changes in systems and communities (Goddard & Mannion, 2004). For example, the UK National Health Service (NHS) is a large and complex healthcare system, embedded in a larger and even more complex socio-economic-legal system. The size and complexity of this supersystem makes it essentially impossible to disentangle the effects of targets and measurement from the effects of other factors. The UK Government claimed success from its use of hospital waiting time targets, citing apparently genuine reductions in measured waiting times for hospital admission (Propper et al., 2008). But it was reportedly impossible to attribute causality with any certainty, and it is not clear that overall benefit resulted; other functions “may have been adversely affected by the emphasis on waiting times” (Goddard, Mannion, & Smith, 2004). Because it is so difficult to know whether performance measurement schemes actually have a positive impact, Bird et al (2005) argue that “because of their usually tentative nature, (performance indicators) should be seen as ‘screening devices’ and not over-interpreted”.
Some findings suggest that the use of performance indicators can even be counterproductive, and have highlighted potentially “serious dysfunctional consequences” arising from the use of performance measurement “as a means of control” (Goddard, et al., 2004). Evidence from psychological research supports this concern. Despite widespread belief in the power of feedback to improve task performance, experiments show that receiving feedback can be detrimental for particular kinds of task—notably, for complex, non-rote tasks which rely heavily on cognitive resources (Kluger & DeNisi, 1996; Visscher & Coe, 2003). It can be argued that professional work in education and healthcare are indeed complex tasks in this sense, and so provision of performance feedback may not necessarily be helpful (Vulliamy & Webb, 2001). Doubts have certainly been raised about the use of performance indicators in healthcare, citing their tendency to encourage “unnecessary interventions, discounting clinician judgment and patient preferences”. One study found that the existence of cancer screening targets tended to lead physicians to screen patients unnecessarily, even when screening was contra-indicated (Werner & Asch, 2005).
Performance management starts from the presumption that the individual or organisation being measured has control over outcomes. It tends to ignore contextual influences on performance. This can be problematic, since most individuals and organisations participate in larger systems over which they lack control. Smith (1995) argues that most performance management schemes will fail, because they are “based on inadequate models of production and control”. For instance, NHS hospitals are part of a large system which constrains their operation in many ways. Arguably, comparing the output performance of NHS hospitals is unwise, because they are part of the same system and their performance variation is due mainly to location and patient demographics. Critics of performance measurement often cite this failure to consider context; “differences in patients … are not always reflected in results” (Sipkoff, 2007); “the star ratings did not allow for the different environmental circumstances within which PCTs (primary care trusts) operate and which affect their performance” (Jacobs, et al., 2006).
A similar argument can be made with regard to the use of performance measurement in education. It is argued that most of the variation between schools can be explained by environmental factors such as location and student socio-economic status. According to Brown (2005), “primary school league tables … are an unfair measure of school performance … in that they generally tend to favour those schools which are located in more affluent areas with relatively few social problems”. Yet the crucial information about location and socioeconomic status is largely ignored when performance data are generated, and it is typically absent from published data (Bosker & Scheerens, 2000).
It is a truism to say that approximately half of all service providers will be below average. Nevertheless, the structure of a performance league table requires that providers be ranked, regardless of how significant the measured performance differences are and irrespective of whether this measured difference is within the control of the provider. Faulty inferences about relative performance can result, and providers may be subject to inappropriate intervention by overseeing bodies (Jacobs, et al., 2006). If service providers observe that they have been placed in an irrational measurement system, they may quite rationally be motivated to respond by gaming the system or manipulating data in order to improve their apparent performance.
Ironically, there is evidence that providers often do not trust their own published performance data. According to Mannion and Goddard (2003), the publication of NHS outcomes data had low impact because practitioners had little faith in it as an accurate measure of their performance; “quality improvement activity was driven more by intrinsic professional motivation and pride rather than extrinsic incentives” (Davies et al., 2000). This finding is echoed by research, discussed later in Section 4.3, which suggests that people naturally tend to be influenced more by their own perceptions and the perceptions of those around them than by formal information. Nevertheless, despite their lack of trust in their own performance data, service providers learn to use the data for political purposes. For example, data showing poor performance can be used as evidence for the benefits of accountability or to justify requests for greater resources (Berman, 2002).
Performance measurement is a good example of a policy that sounds simple and easy to implement, but which can turn out in practice to be complex and problematic. Many complications can emerge. For example, it can be hard to reach agreement on suitable performance measures, particularly in large organisations where each unit’s goals need to be congruent with those of the enterprise. Unsurprisingly, studies have found poor alignment of performance measures across public service organisational hierarchies (Micheli & Neely, 2010). Measures are necessarily selective and may represent only a small part of the whole performance picture. They may ignore aspects of performance which are important but do not lend themselves to quantitative measurement. It may be clear what numbers are needed, but it may not be practicable to collect them; often, proxy factors must be used instead. At a fundamental level, organisations often have conflicting goals and it may not even be clear what, precisely, constitutes “good” performance (Adab et al., 2002; Hodgson, Farrell, & Connolly, 2007).
Once in operation, the usefulness of performance indicators may be reduced by poor quality data, uneven collection and statistical uncertainty (Adab, et al., 2002). Measured performance may be due to chance, yet statistical significance is rarely reported when performance data are published. Arguably, the majority of performance data are statistically insignificant. For example, short measurement periods make for less significant results: “over a 4-year period, it was difficult to identify consistently improving (or deteriorating) schools”; more reliable results would require impractically-long measurement timescales (Bird, et al., 2005).
A major criticism of performance measurement schemes arises from the emergence of gaming and other perverse outcomes, particularly in the public sector (Pidd, 2005; Smith, 1990). According to Bird et al (2005) many perverse outcomes are “anticipated by practitioners but … ignored in the design of (performance indicators)”. For example, a familiar perverse outcome is the so-called “ratchet effect”, where high achievement merely results in increased expectations. To avoid progressively higher targets “the agent has a strong incentive to report persistently low levels of performance” (Goddard, et al., 2004). This was reportedly a problem in the centrally-planned Soviet economy. A common response by service providers is to return distorted figures that show moderately but not overly good performance (Goldstein & Spiegelhalter, 1996c).
Moreover, a characteristic of league tables is that they are usually based on composite measures. This means that a provider’s rank depends strongly on the algorithm used to combine scores for individual aspects of performance, and is therefore “sensitive to changes made to the weighting system and to the aggregation rules. Some hospitals can jump almost half of the league table as a result of subtle changes” (Jacobs, Goddard, & Smith, 2005).
Even when measures are not subject to the above-mentioned problems, changes in circumstances can render them less useful over time (Sipkoff, 2007; Smith, 1995). For example, Van Thiel and Leeuw (2002) illustrate how changing crime patterns in the Netherlands invalidated established methods of measuring crime, creating the impression that the police were performing badly when their performance had, in fact, improved substantially.
Performance management is based on an optimistic but unproven rationale: that measurement will drive up quality. Theoretically, the measured indicators will be a good proxy for overall performance and providers will respond as expected, by improving their performance. However, evidence suggests that other outcomes are equally possible. Providers may be judged according to factors they cannot control, and the resulting indicators may not adequately reflect their actual contribution (Bosker & Scheerens, 2000). According to this view, “ambiguity over causation means that strong assertions and punishing actions are not warranted by the weak evidence provided by performance measures” (Davies & Lampel, 1998). A more helpful use of performance indicators would perhaps be to compare different systems, rather than comparing providers within a single system (Adab, et al., 2002).
Performance measurement regimes which also involve the publication of the performance data set up additional behavioural effects in the public, in service providers, and even in the media. Yet there is little understanding of “the complex behavioural consequences that may arise as a result of the collection and dissemination of performance data” (Goddard, Mannion, & Smith, 1998). Those publishing performance data have tended to simply assume that publication will automatically have the desired effect of improving performance. But introducing performance data into an already-complex organisational and social system risks the creation of unintended consequences. Figure 3 illustrates the process, showing how individuals, responding to data according to their own circumstances, create a complex system. Service providers gather data on performance, which are disseminated by means of various media to the public who act in response. Much research-to-date on performance measurement has focused on the left-hand oval in Figure 3 (service providers). However, the two right-hand groups (media and service consumers) also play a part in this complex system.

Figure 3: Complex system (publication of performance data)
The preceding section looked at the practice of performance measurement. This paper is concerned with unintended consequences that may arise when the resulting performance data are published. The literature on unintended consequences has a long history, going back at least to the influential sociologist Robert K. Merton (1936), who framed the problem in the context of social policy. Merton identified reasons why policies may fail to produce desired outcomes. He introduced the concept of the self-fulfilling prophecy, where policy designed to prevent a particular outcome has the unintended result of creating it. Merton explained how ignorance, error, and wishful thinking on the part of policy-makers can cause well-intentioned policies to fail.
Since Merton’s time, examples have multiplied of policies which, designed to produce one outcome, have led to another (Gillon, 2000; Margetts & Hood, 2010). For example, in higher education, the policy of increasing participation has led to the emergence of a “graduate barrier” between technicians and engineers/scientists (McGovern 1996). As more better-qualified job applicants present themselves, the qualification level demanded by employers for each post must increase, simply so that the employers can distinguish between applicants—regardless of whether possession of the required qualification actually increases competence in the post. This in turn makes it necessary for job-seekers to obtain increasingly higher-level qualifications, closing the pernicious loop (Duru-Bellat, 2009).
Laws and regulations intended to deal with particular social problems often have perverse and counterintuitive effects. For example, in the US justice system, mandatory arrest policies designed to protect the victims of domestic violence, “led to an unexpected increase in the number of victim arrests”, shifting “the risk of arrests in domestic violence cases from aggressors to victims” (Hovmand et al., 2009).
Experiences with technology offer a rich seam of unintended outcomes (Tenner, 1997). For example, learning technologies can have both benign and harmful consequences (McGinnes, 2011). According to Hermann, the installation of telephone systems in a sparsely-populated area of Australia led to “the loss of community: no longer could neighbors spend long periods talking on two-way radio at virtually no cost. The new technology was supposed to support and develop the region rather than to reduce its sense of community” (2000). In healthcare, IT produces a variety of unanticipated effects, including increased workload for clinicians, workflow problems, escalation in requirements, changes in communication patterns and practices, new types of error, changes in power structures, and overdependence on technology (Campbell et al., 2006).
When confronted by complex systems it is tempting to think simplistically about cause and effect (Wagner, 1999). The internal mechanisms that produce the behaviour of social and organisational systems are usually complex and are generally inaccessible to non-insiders. Unwanted outcomes, such as perceived educational failings, poor health outcomes, and rising property prices, are highly visible aspects of these complex systems. It is tempting to address the unwanted outcomes head-on, by trying to constrain them directly through legislation or some other top-down mechanism. For example, low exam marks and poor health outcomes may be “fixed” by setting targets.
Despite this temptation, theory tells us that it is usually not possible to control complex systems by constraining their outputs. The outputs of a system arise through the dynamic behaviour of the whole system. Attempting to constrain the output of any system is liable to backfire, since it may cause unpredictable behaviour elsewhere in the system (Von Bertalanffy, 1950). Unwanted outcomes can reliably be “fixed” only by changing the behaviour of the whole system, and this can in turn be altered only by making changes to the inputs and components of the system, not merely by constraining its outputs.
An illustration may be useful. If the intention is to control the output pressure from an air compressor (Figure 4), one might try to do this by fitting a valve on the output. The valve allows air at the required pressure to escape; any excess pressure is retained inside the compressor’s tank. It is easy to see that this solution might work in the short term, but would quickly go wrong. The compressor’s pump would continue to operate until the pressure of the tank exceeded safe limits, at which point failure would occur (the tank would explode, or the pump would break down, or the valve would fail). What is needed instead is a device which monitors the pressure in the tank and regulates the pressure by controlling the operation of the pump.
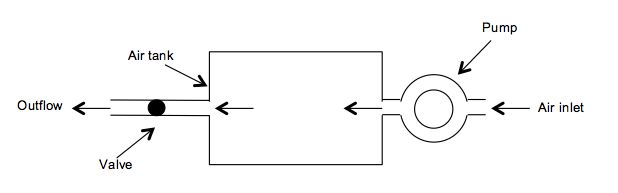
Figure 4: Air compressor
Social systems are, of course, much more complicated than this simple example and different in kind. But it is reasonable to think that trying to fix social systems by constraining outcomes could be equally ineffective and harmful. As in the compressor example, constraining the system’s outputs is ineffective because it does not control the system’s overall behaviour in a sustainable way. By analogy, we could hypothesise that desirable changes in social systems should be achieved by first analysing the specific causal mechanisms that produce unwanted outcomes, and then trying to determine what system-wide changes would produce the desired results. There is no guarantee that the required changes can feasibly be made, or even identified, but this approach could give an understanding of how outcomes are formed in the real social system, and this may help inform policy formulation aimed at inducing desirable change.
This idea is of course not new. For example, the field of Operations Research grew out of a realisation that real-world systems are amenable to rigorous quantitative analysis (Forrester, 1987). In sociology, the idea of the evidence-based “realist review” has emerged as a way of helping policy-makers understand outcomes (Pawson et al., 2005). It offers a method of reviewing the literature on prior research, inspired by the use of systematic reviews in the “hard” sciences (Higgins & Green, 2008). Realist review depends on the existence of reliable prior evidence of the effects of different policies. The analysis of causal mechanisms, proposed above, could be one way of generating research findings that would be useful in realist reviews on policy outcomes in different circumstances.
Complex social systems of the sort described above are amenable to the techniques of System Dynamics, a set of techniques which evolved in response to the need to understand and manage complex systems (Forrester, 1987). System Dynamics can help explain how outcomes emerge in diverse systems including business scenarios, biological systems, and social policy. Causal loop diagrams (Figure 5) show how factors are related and how change in one factor impacts others (Cavana & Mares, 2004).
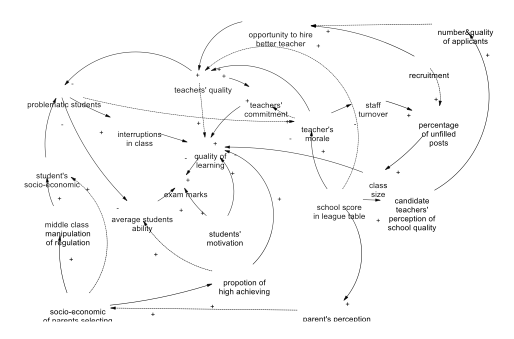
Figure 5: A Causal Loop Diagram
(Fragment)
The outputs of these systems typically depend in complex, non-linear ways on the interaction of multiple elements. For example, factors may affect one another in circular “feedback loops”. In a positive feedback loop, factor A increases factor B, which in turn (often through some unseen but complex mechanism) recursively increases factor A. Unless the cycle is damped, exponential growth may occur. For example, price inflation leads to salary inflation, which in turn fuels price inflation; unless action is taken to limit either type of inflation, both may spiral out of control. The other type of feedback is negative feedback; this causes loops to display stable, self-correcting behaviour which often leads to equilibrium. This kind of stability occurs when water is poured into a bowl and quickly finds its own level.
Politicians are often tempted to think simplistically about the effects of policies. But the feedback loops and other non-linear relationships in social systems can give rise to counterintuitive patterns of behaviour, such as sustained oscillation, overshoot and chaotic fluctuation (Barlas, 2009). The science of chaos has emerged from the observation that even simple systems can exhibit complex, unpredictable behaviour. This applies equally to mechanical systems, natural systems and social systems (Hsieh, 1991). For example, there is a widespread assumption that economic equilibrium will be achieved when barriers to economic action, such as import tariffs and regulation, are removed and “perfect information” prevails. But there does not seem to any reliable basis for this assumption, and some analysis predicts that the result of global financial deregulation will be sustained oscillation rather than equilibrium (Minsky, 1992).
Adam Smith first wrote of the “invisible hand”, that leads individuals, acting out of self-interest, to create unintended outcomes to the benefit of society (Smith, 1759). The invisible hand is, of course, a metaphor; it is a shorthand way of talking about complex chains of causality, usually in the sphere of economics. Similarly, when politicians speak of “market forces” they are employing a comparable shorthand to summarise the behaviour of complex socio-economic systems (Aydinonat, 2008). It is often assumed that the complex causal chains characterised as market forces will have benign, stable outcomes. However, such a belief seems, at best, optimistic when the complexity and non-linearity of the underlying systems are considered (Forrester, 1971).
The invisible hand can be seen at work when individuals act en masse in response to information. There are many situations where the publication of information, often in a spirit of transparency, seems to destabilise a complex situation and create an unintended effect (Hood & Heald, 2006).
Frequent references in the news media to “the global financial crisis”, when no recession exists, have been blamed for exacerbating perceptions of financial instability and precipitating consumer behaviour likely to increase the risk of recession (Whitlock, 2008).
The swine flu “panic” of 2009, which was out of all proportion to actual risk, was blamed on repetitive, alarmist coverage by news media (Leet, 2009).
It has been claimed that the online publication of house price data “provides an unusually high incentive to overstate the price at which a property sold” and may drive price inflation (Brown, 2006). It can be shown that all parties with a financial interest (vendor, agent, mortgage lender, purchaser and government) benefit financially if the price is overstated.
In a similar vein it is claimed that the policy of publishing CEO salaries may drive salary inflation rather than inducing moderation in salary levels: “corporation(s) do not want to pay their candidate just the average but rather a salary that is in the 75th percentile” (Lansing, 2007).
The publication of grade information by colleges may facilitate grade inflation. Data were published by one institution about the grades achieved in different modules, to help potential employers. However, students responded by using the information to choose modules where it was easiest to obtain higher grades (Bar, Kadiyali, & Zussman, 2009).
These last two examples illustrate the problem that unwanted outcomes may arise even when the system is operating as intended. That is, when the data are accurate and well-understood, and when individuals react logically to the data. As an illustration, consider a “money saver” website which helps consumers locate cheap flights and discounted goods, which were previously difficult to find. Quickly, thousands of people learn about the website and use its advice to take advantage of online bargains. They have behaved rationally and are pleased to have saved money. However, because of the financial impact on the companies involved, they remove the discounts. Consequently there are fewer bargains around, so prices have effectively increased. This is an example of market forces in operation, facilitated by the web. But it does not lead to the expected benign outcome in the form of reduced prices.
In public procurement it is thought that competition is facilitated by the publication of information about open contracts and requirements. Many vendors may then tender for contracts, competing on price. It is hoped that “market forces” will ensure that value-for-money is obtained. This is similar to the idea of haggling, extended to cover the procurement of complex and expensive artefacts and services. Haggling can result in a lower prices; therefore (so the reasoning goes) it makes sense for the government to ask suppliers to bid against one another, and providing information is thought to be the best way to do this. But evidence suggests that transparency in government procurement can have negative as well as positive effects. One consequence which contributes to project failure is “winner’s curse”, where vendors are driven unwittingly to outbid each other to the point of bankruptcy (Jørgensen & Grimstad, 2005).
Transparency is also thought to inhibit corrupt activity. Again a simplistic model is used, but this time the metaphor is of the card game: if the players’ hands remain “above board” (on the table, where everybody can see what is happening) then “underhand” activity is impeded. It seems self-evident that transparent decision-making is preferable to decision-making behind closed doors. Yet it has been shown that, in various scenarios, transparency may increase opportunities for corruption. One example has been reported in connection with Olympic competitions, where transparency in judging procedures may have had “the perverse effect of facilitating collusion by insiders”, leading to illegal vote trading (Zitzewitz, 2010).
In each of the above cases, the provision of information leads to consequences that are unintended and undesirable. This demonstrates that, while transparency is no doubt beneficial in many cases, it is unsafe to assume it will always be beneficial (Hood & Heald, 2006). Instead, those wishing to publish should endeavour to understand more precisely how access to data produces particular outcomes. Although complex social systems tend to exhibit unexpected and counterintuitive behaviour, the behaviour is nonetheless capable of being understood if the systems are analysed in detail, and this can allow the impact of policies to be understood and predicted. By examining the causal relationships in each situation, better decisions may be facilitated about what to publish.
This paper is concerned with the outcomes of one particular type of transparency policy: publishing performance data. Information alters behaviour, and the behavioural change may not necessarily occur in intended or benign ways (Stan, 2007). It is beyond the scope of this paper to give a full account of the various ways in which publication of performance data may produce unwanted outcomes. But in the next section we look briefly at ways in which the behaviour of providers, the media and the public can be affected.
First we examine factors involved in the understanding of performance data, since everyone—provider, media or public—must interpret the data before being able to act on it. There is evidence that a substantial proportion of the public do not understand published performance data well (Bird, et al., 2005; Which?, 2007) and it is reasonable to assume that the same applies also to service providers and those in the media who report on performance data.
A well-known issue in dealing with data is information overload; if too much information is provided, some must be ignored. This is a problem in today’s information-rich environment, where people are bombarded every day with messages from myriad sources. Many are advertising messages which have been carefully (and expensively) crafted to capture attention and influence behaviour in subtle ways. It may be difficult for performance data to compete with other messages, particularly if presented in an unvarnished way (Heath, 2012).
When performance data are reported in the media, there is often a lack of context and explanation; these things do not typically make good copy. On their own, the “raw” data can easily be misinterpreted. Correct interpretation may rely on specialist (e.g. statistical) knowledge, which the average reader lacks (Davis, 2006). The absence of contextual information means that even raw performance data are not truly “raw”, since they have, embedded within them, various assumptions that the reader is unaware of. In the absence of this context, interpretation will inevitably be flawed.
The psychology of perception tells us that the human capacity for conscious attention is extremely limited. The brain uses strategies to limit the amount of processing required for the incoming flood of sensory perceptions. One strategy is simply to ignore or shut out information (selective perception). Confirmation bias is a similar type of effect, where the individual interprets new information in ways that support existing beliefs, thereby lessening the need for costly mental processing in order to reconcile conflicting ideas. The mind naturally directs attention towards information that can be interpreted automatically (unconsciously), since this is most easily processed. Numerical and textual data require conscious, analytical effort to interpret, which is costly in terms of cognitive resources. Graphs and images are easier to assimilate, because they rely on unconscious perceptual processes, and so their interpretation is effectively effortless (Whitehouse, 2000).
Performance league tables can be particularly misleading, because the mere position of a provider in a list is interpreted automatically and unconsciously (Goldstein & Spiegelhalter, 1996b). League tables ignore statistical uncertainty; “there may be no real difference between many of the units sequenced in the table—though this may not be obvious from the single-point estimates used” (Smith, 1995). A service provider’s position in a league table may well be a poor reflection of actual performance. Yet the unconscious interpretation of a league table is that the providers near the top are “good” and those further down are “bad”. Messages received unconsciously in this way are powerful and can drive action without the need for conscious reflection (Bargh & Morsella, 2008; Howell, 2002).
Emotion is very important in perception; it helps us attend to the most important aspects of our surroundings and to avoid the high cognitive cost of attending to unimportant details (Bradley, 2009). Sensationalist media reporting exploits this effect. Lurid coverage has a strong emotional impact and therefore captures the reader’s attention. Emotion strongly influences memory, and messages with emotional impact are remembered far better than neutral subject matter. This helps explain the snowballing effect of media coverage in relation to phenomena such as swine flu, BSE and knife crime. The more emotionally arousing a subject is, the more the observer overestimates its salience, and the more likely it is to be remembered (Fuller, 2010).
The mere fact that an issue has been reported in the media draws one’s attention to it, increasing its apparent salience. For example, news reports about crime figures generate a heightened sense of danger, regardless of actual risk (Callanan, 2012). Unfortunately, when performance statistics are reported in the media, coverage is likely to be biased towards evidence of poor performance, since this generates an emotional response in the reader and is therefore inherently “newsworthy”. This alone is likely to create imbalanced perceptions.
Individuals are susceptible to a range of other unconscious cognitive biases which affect the interpretation of data. For example, research into decision-making suggests that receiving additional information, which might be expected to improve decision-making, can increase confidence to an unwarranted degree and can thereby degrade the quality of decisions (Davis, Lohse, & Kottemann, 1994). Individuals may also suffer from anchoring bias, overestimating the importance of some aspect of a situation merely because it is foremost in their attention (Campbell, Sharpe, & System, 2007). They may construe data in self-serving ways, indulge in “motivated forgetting”, and so on (Anderson & Huddleston, 2012).
Reasoning is particularly subject to unconscious influence. Despite the longstanding tradition of reason as the gold standard in decision-making, research suggests that many or even all decisions are made unconsciously, in response to unconsciously-perceived factors (Haggard, 2009). Although we may feel that we make decisions consciously and rationally, the brain is adept at rationalisation, which provides plausible (but often inaccurate) explanations for decisions after they have been made. When people make decisions about subjects that matter to them, they use motivated reasoning, a form of conscious thought which seems logical and balanced but is, in reality, irrational. In motivated reasoning, different aspects of a situation may be given have undue weight according to their emotional resonance (Molden & Higgins, 2012).
The provision of performance data can affect the behaviour of all parties involved in the performance measurement cycle: service providers (and the organisations which oversee them), the media, and the public. One well-documented result of performance measurement is gaming: the provider responds to measurement not by improving performance but by strategically adjusting circumstances so that better performance figures are obtained. This practice has been aptly described as “hitting the target but missing the point”. Gaming has been addressed in depth by researchers, and many inventive examples have been reported (Bevan & Hood, 2006).
Publication raises the stakes for service providers, since it increases the probable impact of performance figures. The public are likely to interpret league tables in a naïve way, and providers know this. One result can be demotivation. For example, where schools are poorly-placed in school league tables, this can mean humiliation and demoralisation for children, parents and teachers—despite the fact that the differences in measured performance may be insignificant, the school’s scores may be affected by the socio-economic status of its pupils, which it cannot control, and there may be many instances of excellent practice within the school (Bandura, 1997; Gavrielatos, 2009; Visscher & Coe, 2003).
The news media also have a significant role in the performance management cycle. Many people get their information about performance data largely or exclusively through the media. Of course, those working in the media are just as susceptible to all of the potential distortions recounted above that may occur when performance data are interpreted. If they do not understand the data well, they cannot report them accurately. But media reporting is also subject to a range of other distortions. For example, it is selective and therefore can never present a full picture. Often, there is a focus on bad news, since this is newsworthy. If performance statistics appear to show evidence of poor results, the media are likely to preferentially report these in favour of other positive but less exciting results.
When performance data are published, a well-intentioned desire to provide balance and analysis can cause coverage to shift from the data to the presentation of alternative views and interpretations—which may be poorly informed. In addition, research has shown that media reporting is inherently slanted according to the expectations of the readership, particularly in low-feedback situations such as performance reporting (Gentzkow & Shapiro, 2005; Mullainathan & Shleifer, 2005). This means that people tend to receive the message they expect.
In summary, the message eventually received by the public about performance is likely to have been manipulated at source and distorted en route. It may be shorn of context and inherently misleading. The public are liable to misinterpret it, for all of the reasons listed in the preceding section. It is reasonable to assume that information affects behaviour. But the question is, how?
Firstly, there is evidence that the public are not particularly interested in using published performance data, preferring to obtain information informally through interpersonal relationships (Marshall et al., 2000; Meijer, 2009; Pidd, 2005; Sipkoff, 2007; Which?, 2007). Research shows that humans are strongly driven by the behaviour of others, regardless of whatever knowledge they may possess (Cialdini, 2001). This “social proof” leads to herd behaviour. When the amount of information about options increases, it may “exceed the individual’s cognitive capacity and conformity—choosing the most popular item—becomes more likely” (Sasaki et al., 2011).
Where members of the public are prepared to consult and use performance data, and react en masse to information received, the “invisible hand” is at work. Results suggest that the presence of information affects patterns of consumer activity, giving rise to “information cascades” (Bikhchandani, Hirshleifer, & Welch, 1992). “Individuals can respond actively to media and in ways that appear to be in their own best interests but, collectively, the results can be both self-defeating and on a mass scale” (Davis, 2006). For example, in financial markets, the lack of confidence in a particular stock may lead to selling behaviour, which causes the stock price to drop, triggering more selling and further price drops. Media reporting of knife crime statistics is thought to be behind an “arms race” in which youths increasingly feel the need to carry knives because of a greater perceived need for protection (McNally, 2009).
The anticipated behavioural impact of performance data publication is consumer choice. League tables offer the prospect of “shopping around”, picking the provider which offers the best performance. Yet this prospect may be illusory, particularly in the case of large, location-dependent public services such as hospitals and schools (Bosker & Scheerens, 2000). In practice, and for a variety of reasons, many service consumers have little real choice about where to receive medical treatment or which schools to send their children to.
Where true choice exists, its use may not be uniformly distributed. Gurstein’s (2003) notion of “effective use” is relevant here; uneven public take-up reduces the value of published data and this “skewness” has the potential to produce unintended effects (Davies, 2010; Gurstein, 2010). For example, in the case of school league tables, evidence suggests that middle-class parents make most use the data provided (Visscher et al., 2000). If these parents misinterpret the tables in the expected ways, it is likely that they will oversubscribe to the “best” schools in any district, leaving the “worst” schools for the children of working-class parents. Since academic achievement is strongly associated with socio-economic status, this could lead to increasing polarisation between high-performing “best” schools and poorly-performing “worst” schools. In other words, an accident of league table ranking becomes a self-fulfilling prophecy. There is circumstantial evidence for this phenomenon. It has been observed in the UK that house prices are inflated around schools with better performance scores. According to one report, a 10% rise in the number of 11-year-olds attaining the expected level in tests adds 3.3% (£5,860) to average house prices (Montia, 2009).
The rationale for publishing performance league tables is that informed service consumers can make better choices, and that this will drive up the performance of service providers. But performance data are selective, and they may be inaccurate and misleading. League tables imply performance differences even when none exist and they invite misinterpretation. Service consumers may misinterpret data, ignore it, overreact to it, or react in irrational ways. In short, the “current official support for output league tables, even adjusted, is misplaced” (Goldstein & Spiegelhalter, 1996a).
|
Who |
Stage (see Figure 3) |
Potential effects |
Risks |
|
Service provider |
(a) Provide service |
See (e) |
|
|
(b) Model service |
Inaccuracies when service provision is conceptualised |
|
|
|
(c) Choose measures |
Inaccuracies/ omissions when measures are chosen |
|
|
|
(d) Measure performance |
Inaccuracies/ omissions when performance is measured |
|
|
|
(e) Alter behaviour |
Perverse alteration to the way the service is provided |
|
|
|
(f) Prepare statistics |
Inaccuracies/bias when statistics are prepared |
|
|
|
Media |
(g) Report on statistics |
Selective/biased/ incorrect reporting by media |
|
|
Public |
(h) Interpret statistics |
Misunderstanding/ biased interpretation/ selective uptake by public |
|
|
(i) Alter behaviour |
Inappropriate behavioural change by public |
|
|
|
(j) Consume service |
See (i) |
|
Table 1: Potential unanticipated effects of publishing performance data
The morale of service providers may be damaged. Overseeing organisations may misinterpret data and intervene unnecessarily. The media will inevitably—intentionally or unintentionally—distort the message, helping to produce a reaction that is misaligned with actual performance, particularly when the relevance or importance of the tables are emphasised by government and media commentators. Conscious of the impact of public opinion, and unable to control factors which influence their measured performance, service providers may alter their behaviour to game the system, without necessarily improving performance—even when doing so may be damaging to the services they provide. Table summarises the many unanticipated effects which are possible.
The publication of government performance data is conventionally considered to be beneficial. “Formulated in terms of ‘access to information,’ transparency policies claim (that) numbers are best for making visible the workings of public services systems” (Stan, 2007). It is reasonable to claim that information is beneficial, when it is in short supply. But it can be argued that untrammelled transparency is not necessarily benign (Bannister & Connolly, 2011; Hood & Heald, 2006). “The information age truism that knowledge is power does not seamlessly scale into ‘more knowledge is more power’ … an honest, unvarnished view of how individuals and institutions actually behave in information-rich environments—as opposed to how we might like them to behave—does not assure that greater quantities of data will lead to better-quality results” (Schrage, 2003).
Decisions about social policies, taken naively, have the potential to lead to untold outcomes. When unwanted situations occur, in society or in other spheres, it may be tempting to try to fix them without a clear understanding of how they arise. In the case of public services, the unwanted situation is a perception of poor quality, and the fix may involve performance measurement and “naming and shaming”. Yet the mechanisms by which this fix might generate improvement are often unclear. The evidence is that, in general, it cannot be assumed that desired result will be obtained.
The system of measurement and publication of performance data includes service providers, the media and service consumers. It is, in effect, a large and complex information system with global reach. With the Internet, information systems have the potential for widespread and far-reaching public impact (Adab, et al., 2002). Combining this unprecedented reach with performance management is an experiment which could invite large-scale perverse consequences with concomitant social and financial cost.
It is tempting in this research to offer solutions designed to make the publication of performance data “work” more reliably. But each performance measurement situation has its own dynamics, and so any solutions are likely to be situation-dependent. For example, the dominant factors leading to perverse outcomes when school league tables are published are not necessarily the same as those which influence outcomes when hospital statistics are published. This makes it necessary to investigate each specific situation, to determine how and why the provision of particular types of performance data can cause particular consequences. Armed with this understanding, we may be able to find ways of avoiding less desirable consequences through interventions designed to suit specific situations.
It could be that the technological imperative is rendering this advice moot, however. In recent years the vision of an idealised, global “infosphere” has emerged, inspired by the power of the internet to disseminate information quickly and easily. This view foresees a democratic scenario similar to the economist’s ideal of “perfect information”, where everyone benefits from equal and unfettered access to data on a range of topics. The Semantic Web, with its vision of linked open data, is one manifestation (Berners-Lee, et al., 2001). It envisages that easy interchange of data will be beneficial to all, because it will lead to a kind of equilibrium in which the public and organisations are equally empowered to act on data. The result will presumably be “market forces” that tend to improve economic and social outcomes. It is beyond the scope of this paper to debate the feasibility of this vision, but suffice to say that it rests on some untested assumptions. From the evidence summarised in this paper, it is also conceivable that free movement of open data could instead decrease stability, leading to chaotic behaviour in the global infosphere with unintended, undesirable outcomes (Hsieh, 1991).
Research is needed to find ways of predicting the effects when performance data are published on a mass scale, to explore the emergence of both intended and unintended outcomes. It is not sufficient to assume that intended, benign outcomes will (or do) emerge when data are published. One research goal could be to identify patterns in behaviour that occur in different situations, which might allow generalisation about the effects of publishing data. We are testing the use of System Dynamics for this purpose, simulating the effects of performance data publication on behaviour in domains such as education and healthcare. Given that many of the behavioural consequences seem to stem from issues of perception and interpretation, another useful approach would be to explore alternatives to the exclusive use of numerical performance data that may moderate some of their negative effects. These include the use of “soft” information to complement “hard” statistics, sampling, and alternative visual representations such as control charts (Adab, et al., 2002; Bird, et al., 2005).
More generally, we are interested in the effects of information on “crowd” behaviour. Information has hitherto been considered innately benign, for the most part. But now that mass dissemination of information is cheap, quick and easy, it may be than a more finely-graduated theory is needed to explain the effects when information is disseminated to a wide audience. Again, simulation is one possible method of enquiry, coupled with appropriate theoretical analysis to identify the variables and causal relationships underlying so-called invisible hand or “market forces” mechanisms.
Adab, P., Rouse, A. M., Mohammed, M. A., & Marshall, T. (2002). Performance league tables: the NHS deserves better. BMJ, 324(7329), 95-98. doi: 10.1136/bmj.324.7329.95
Anderson, M. C., & Huddleston, E. (2012). Towards a cognitive and neurobiological model of motivated forgetting. True and False Recovered Memories, 53-120.
Aydinonat, N. E. (2008). The invisible hand in economics: how economists explain unintended social consequences (Vol. 10): Psychology Press.
Bandura, A. (1997). Self-Efficacy: the Exercise of Control. New York: WH Freeman.
Bannister, F., & Connolly, R. (2011). The Trouble with Transparency: A Critical Review of Openness in e-Government. Policy & Internet, 3(1), 8.
Bar, T., Kadiyali, V., & Zussman, A. (2009). Grade information and grade inflation: The cornell experiment. The Journal of Economic Perspectives, 23(3), 93-108.
Bargh, J. A., & Morsella, E. (2008). The unconscious mind. Perspectives on psychological science, 3(1), 73-79.
Barlas, Y. (2009). System dynamics : systemic feedback modeling for policy analysis: Eolss Publishers Co Ltd.
Berman, E. (2002). How useful is performance measurement. Public Performance & Management Review, 25(4), 348-351.
Berners-Lee, T., Hendler, J., & Lassila, O. (2001). The Semantic Web. Scientific American, 284(5), 28-37.
Bevan, G., & Hood, C. (2006). What’s measured is what matters: targets and gaming in the English public health care system. Public Administration, 84(3), 517-538.
Bikhchandani, S., Hirshleifer, D., & Welch, I. (1992). A theory of fads, fashion, custom, and cultural change as informational cascades. Journal of political Economy, 992-1026.
Bird, S. M., Cox, D., Farewell, V. T., Goldstein, H., Holt, T., & Smith, P. C. (2005). Performance indicators: good, bad, and ugly. Journal of the Royal Statistical Society: Series A (Statistics in Society), 168(1), 1-27.
Bosker, R. J., & Scheerens, J. (2000). Publishing school performance data. European Education, 32(3), 12-30.
Bradley, M. M. (2009). Natural selective attention: Orienting and emotion. Psychophysiology, 46(1), 1-11.
Brown, A. (2005). Implementing performance management in England's primary schools. International Journal of Productivity and Performance Management, 54(5/6), 468-481.
Brown, R. (2006). Unintended consequences of transparency Retrieved August 13, 2011, from http://gendal.blogspot.com/2006/04/unintended-consequences-of.html
Callanan, V. J. (2012). Media Consumption, Perceptions of Crime Risk and Fear of Crime: Examining Race/Ethnic Differences. Sociological Perspectives, 55(1), 93-115.
Campbell, E. M., Sittig, D. F., Ash, J. S., Guappone, K. P., & Dykstra, R. H. (2006). Types of unintended consequences related to computerized provider order entry. Journal of the American Medical Informatics Association, 13(5), 547-556.
Campbell, S. D., Sharpe, S. A., & System, B. o. G. o. t. F. R. (2007). Anchoring bias in consensus forecasts and its effect on market prices: Divisions of Research & Statistics and Monetary Affairs, Federal Reserve Board.
Cavana, R. Y., & Mares, E. D. (2004). Integrating critical thinking and systems thinking: from premises to causal loops. System Dynamics Review, 20(3), 223-235.
Cialdini, R. B. (2001). Influence: Science and practice: Allyn and Bacon Needham Heights, MA.
data.gov. (2012). Federal Agency Participation - Data.gov, January 18, 2012, from http://www.data.gov/metric
data.gov.au. (2012). Data Retrieved May 2, 2012, from http://data.gov.au/data/
data.gov.uk. (2012). Data Retrieved January 18, 2012, from http://data.gov.uk/data
Davies, H., & Lampel, J. (1998). Trust in performance indicators? Quality in Health Care, 7(3), 159.
Davies, H., Mannion, R., Goddard, M., & Smith, P. C. (2000). How Health Care Providers Use Comparative Outcomes Data to Monitor and Improve Care: A Cross-National Study. Paper presented at the Academy for Health Services Research and Health Policy Meeting.
Davies, T. (2010). Open data, democracy and public sector reform. A look at open government data use from data.gov.uk: practicalparticipation.co.uk.
Davis, A. (2006). Media effects and the question of the rational audience: lessons from the financial markets. Media, Culture & Society, 28(4), 603.
Davis, F. D., Lohse, G. L., & Kottemann, J. E. (1994). Harmful effects of seemingly helpful information on forecasts of stock earnings. Journal of economic psychology, 15(2), 253-267.
Deming, W. E. (1986). Out of the Crisis: The MIT Press.
Duru-Bellat, M. (2009). About qualification inflation. Paper presented at the "17th annual workshop of the European Research Network on Transitions in Youth : "Youth transitions at risk? Insecurity, precarity and educational mismatch in the youth labour market", Dijon, France.
Forester, T. (1993). Silicon Samurai: How Japan conquered the world's IT industry: Blackwell Business.
Forrester, J. W. (1971). Counterintuitive behavior of social systems. Theory and Decision, 2(2), 109-140.
Forrester, J. W. (1987). Nonlinearity in high-order models of social systems. European Journal of Operational Research, 30(2), 104-109. doi: Doi: 10.1016/0377-2217(87)90086-5
Fuller, J. (2010). What is happening to news? Dædalus, 139(2), 110-118.
Gavrielatos, A. (2009, November 23). League tables don't tell a school's whole story, Sydney Morning Herald. Retrieved from http://www.smh.com.au/opinion/politics/league-tables-dont-tell-a-schools-whole-story-20091123-it23.html
Gentzkow, M., & Shapiro, J. M. (2005). Media bias and reputation: National Bureau of Economic Research Cambridge, Mass., USA.
Gillon, S. M. (2000). That's not what we meant to do: Reform and its unintended consequences in twentieth-century America: WW Norton.
Goddard, M., & Mannion, R. (2004). The role of horizontal and vertical approaches to performance measurement and improvement in the UK Public Sector. Public Performance & Management Review, 28(1), 75-95.
Goddard, M., Mannion, R., & Smith, P. (1998). The NHS performance framework: taking account of economic behaviour. Aug: Centre for Health Economics, University of York.
Goddard, M., Mannion, R., & Smith, P. (2004). Enhancing performance in health care: a theoretical perspective on agency and the role of information Studying the organisation and delivery of health services: a reader (Vol. 9, pp. 199): Psychology Press.
Goldstein, H., & Spiegelhalter, D. (1996a). League tables and their limitations: statistical issues in comparisons of institutional performance. Journal of the Royal Statistical Society. Series A (Statistics in Society), 159(3), 385-443.
Goldstein, H., & Spiegelhalter, D. J. (1996b). League tables and their limitations: statistical issues in comparisons of institutional performance. Journal of the Royal Statistical Society. Series A (Statistics in Society), 385-443.
Goldstein, H., & Spiegelhalter, D. J. (1996c). League Tables and Their Limitations: Statistical Issues in Comparisons of Institutional Performance. Journal of the Royal Statistical Society. Series A (Statistics in Society), 159(3), 385-443.
Gurstein, M. (2003). Effective use: A community informatics strategy beyond the digital divide. First Monday, 8(12).
Gurstein, M. (2010). Open Data: Empowering the Empowered or Effective Data Use for Everyone? Retrieved March 24, 2012, from http://gurstein.wordpress.com/2010/09/02/open-data-empowering-the-empowered-or-effective-data-use-for-everyone/
Haggard, P. (2009). The sources of human volition. Science, 324(5928), 731-733.
Heath, R. (2012). Seducing the Subconscious: The Psychology of Emotional Influence in Advertising: Wiley.
Herrmann, A., Fox, R., & Boyd, A. (2000). Unintended effects in using learning technologies. New Directions for Adult and Continuing Education, 2000(88), 39-48.
Higgins, J. P. T., & Green, S. (Eds.). (2008). Cochrane Handbook for Systematic Reviews of Interventions (Vol. 5): Wiley Online Library.
Hodgson, L., Farrell, C. M., & Connolly, M. (2007). Improving UK public services: a review of the evidence. Public Administration, 85(2), 355-382.
Hogge, B. (2010). Open data study: Transparency and Accountability Initiative.
Hood, C., & Heald, D. (2006). Transparency: the key to better governance? : Oxford University Press.
Hovmand, P. S., Ford, D. N., Flom, I., & Kyriakakis, S. (2009). Victims arrested for domestic violence: unintended consequences of arrest policies. System Dynamics Review, 25(3), 161-181.
Howell, J. (2002). Performance league tables: League tables are unreasonably simple. BMJ: British Medical Journal, 324(7336), 542.
Hsieh, D. A. (1991). Chaos and nonlinear dynamics: application to financial markets. Journal of Finance, 1839-1877.
Jacobs, R., Goddard, M., & Smith, P. C. (2005). How robust are hospital ranks based on composite performance measures? Medical care, 43(12), 1177.
Jacobs, R., Martin, S., Goddard, M., Gravelle, H., & Smith, P. (2006). Exploring the determinants of NHS performance ratings: lessons for performance assessment systems. Journal of Health Services Research & Policy, 11(4), 211.
Jørgensen, M., & Grimstad, S. (2005). Over-optimism in Software Development Projects: “The Winner’s Curse”. Proceedings of IEEE ConieleComp, 280–285.
Kaplan, R. S., & Norton, D. P. (1993). The balanced scorecard-Measures That Drive Performance; Putting the balance scorecard to work. Harvard business review.
Kluger, A. N., & DeNisi, A. (1996). The effects of feedback interventions on performance: A historical review, a meta-analysis, and a preliminary feedback intervention theory. Psychological bulletin, 119(2), 254.
Lansing, P. (2007). The causes and consequences of the global inflation of CEO salaries. International Journal of Management, 24(1), 70.
Leet. (2009). In a crisis, knowledge is not power Retrieved September 19, 2011, from http://www.abc.net.au/news/2009-06-03/in-a-crisis-knowledge-is-not-power/1702170
Mannion, R., & Goddard, M. (2003). Public disclosure of comparative clinical performance data: lessons from the Scottish experience. Journal of Evaluation in Clinical Practice, 9(2), 277-286.
Margetts, H., & Hood, C. (2010). Paradoxes of modernization: unintended consequences of public policy reform: Oxford Univ Pr.
Marshall, M. N., Shekelle, P. G., Leatherman, S., & Brook, R. H. (2000). The public release of performance data: what do we expect to gain? A review of the evidence. JAMA: the journal of the American Medical Association, 283(14), 1866.
McGinnes, S. (2011). Benefits and Barriers: Applying e-Learning in the Context of Organisational Change to Improve the Learning Experience for Mature, Part-Time Students. In S. Greener (Ed.), 10th European Conference on e-Learning ECEL2011. University of Brighton, UK: Academic Publishing International.
McNally, P. (2009). MPs concerned by 'sensationalist' knife crime reporting Retrieved September 20, 2011, from http://www.pressgazette.co.uk/story.asp?storycode=43724
Meijer, A. (2009). Does Transparency Lead to Better Education? The Effects in the Netherlands of Publishing School Performance Indicators on the Internet. In A. Meijer, K. Boersma & P. Wagenaar (Eds.), ICTs, Citizens and Governance: After the Hype (pp. 38–49). Amsterdam: IOS Press.
Merton, R. K. (1936). The Unanticipated Consequences of Purposive Social Action. American Sociological Review, 1(6), 894-904.
Micheli, P., & Neely, A. (2010). Performance Measurement in the Public Sector in England: Searching for the Golden Thread. Public Administration Review, 70(4), 591-600.
Minsky, H. (1992). The financial instability hypothesis. The Jerome Levy Economics Institute Working Paper No. 74.
Molden, D. C., & Higgins, E. T. (2012). 20 Motivated Thinking. The Oxford Handbook of Thinking and Reasoning, 390.
Montia, G. (2009). Primary school league tables dictate property prices Retrieved September 20, 2011, from http://www.financemarkets.co.uk/2009/11/23/primary-school-sats-dictate-property-prices/
Mullainathan, S., & Shleifer, A. (2005). The market for news. The American Economic Review, 95(4), 1031-1053.
Pawson, R., Greenhalgh, T., Harvey, G., & Walshe, K. (2005). Realist review–a new method of systematic review designed for complex policy interventions. Journal of Health Services Research & Policy, 10(suppl 1), 21-34.
Pfeffer, J., & Sutton, R. I. (2006). Evidence-based management. Harvard business review, 84(1), 62.
Pidd, M. (2005). Understanding perverse effects of public sector performance measurement. . Lancaster University Management School Working Paper.
Propper, C., Sutton, M., Whitnall, C., & Windmeijer, F. (2008). Did ‘Targets and Terror’reduce waiting times in England for hospital care. Berkeley Electronic Journal of Economic Analysis and Policy, 8, 1863.
Rockart, J. F. (1979). Chief executives define their own data needs. Harvard business review, 57(2), 81.
Sasaki, T., Becker, D. V., Janssen, M. A., & Neel, R. (2011). Does Greater Product Information Actually Inform Consumer Decisions? The Relationship between Product Information Quantity and Diversity of Consumer Decisions. Journal of economic psychology.
Schrage, M. (2003). Perfect Information and Perverse Incentives: Costs and Consequences of Transformation and Transparency (Security Studies Program (SSP) Working Paper: MIT Center for International Studies.
Sipkoff, M. (2007). Go Carefully When Measuring Quality. Managed Care, 16(9/September 2007), 25-26, 28, 31.
Smith, A. (1759). The Theory of Moral Sentiments. London: A. Miller.
Smith, P. (1990). The Use of Performance Indicators in the Public Sector. Journal of the Royal Statistical Society. Series A (Statistics in Society), 153(1), 53-72.
Smith, P. (1995). On the unintended consequences of publishing performance data in the public sector. International journal of public administration, 18(2), 277-310.
Stan, S. (2007). Transparency: Seeing, counting and experiencing the system. Anthropologica, 257-273.
Strand, S. (1997). Key Performance Indicators for Primary School Improvement. Educational Management Administration & Leadership, 25(2), 145-153. doi: 10.1177/0263211x97252004
TBCS. (2012). Open Data Pilot Project Retrieved January 18, 2012, from http://www.data.gc.ca
Tenner, E. (1997). Why things bite back: Technology and the revenge of unintended consequences: Fourth Estate Ltd.
UK Government. (2011). Making Open Data Real: A Public Consultation Retrieved September 14, 2011, from http://data.gov.uk/opendataconsultation
Van Thiel, S., & Leeuw, F. L. (2002). The performance paradox in the public sector. Public Performance & Management Review, 267-281.
Visscher, A., Karsten, S., De Jong, T., & Bosker, R. (2000). Evidence on the Intended and Unintended Effects of Publishing School Performance Indicators. Evaluation and Research in Education, 14(n3&4), 254-267.
Visscher, A. J., & Coe, R. (2003). School performance feedback systems: conceptualisation, analysis, and reflection. School effectiveness and school improvement., 14(3), 321-349.
Von Bertalanffy, L. (1950). An outline of general system theory. British Journal for the Philosophy of Science, 1(2), 134-165.
Vulliamy, G., & Webb, R. (2001). The social construction of school exclusion rates: implications for evaluation methodology. Educational Studies, 27(3), 357-370.
Wagner, A. (1999). Causality in complex systems. Biology and Philosophy, 14(1), 83-101.
Wankhade, P. (2011). Performance measurement and the UK emergency ambulance service: Unintended consequences of the ambulance response time targets. International Journal of Public Sector Management, 24(5), 384-402.
Werner, R. M., & Asch, D. A. (2005). The unintended consequences of publicly reporting quality information. JAMA: the journal of the American Medical Association, 293(10), 1239.
Which? (2007). Health Check exposes continued ‘disgraceful’ failings Retrieved 12th August 2011, from http://www.which.co.uk/about-which/press/press-releases/campaign-press-releases/food-and-health/2007/10/health-check-exposes-continued-disgraceful-failings/
Whitehouse, R. (2000). The uniqueness of individual perception. In R. Jacobson (Ed.), Information Design (pp. 103-129). Cambridge, MA: MIT Press.
Whitlock, S. (2008). ABC Talks Up Non-Existent 'Recession' Eight Times in Three Days Retrieved September 19, 2011, from http://newsbusters.org/blogs/scott-whitlock/2008/06/25/abc-talks-non-existent-recession-eight-times-three-days
Zitzewitz, E. (2010). Does Transparency Really Increase Corruption? Evidence from the 'Reform' of Figure Skating Judging Retrieved May 2, 2012, from http://www.dartmouth.edu/~ericz/transparency.pdf