Visualizing Qualitative Spatial Data to Understand Social Epidemiology in Public Health
Introduction
This research focuses on the application and conceptualization of on form New Spatial Media (NSM) (Crampton 2010). Drawing on ideas from participatory mapping (Ghose and Huxhold 2001; Ghose 2003; Elwood 2006; Sieber 2006; Goodchild 2007) and its related sub-fields, this work describes a new web delivered spatial framework, both in technical design and in a discussion of the implementation with public participants. Building on the connections that exist between health and place, this paper will look to connect two distinct literatures, that of qualitative and participatory GIS, and health geography to produce a new model to collect both narratives and explicit locations from participants in order to characterize the complexities of peoples' understandings and interactions with place. By coupling with commonly used tools such as deprivation scores, the capture of qualitative data through a New Spatial Media (NSM) portal can complement and refine the place-based understandings of the public health officials and researchers. Ultimately, the research builds on the linkages created between these bodies of literature to create a system to capture the context of deprivation and to build and test the potential for New Spatial Media in order to contribute to a transdisciplinary body of knowledge.
To accomplish these objectives, this study describes the development of one implementation of NSM. This development includes not only the design of the system, but a small case study to demonstrate the potential to capture data about place, social equity-- inequities around access to resources--and public health. This paper begins by evaluating literature from social epidemiology and geography about health and place-based research as well as a brief discussion of the background of participatory mapping that underpins the NSM development. Following the literature review, a technical description of the design of the new spatial media system will be provided. Following the technical framework, a description of the implementation of the system along with discussion of some of the findings obtained through a limited case study where the system was deployed is presented. Finally, a brief discussion of the transdisciplinary potential of the NSM system and the conclusions of this research path will be briefly touched upon.
Connecting Health and Place
The connection of health and geographic location has foundations in the ideas postulated by Snow in the 1800's that geography and society have a role in disease. In particular, the literature emanating from the field of social epidemiology is pertinent. Probably the leading proponent of this set of ideas within epidemiology is Nancy Krieger of Harvard University. Krieger's work on geo-coding health disparities has been invaluable in epidemiology (Krieger, Waterman et al. 2002; Krieger, Waterman et al. 2002; Krieger, Chen et al. 2003; Krieger, Chen et al. 2003; Krieger, Chen et al. 2005; Krieger 2009). Combining area-based socioeconomic measures (ABSMs) to better understand the societal impacts of disease, Krieger's Public Health Disparities Geo-coding Project, has identified ABSMs that are useful predictors of health outcomes, and has demonstrated the potential of geo-referenced data to better understand and evaluate epidemiologic phenomena (Krieger 2009). However, despite Krieger's successful adoption of geo-coding and GIS, her work has remained firmly in the domain of quantitative analysis, neglecting to realize the potential of incorporating qualitative place-based information to further the understanding of the social framework contributing to the question at hand.
Despite these criticisms, Kreiger's work is innovative because she explicitly focuses on understanding geography to aid epidemiology while at the same time staying aware of the potential and the pitfalls surrounding the use of GIS (Geographic Information Systems) in these analyses (Krieger, Waterman et al. 2002; Krieger, Chen et al. 2003; Krieger, Chen et al. 2005; Krieger 2009). Others in social epidemiology highlight the need to incorporate non-traditional data. 'MacIntyre and Ellaway' are a prime example of this. They highlight factors that might influence health (employment, education, transportation, housing, retail, recreation, "incivilities", policing, land use, health services, environmental hazards, social networks and social cohesion, cultural norms and values, geology, climate) (Macintyre and Ellaway 2003). They also describe environments that contain both health promoting and health detracting components - 1. Physical features of the environment shared by all residents. 2. Availability of healthy environments at home, work and play. 3. Services provided to support people in their daily lives. 4. Sociocultural features of a locality (including degree of community integration). 5. Reputation of an area (perception by residents, service or amenity planners, and investors). Furthermore, questions about whether the poor health of people living in deprived areas is due to the genetic characteristics of the residents or a result of features of the local environment are asked. In this literature, it is postulated that people with more educational and financial resources may range over wider territories for a number of activities (i.e. recreation, employment, educations, retail) than do people with a more local orientation or less money. Yet, throughout their work they do not specifically address space and place. Rather, they leave these as unspoken concepts contained within small area aggregated data.
As social epidemiology has focused on the spatial inequity of the landscape, numerous relationships between geography and health have been articulated. Patricia O'Campo and her colleagues (O'Campo, Xue et al. 1997) found that per capita crime is positively correlated with low maternal education and low birth weight. Additionally, low wealth and high unemployment are negatively correlated with prenatal care access. O'Campo also posits that poor birth outcomes are more prevalent in areas with a high degree of social integration and low informal social control. In other words, people or groups with strong internal social links but wider social isolation have worse health outcomes. This relationship between social isolation and internal social cohesion has been found to have a negative affect on health by others as well (Shaw, Dorling et al. 1998; Stansfeld 1998) and is informative to the research attempting to conceptualize how to spatially capture social isolation on a map.
Geographic correlations between crime and poor birth outcomes is also highlighted by Sampson (2003). Sampson's work found that more than 75% of tracts with high homicide rates also contained a high level of clustering for low birth weight and infant mortality. These connections indicates geographic "hot spots" that are likely to exist for a number of unhealthy outcomes beyond just poor birth outcomes (Sampson 2003). Sampson postulated that low social capital (trust, reciprocity and voluntary associations) equates to greater risk of poor self-rated health. Sampson argues that the challenge is to integrate multilevel methods from epidemiology with complex spatial processes (e.g. spatial relationship between crime and health), articulating the need for multilevel methods for contextually based research. Both Sampson and O'Campo et al make a clear case for the social drivers of birth outcomes. However the lack of qualitative context is notable and is an area where geographically framed qualitative data can be useful to further develop the context in which these outcomes exist, and therefore, as this study proposes, allow researchers to construct a more robust frame of study to capture the drivers of a shifting infant mortality rate.
Social epidemiologic research has also spent considerable resources characterizing deprivation at small areal units (Kirby, Coyle et al. 2001; Sampson 2003; Martens, Derksen et al. 2004; Messer, Laraia et al. 2006). Sampson states that deprivation appears to be adequately assessed by personal and household circumstances (i.e. household income or household "family" structure). Area-based measures of deprivation are not optimal substitutes, though they are often an accessible means to understand the social makeup of small areas. To improve on area-based measures, health policy needs to target people as well as places (1473-74) - essentially making the case for qualitative data in addition to the aggregated quantitative place-based data. Prominent examples of deprivation indices include Messer et al, the Scottish Index of Multiple Deprivation (SIMD), Krieger (2003), Kirby et al 2001 and Marten's et al 2004. In all of these cases relevant census data served as the main driver, though by basing an index on national census characteristics the potential for replication may be limited to the country of origin - a good example being the SIMD. Each of these indices is limited to the areal unit, with extensions to the personal level lacking and requiring further development. Supplementing areal-based measures with local qualitative data can provide a deeper understanding of the social context of both place and conditions. One way to make this leap is through developments in participatory forms of cartography and geographic information.
The Roots of Participatory Mapping
Participatory mapping is a methodology that can aid in understanding the lived landscape from the perspectives of the residents (Al-Kodmany 2000; Ghose 2003; Elwood 2006). In particular, participatory mapping can provide new insights into the landscapes of health in a location. Participatory mapping is a precursor to the idea of new spatial media postulated in this paper, which is the culmination of years of effort to democratize mapping for a larger public. While these research efforts have been largely present following an important meeting of GIS practitioners and social theorists at the Friday Harbor WA conference in 1992 (Sheppard 1995), it might be argued that this effort rather began in the late 1960's with the work of Bill Bunge and the Detroit Geographical Expedition and Institute (DGEI) (Horvath 1971).
Through the DGEI, Bunge sought to not only provide his students the tools to map their community, but also to arm them with the knowledge necessary to explain the representation being constructed. Criticisms of Bunge's work are similar to those that can be leveled against much of the PPGIS (Public Participation Geographic Information Systems) literature - a high technical barrier to entry, limited community engagement (in numbers) and limited longevity beyond the researcher's presence (though in this case due to job loss rather than disinterest). Current PPGIS efforts are aided considerably through the use of desktop GIS and more recently through web mapping technologies. At the same time, the low tech methods of Bunge's day also created accessibilities that PPGIS efforts have struggled to replicate. Scribes and paper are easier to come by than computers with the requisite components to effectively run a GIS. The technological barrier to entry in the DGEI model is quite low - and to date, has not been replicated in the PPGIS literature.
By building on the recent ideas of New Media, this current work attempts to return to Bunge's vision of participatory mapping, with an explicit focus on mapping aspects of context around health and place through the construction of an online new spatial media mapping system.
The Development of New Spatial Media
Another area that is brought to bear on the proposed New Spatial Media is work in qualitative GIS. Both Kwan and Ding (2008), Jung (2009) and Jung and Elwood (2010) have described work that relates most closely with the system created here-geographic systems that connect qualitative representations with spatial data capture and analysis . Kwan and Ding's "geo-narrative" is connected to Matthew's et al (2005) and Hagerstrand's (1970) time geography by linking time and space in a GIS framework to understand the qualitative landscape of lived experience. Specifically, Kwan and Ding focus on the qualitative method of narrative analysis - a mode of study which analyzes the stories of people's lived experiences around a major event at a specific point in time (Clandinin and Connelly 2000; Chase 2005). Building off the ideas of visual methodologies from Gillian Rose (2001), Kwan and Ding developed a plug-in for ArcGIS (ESRI, 2011) that facilitates the visual interrogation of narratives. Using a space-time coding scheme, events from the narrative were coded for both location and time. Once coded, a 3-D space-time diagram was constructed allowing for visualization of the lived experience and the interpretation of that experience by the researcher. Ultimately Kwan and Ding's work is an extension of previous work by Kwan (2000) merging the ideas of space-time paths and qualitative analysis in GIS.
Jung (2009) and Jung and Elwood (2010) take a slightly different approach to the problem of incorporating qualitative data into a spatial framework. Jung and Elwood build links between traditional CAQDAS (Computer Aided Qualitative Data Analysis Software) and GIS, rather than building new modules within a GIS to support qualitative data (Matthews et al 2005, Kwan and Ding 2008). While Jung and Elwood's work (Jung 2009, Jung and Elwood 2010) demonstrates a powerful means of integrating off-the-shelf GIS and qualitative analysis software, the barrier to entry is still quite high. By using commercial GIS and CAQDAS software packages, the tools don't ameliorate the steep learning curves that can be prohibitive to quick and simple analysis of qualitative spatial data and to non-expert users who don't have the expertise to adopt these technologies for their analytical aims. By removing the expert context surrounding these packages the bar to entry is reduced and users are able to quickly visualize and analyze their datasets without the cumbersome loading of large software packages. The consequence is obviously that the magnitude of analytical capabilities is far reduced, but maintaining all of the qualitative spatial data in a spatially enabled database allows a migration to a more sophisticated suite of analysis software that can provide the desired analytical packages.
Ultimately, however, Crampton's (2010) idea of New Spatial Media appears to present a framework that best fits this overarching lineage and diversity of applications. Devoid of a formalized definition, New Spatial Media corresponds to the broad definition of Geoweb - an idea of Web 2.0 as a diverse and ultimately participatory (started and contributed) framework for the construction and use of spatial information. Crampton's description of New Spatial Media encompasses Volunteered Geographic Information, neo-geography (Turner 2006), and DigiPlace (Zook and Graham 2007)-all current forms of internet-based map and data coalescence. However, all of these labels have too narrowly defined their territory to be properly situated as an overarching descriptor for this phenomena. NSM does not suffer a limiting definition because it is without prior definition. Crampton has coined the term and yet he has made no attempt to provide the idea with a formal definition. Without a strict definition, the space can be freely navigated, keeping in mind that any NSM framework should posses some basic characteristics: 1) It should be people-powered, 2) it should be open to many or all people, 3) it should reside either on the web, through mobile devices or both. NSM offers the potential to return the entire field of participatory GIS to the open and accessible ideas that Bunge first used in with his colleagues in the DGEI.
The combination of ideas from Bunge and participatory mapping and Crampton's concept of New Spatial Media have driven the development of a new system to capture qualitative geographies - specifically to understand health and place through digital methods.
An Implementation of New Spatial Media
New Spatial Media, as conceived below, involves designing and building a framework for collecting, consuming, visualizing and analyzing qualitative spatial data that can in turn be implemented using new spatial media technologies. This paper will focus on the collection and consumption of data in a partnership between public health and the public at large, especially low income and minority residents.
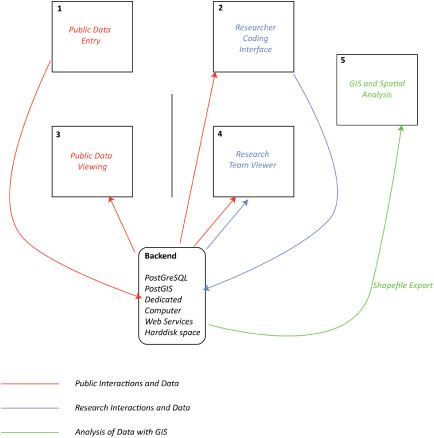
Construction of the New Spatial Media System.Previous attempts to link qualitative data, maps and analysis have focused on integrating powerful CAQDAS software within a geographic framework, either through linkages or through customized application connections (Kwan and Ding 2008; Jung and Elwood 2010). This work takes a different approach. Recognizing the depth of qualitative software capabilities, and the high barrier to entry into use, this work seeks to re-imagine qualitative software for a simple and focused geographic analysis. This is not to argue that the method developed is superior to the previously reviewed works, but rather to suggest that this work takes a different approach - one that is accessible to a wider audience, both for entry and analysis of data. Figure 1 represents a visual interpretation of the interconnected components of the NSM system developed in this work. The subsequent sections will describe the technical and conceptual details of each of the components shown in figure 1.
Database and Hardware Structure for NSM
As implemented, the NSM system shown in figure 1 lives on the world wide web. However, from a technical standpoint, the system is supported through a more traditional hardware and software model - a model that unfortunately still requires significant overhead both in terms of startup and maintenance. This is acknowledged as a drawback in the setup as it is currently conceived, though the development of cloud-based database and hosting capabilities through services such as Amazon.com and others provides a potential for near term improvement of this flaw in the system.
The base hardware requirement is an internet enabled server setup. There are no minimum hardware requirements beyond the ability to support PostgreSQL with a minimum of three gigabytes of storage space. The PostgreSQL documentation does not offer specific technical requirements beyond a "modern server" (Postgresql 2011). For the purposes of this work, the application and database domain is housed on a Windows 2008 server virtual installation, behind a firewall housed in the Department of Community and Environmental Sociology Computing Cooperative. The system is installed to include a basic internet address of http://vgi.apl.wisc.edu. Due to the length of the web address for the specific applications, the link shortener bit.ly was used to significantly reduce the character length of the address and to also make the web address easier for participants to remember.
The applications PostgreSQL, PostGIS and openLayers are loaded on the server to support the web application, data collection and visualization. PostgreSQL provides the relational database to store submitted data, as well as to serve the data to the visualization and coding applications. PostGIS is a plug-in for PostgreSQL that enables the base database to store and serve spatial information. Through the deployment of PostGIS, geographic shapes can be loaded into the database through the data entry application and the database can link the spatial coordinates and type (point, line or polygon) of the feature for later viewing. Further this spatial linkage allows the submitted data to be re-presented for subsequent attribution through the coding interface.
The final server-side component is the web-based mapping application openLayers which provides the user with a javascript implementation to load standard internet maps based on one of the major providers of spatial map data (Open Street Map, Google, Bing, Yahoo) as well a custom cartographic input provided through a web mapping service (WMS) that is published and available online. For this application, the base data chosen comes from Microsoft's Bing maps service.
Through informal observation of users of internet-based maps, it was noticed that the users expected the maps to behave in a manner similar to applications like Google Maps, Bing Maps and Yahoo Maps-meaning the slippy map nature with tiled base data. OpenLayers allows for this type of map interaction, while at the same time providing opportunities to develop new tools to enhance the beyond the pre-packaged capabilities provided by the map provider. Hence, the openLayers user experience is visually similar to what a user expects from a mapping application, with a minor difference in layer management and zoom bar design that can visually cue the user that the system is outside of the standard framework with which they are familiar.
NSM Data Entry
The primary mode of public engagement with the research process occurs in the data entry module. Located in Figure 1 box 1 - the data entry module provides the users with a question prompt and the means to answer the question. This application is a combination of multiple files from the web server providing the framework to combine into the web-based presentation.
The application is fully customizable, providing the ability to adapt the questions and spatial character of the questions to tailor new questions and responses. Stored within a JSON document (javascript object notation) the question is provided in clear text and the type of expected response can be defined in this same document through a simple declaration of answer type. This clear text customization is a deliberate attempt to enable the system to be adaptable to any desired study framework. This provides an opportunity for the application to exist beyond the application in this study, in a simple, useful format for any imagined spatial survey questionnaire.
Linked with the JSON question definition is a php (Hypertext Preprocessor) document that provides translation of the data input in the webpage for storage in the postgreSQL database. This translation is a requirement to ensure that the responses from the participants are formatted correctly, enabling the database to properly store and subsequently re-present these data in later modules. Through the php document, the data entry application is dynamic, allowing for each user to offer as many answers as needed to a question with the php code instructing the database to produce new columns automatically in order to accommodate the novel answer form.
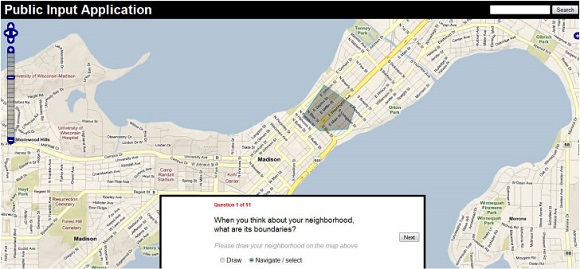
Figure 2 shows the web-based standard form for the data collection module. The question at the bottom may consist of multiple elements - free-form answer, multiple choice answer, spatial representation or a combination thereof. The combination of these multiple forms enables each data point to be linked with a spatial representation - despite these forms appearing as distinct during the interview process. Through the JSON document mentioned earlier, the questions can be adapted throughout the course of the research to focus on particular themes as they emerge.
Further, the data entry application allows for a free-form entry of data in a final component. This free-form data entry is akin to the social mapping ideas postulated by Bunge in the late 1960's. Outside of the realm of the structured interview process described for the data entry portion, this component enables the public user to own the application and tailor the response to a feature or event in which they are particularly interested, even if it exists outside of the structured interview. For example, a resident engaged with the survey could use this free form response to highlight an area of interest that they wish to share with other community members who might use this application. It is this free-form idea that allows the community to take ownership of the application for purposes beyond the structured survey. This free-form entry was created for two reasons. First, it provides the public with greater ownership of the process and allows them to adapt this system to be potentially more useful to the general public than just a structured set of interview responses. Second, these free form entries can contextualize the structured responses during analysis and allow a richer understanding of the spatial character of the study to emerge.
NSM Public ViewingSituated in Figure 1 box 3, the public viewing interface is a unique component of this method that is outside the framework of many of the qualitative and participatory GIS applications described in chapter 2. The NSM public viewing interface allows the participants to directly view the responses to the structured query. Designed as a simple internet map viewer, the participant data is loaded into the map and the user is afforded the opportunity to click on the shape and view the content connected to the specific shape. While the visualization interface is also accessible to the public if enabled by the researcher (in this study the application address was provided to the public), the public viewing portion ensures that the submitted data remains accessible by the community for further use outside of the current study. It is hypothesized that the free form entry portion of the data collection module will prove to be the most fruitful data in this application. However, by providing all submitted data it allows the community participants to own their responses and gain value from the research process.
From an ethical perspective the greatest challenge to this public viewing application is the protection of privacy for both users and non-users of the system. During this work, the community stakeholders who partnered to provide space and access to the community were asked to serve as moderators to the public viewing portal. These moderators were provided with the power to review submissions and remove potentially offensive or dangerous posts before approval for public viewing. Despite stated desires to ensure that all data would be provided to the public users through this application, from a legal and privacy lens, this was untenable. Therefore, a moderation scheme was enacted. In subsequent iterations of this framework, a "flagging" method for offensive content will be implemented, bringing the entire framework into line with the principles of a "wiki" (http://wikimediafoundation.org/wiki/Terms_of_Use). The ramifications of this type of gated access is beyond the purview of this study, but warrants greater discussion.
Implementing the System: Using New Spatial Media to Capture Information about Public Health and Social Equity - A Case Study
The rapid growth of location based services, in the form of Twitter (with Geo-location activated), Gowalla, Foursquare, Facebook, Google+ and others, is an exciting development for public health surveillance efforts. Many of these technologies have been widely embraced by a demographic that is difficult for public health officials to survey - that is, 18-35 year olds. However, these means to monitor this particular age group does not necessarily provide information about the broader population - especially those with low incomes or the elderly. To attempt to include these populations, the system described above was implemented and a transdisciplinary effort was undertaken to utilize the NSM system to develop an understanding of the potential of geographic qualitative information to both enhance public health outreach efforts, but also to provide a reusable tool to the public for continued use for efforts beyond those purely driven by public health officials.
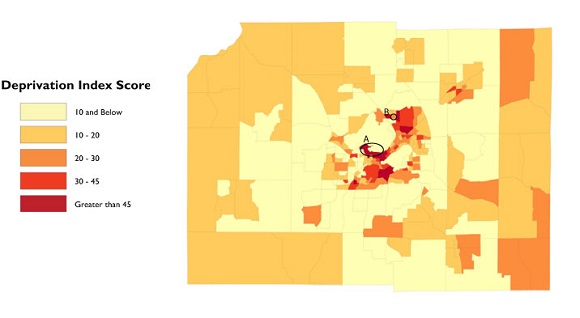
In order to deploy the NSM system described earlier it was critical to target specific populations. To select areas for deployment, a deprivation index was calculated to determine areas of greatest need. This index was created following the work of Lynne Messer and her colleagues in constructing a standardized deprivation index (Messer, Laraia et al. 2006). To construct the index, principal components analysis was performed using data from the 2000 United States Census for the geographic area of Dane County, Wisconsin, USA. The results of this analysis are presented in figure 3. The targeted areas of interest are identified in the circles labeled A and B. Circle A represents the highest deprivation score not only in the county but in the entire state of Wisconsin - occurring at the Holt Commons in the Lakeshore area of the University of Wisconsin-Madison campus. In contrast, circle B - the Kennedy Heights Neighborhood - is in the second quintile of deprivation. Though not in the highest deprivation quintile, the Kennedy Heights neighborhood is an area of transition that can be masked by the unit of analysis required by the quantitative deprivation index. The implemented survey attempted to understand the potential of using community-based participatory mappings to enhance the deprivation index by obtaining local context that the deprivation index could not provide.
To conduct the survey, contacts were made with viable testing locations and partners in the three geographic locations. Once these contacts were established a data collection session was negotiated. Residents in each location were invited via posters placed in public locations to take part in a survey about their health and their neighborhood and they were offered the sum of $10 for completing the survey. Before commencing, residents were asked to read and sign a statement of informed consent required by the UW-Madison Social Sciences Institutional Review Board. Once signed, participants were given a brief set of instructions to orient themselves with the system and then they could take the survey at their own pace.
The participants in each location were recruited on a first-come, first-served basis. No formal sampling techniques were used to invite participants. At Holt Commons, 34 undergraduate students elected to participate, all between the ages of 19 and 21. In conjunction with a Tuesday evening food pantry, 26 participants were recruited at Kennedy Heights, with a demographic of 20 percent white, 30 percent black and 50 percent Hmong (an Asian ethnicity), ranging in age from 20 to 58. At the Urban League, participants were recruited as they entered the Urban League building to take the survey in the modern computing lab. Participants here resided in areas across the city with a racial breakdown of 30% white and 70% black, all between the ages of 27 and 54. The entire sample was self-selecting which may have resulted in sampling bias as those who were not comfortable with technology may have chosen not to participate.
The survey itself asked residents to contribute locations in the form of polygons (for areal questions) and points (for questions where a single location would suffice) along with written descriptions that corresponded to the submitted points. Questions included asking participants to draw their neighborhood boundaries on the map: to provide locations and descriptions of negative events and areas: to describe positive aspects of the neighborhood and provide locations of where these aspects exist: as well as other questions about access to healthcare, healthy food, recreation and others. Additionally, the residents were encouraged to take the URL and continue to use the survey outside of the testing site. A second interface for viewing the submitted data gave residents the option to continue use. Unfortunately, at the time of writing, this viewing site has been largely unused.
The initial survey question asked residents to delineate their "neighborhood". It had been hypothesized that this initial question would illustrate dramatic differences in access to refute the deprivation scores (which we empirically know to be flawed with respect to the Holt commons community). However, when comparing the results of the survey from Kennedy Heights with Holt Commons some surprising results were discovered. The size of the neighborhood polygons contributed for area B were less than half the size of the polygons contributed in area A. During the transdisciplinary analysis, the public health officials involved felt that this result indicated that social isolation existed in the Kennedy Heights neighborhood of which they were not previously aware. The community team quickly decided that further outreach was required to support this neighborhood. In light of these findings, the literature on neighborhood definition may offer some explanations. Chaskin (1997) states that neighborhood is a spatial construction where the residents share both proximity and the circumstances that come with it. Choldon (1984) goes further and defines neighborhood as a sub-community. Both of these definitions appear to provide reasonable explanation for the findings in these areas, as both populations are unique in either age or race/ethnicity
After the respondents provided their neighborhood, they were then asked about topics ranging from safety, to access to food and healthcare as well as positive aspects of their neighborhoods. Despite defining neighborhood in the initial question, the fluid nature of the definition was demonstrated as locations outside of the defined neighborhood were often provided during subsequent questioning.
The contributed responses yielded some unexpected connections between place and health. Safety, drugs and fights were acknowledged stressors by participants in Kennedy Heights, along with comments about gangs as a safety issue as well. In contrast, the Holt Commons population failed to mention safety as a concern in over half of the responses. When safety was mentioned, lack of lighting was the focus with a secondary mention of an attempted assault that occurred earlier in the year. The geographic component of these safety events were all tightly clustered with the neighborhood polygons indicating a close relationship between the neighborhood and places where safety was an issue.
When discussing access to food, the Kennedy Heights respondents mentioned good food in greater volume than the other sites. This is an interesting finding in light of a lack of adequate grocery options on the north side of Madison. However, the respondents were all attending a food bank that was providing many types of vegetables, along with other healthy food options, which was directly mentioned in the contributed text as a health benefit. In contrast, the Holt Commons population mentioned good food and unhealthy food in a number of responses - the term good not necessarily referring to healthy. By soliciting responses in conjunction with a food bank the responses in Kennedy Heights may be been skewed resulting in respondents mentioning "good food" more frequently than they would have in a alternate setting. This type of bias is important to consider in each of the questions - confounding the analysis of both the answers and the comparisons between areas.
As a geographer, it appeared prudent to focus on expanding the geographic context beyond simply a numeric framework of the deprivation index to ensure that social equity concerns could be targeted effectively. Transdisciplinary partnerships make sense as the best path forward to implement this type of framework. The content described above is only a portion of the larger data collection, but it illustrates the first steps in this type of partnership. The questions in the survey were designed in conjunction with a public health community expert to both evaluate the potential to capture qualitative spatial data about community, healthcare, access and stress, and to construct context that could be used in subsequent studies.
The Transdisciplinary Partnership Model
Designing this study in a transdisciplinary manner was a learning effort for all parties. After the data gathering was completed, there was a realization that a process to facilitate transdisciplinary partnerships in this context would be beneficial. This partnership would begin at the stage of questionnaire design. This can be conceived of as a multi-stage effort or single-stage depending on the goals of the study. The implementation described above is a single stage effort to characterize the health landscape, but it was designed to offer potential, both in content and method, for further study. At the conclusion of the design of the questionnaire, the effort rests solely with the geographer who then implements the survey in the system. This involves working with a JSON document containing the survey structure to construct both the question, as well as the spatial data type that will be captured in each question. Once the survey is constructed, the public input application is modified through the JSON document to ensure that the geographic footprint, as well as the center of the map captures the area of interest. These technical pieces do not require an expert in geography and computing technology, but can increase the efficiency of the study.
Once the survey is constructed, the partners in public health can take the online survey forward to the community of interest. This would involve either securing computing resources to take to the community or setting up sessions at community centers where online computing access is available. The long term presence of community teams from the city public health agency in these areas can create relationships that will make the study much more effective. Further, these relationships will allow a more complex set of questions to be implemented. At this point the survey can either capture general contextual information as in the case study, or the survey can be motified to ask more involved questions about birth outcomes a target population of new mothers. The flexibility in the type and detail of the questions is illustrative of the flexibility inherent in this application.
Upon completion of the collection of the survey data by the public health team, the transdisciplinary group was reconvened. The resulting Data were loaded into the coding module to begin the analytical coding these data. Coding was conducted by both geography and health experts to provide multiple modes of understanding to be applied. Once the data were coded the iterative process of visualizing the coded data and subsequently applying secondary codes and re-visualizing the data occurred. This process was used to construct hypotheses that about the nature of health in the three neighborhoods that were tested in subsequent analyses that are beyond the scope of this paper. Each of these sets of data was constructed to allow these data to be exported to ArcGIS or R for statistical and spatial analysis - exports that while offering more robust analytical tools were not utilized by the team at the time of this writing.
Once this process is complete, the team could construct further questions to implement in the system if the tool was considered to potentially yield deeper insights. At that point the cycle would begin anew. Or the team could take the generated hypotheses and implement other means of inquiry or, more likely, a combination could occur. Ultimately, the process could follow this course or only portions of this course to provide both contextual and substantive information that is necessary to support this type of public health inquiry.
In terms of social equity, this type of qualitative geographic inquiry offers a new means of capturing and understanding the landscape of social equity outside of quantitative measures. Currently, community-based teams from the health department in Madison and Dane County work directly with neighborhoods to implement programs and determine areas of need. The approach is decidedly low technology, consisting of paper surveys and no geographic understanding of the area or its spatial makeup. This type of participatory mapping framework, coupled with outreach efforts in a Health Department can increase the number of residents reached through efforts to encourage people to participate in this type of application. Further, combining a survey mechanism with a simple online map for general input and publicizing this through both public health and community partners encourages residents to engage in an effort to not only aid public health monitoring, but also to support community organizing efforts of all kinds.
Conclusions
This study demonstrates that a contextual picture can be painted to complement an area-based deprivation index - a device commonly used in epidemiology (Kirby, Coyle et al. 2001; Ahern, Pickett et al. 2003; Krieger, Chen et al. 2003; Rich-Edwards, Buka et al. 2003; Reagan and Salsberry 2005). Given the broad potential, it is important that a sound implementation strategy is developed to ensure that the NSM system is set up in a manner that both supports in-depth research and encourages its use. In addition, the opportunity to capture residents' qualitative descriptions and geographic locations is a boon to understanding the differences in social equity between areas with similar or even inverted deprivation scores.
Bunge's invaluable work in the 1960's paved the way for community-based mapping efforts that focused on increasing social equity. However, the use of this type of methodology for these purposes has not been widespread. At the same time, public health officials have implemented a number of surveys largely about place without explicitly capturing place-based representations. This work demonstrates that place-based understanding of community can help to clarify the social context of place and its impact on health.
Quantitative indices of health determinants are powerful and useful research tools. However, in isolation these indices can both mask areas of health inequity and highlight areas that are not in need. On the other hand, these deficiencies can be accounted for using qualitative spatial data that is collaboratively collected through community participation,. In turn, the community use of new spatial media has the potential to empower residents to claim a stake in their own health representations, as well as reaping benefits for residents in enabling their use and understanding of these new forms of social interaction. When a NSM system similar to that described in this research is deployed, it offers the potential for transdisciplinary partnership and a richer body of knowledge. In turn, this combination can allow public health officials to better serve populations in greater need and can also extend an offer of collaboration and ownership of their own health presentation.