Community-based Pedestrian Mapmaking
- Department of Informatics, Ionian University, Greece. Email: choko@ionio.gr
INTRODUCTION
Contemporary digital maps are elaborate and contain detailed information, but they lack meaningful knowledge in terms of collective habits and preferences. They might depict a very detailed instance of the real world, but their philosophy is car-driven, excluding anthropocentric features, which mainly characterize pedestrians and their behavior while walking through the city. For example, if a city path has an accessible pavement and offers fast and safe movement far away from car traffic, then a pedestrian does not care if that path is a few dozen meters longer than an alternative path between two points. Nevertheless, pedestrian navigation software is going to suggest the absolutely shortest one, just because it is a few meters shorter. Some navigation services (e.g., Google Maps) provide pedestrian options (e.g., footpaths, bike lanes, etc) and highway avoidance, but the rest of the suggested itinerary does not regard the qualities of interest to pedestrians, because the majority of city paths are not associated with this kind of rich meta-data.
In practice, humans select a path with some regard to actual distance, but they also consider several other factors such as personal preferences, motor ability, weather conditions, time of day, etc. Thus, there is a need to collect data that facilitates the creation of meaningful digital maps that consider the needs of urban pedestrians. This work is focused on pedestrians, but the same methodology and arguments are also applicable to urban cyclists. According to Lynch (1960) paths are the predominant city elements, alongside edges, districts, nodes, and landmarks.
Neglecting the mismatch between the represented and the experienced image of the city reinforces infrastructures that already marginalize some types of mobility. Urban planners have already recognized the importance of designing for pedestrians (Southworth, 2005). In the case of rural mapping, Bidwell (2012) describes how walking in rural southern Africa revealed incompatibilities between the point-based representations that dominate technology, and local knowledge and communication practices. Moreover, Srinivasan (2012) has collected spatial data from the local human community and he combined it with data from other technological sources, in order to facilitate stakeholders making informed and accurate decisions regarding development activities in the respective rural region. Indeed, Saad-Sulonen and Horelli (2010) have highlighted the value of map-based community informatics in participatory urban design. This work is focused on the data collection aspect of urban pedestrian street maps with local subjective knowledge, which might facilitate a pragmatic understanding of the city by urban planners. The suggested pedestrian data collection methods might be employed in the development of geographic information systems that are anchored on community informatics, rather than just technological representations of land use.
The idea of meaningful subjective urban maps is not new. The most popular one is probably the London tube map, which has been redesigned in order to become more suitable for the common task of switching between lines (Figure 1). Notably, the original London Tube map had been designed, just like contemporary digital maps, for the purpose of accurately depicting the actual geographic location. More recently, Vertesi (2008) has suggested that the map (digital or not) is very similar to a computer user interface that provides an abstraction of what is actually happening inside a computer. Indeed, when being moved by a complex system of public transportation one does not care much about geo-accuracy. Thus, any map that is supposed to be used for moving through a city, should focus primarily on the needs of its users and on their subjective perceptions of urban space with regard to mobility.
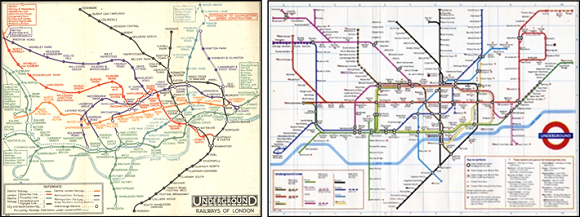
The case study of tube maps is beneficial for re-conceptualizing pedestrian mapmaking, but it should not be taken too literally. Geo-accuracy plays a bigger role in the route choices of pedestrians than for tube users. For pedestrians, too much additional distance could potentially be much more important than for tube users. Therefore, digital maps for pedestrians should consider several qualities, but they should not ignore the distance aspect. For example, map navigation for pedestrians might employ an algorithm that prioritizes the streets preferred by fellow dwellers, as long as they are not too time consuming, or too distant.
Previous research on community informatics has examined digital maps and geographic information systems. Researchers have demonstrated the usefulness of digital locative media as a shared experience (Willis et al., 2010) and as a placeholder for community annotations (Ringas et al., 2011). Neverthless, the growing importance of informatics in map making is also a source of novel research issues (Griffin et al., 2012). In particular, the importance of pedestrian maps for urban planning cannot be overstated. Kasemsuppakorn and Karimi (2013) have concluded that: "A pedestrian network is an essential resource in a variety of applications, especially in pedestrian navigation services and urban planning projects." The above works have established the importance of pedestrian maps in urban planning, but there is still a missing link between the represented image of the city and actual pedestrian preferences.
This work presents a community-based data collection that facilitates the design of pragmatic pedestrian maps and also enhances urban planning. The aim of this article is to frame contemporary data collection techniques for mapmaking and in particular to highlight a more humane data collection that might facilitate future research and practice in new cartographic visualizations for pedestrians. Although the ultimate practical outcome of this stream of research would be an alternative visualization of the city, this work lays the groundwork and makes a feasibility study of this concept.
This article provides empirical evidence that contemporary urban mapmaking is not suitable for pedestrians, and makes suggestions for a pedestrian-friendly mapmaking research and practice. The rest of the article is organized as follows: 1) a survey of related work, 2) the methodology of community-based data collection, 3) the results from a case study in the city of Corfu, Greece, 4) implications for theory and practice of community-based mapmaking, and 5) suggestions for further research on community-based mapmaking in the context of urban planning.
UNDERSTANDING THE CITY AND PEDESTRIANS THROUGH CARTOGRAPHY
Cartography or mapmaking is an ancient art and craft. The first maps were based on a subjective understanding of the known world as provided by cross-checking reports of travelers, or confirmation by personal observation by the cartographer, who then analysed and assembled the collected data on paper and in visual format. On the other hand, contemporary mapmaking is considered to be an objective science. Surveying and observation (data collection) is based on digital instrumentation, such as aerial and satellite photos, as well as local photography and GPS recordings. Then, cartography employs the above tools (e.g., satellite photos, GPS recordings) and techniques (e.g., survey, traveler report) in order to analyse this geographical data.
The mapmaking process stands on the following pillars: 1) data collection from the field, 2) data analysis according to user needs, and 3) visual representation. This article is focused on data collection from pedestrians. Moreover, it makes suggestions on the analysis of data and presents implications for further research and practice in the visualization (cartography) phase. The proposed methodology is effective in terms of effort and cost to replicate in any city and the respective case study stands as a proof of the concept. Although the proposed methodology is not sufficient to create a new kind of pedestrian map, the assessment of its feasibility is necessary before new techniques are devised that collect, analyze, and map pedestrian data at the city scale.
Mapmaking and pedestrians
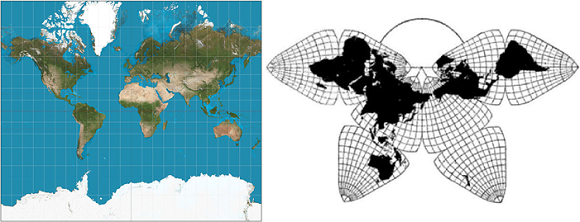
Vector maps are usually combined with satellite photography (e.g., Google Maps) and they seem to be accurate and objective representations of the earth, but this is a fallacy. Actually, any two dimensional map of the earth is subjective at least in one way, because it is not possible to represent a sphere (the earth) as a rectangle (Brotton, 2012). Thus, every known two-dimensional map of the world has an underlying subjective assumption, which is usually related to the purpose of that map. For example, the Mercator projection is the most popular type of map and has been employed by digital maps, but it distorts the size of items proportionally to their distance from the equator. This is not an issue for the main users of the Mercartor projection map; navigators who cross the sea (mostly in a horizontal manner) between continents (Figure 2). In addition to the map projection issue, there are many cases of subjective cartographic design for various reasons (Brotton, 2012), such as type and quality of data, propaganda, analytical process, cartographic techniques, etc. Every map has design assumptions that usually serve the purpose of its users or creators. Although the distortion introduced by the widely used Mercator earth projection is not significant at the scale of the city, mapmaking has additional assumptions with regard to data collection and analysis, which are outlined next.
Contemporary digital maps provide an option for pedestrian navigation, but they do not really account for subjective preferences in the calculation of the optimal path, which is usually provided in terms of absolute distance. Nevertheless, our personal experience of pedestrian navigation in several familiar cities around the world suggests that the digital maps do not offer pragmatic suggestions. Moreover, digital maps may provide navigation functionality, but they do not account for subjective preferences in the calculation of the shortest path. In practice, pedestrians select shortest paths by considering multiple criteria, such as safety, traffic, weather, season, time, day, levels of noise, and accessibility, but contemporary digital maps mainly consider distance traveled, which is just one of the many parameters considered by a pedestrian. Besides, the incomplete parameters employed in pedestrian path calculation, the visual design of digital maps favours vehicle mobility and does not depict the viable options for walking.
It is technically straightforward to have a GIS that stores the attributes of each street, but the difficult part is the collection and analysis of the data required for a pedestrian-friendly map. In previous work, Chorianopoulos (1999) presented a system that facilitated the creation of alternative paths through a city based on personal preferences, such as places of interest, shopping, and eating. Therefore, each city street could be feasibly weighted with a pedestrian accessibility ranking. A similar system of weighting the importance of routes with values other than pavement width has been developed for the case of bikers (Bíl et al., 2012). The latter work has collected the data through volunteer who logged their biking routes with GPS. It follows that a pedestrian-friendly cartography should be based on pedestrian data collection (e.g., GPS traces created by pedestrians), instead of aerial photography.
In summary, any two dimensional orthogonal map, regardless of scale (world, country, city) is subjective in some sense (e.g., selection of a projection system with particular assumptions, or data collection focused on cars and land-use instead of pedestrians). It thus is apparent that a pedestrian-friendly cartography, should start with community-based data collection.
Community-based data collection for pedestrian mapmaking
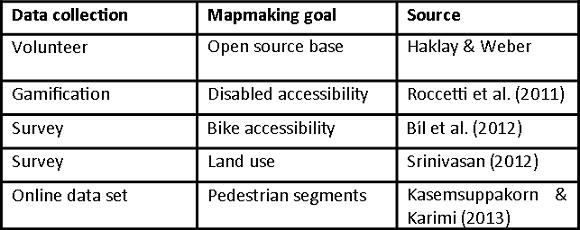
Mapmaking has been done with various tools and practices over the course of history. Most notably, Herodotus (c. 484-425 BC) was the first to raise the issue of how the data was collected and analyzed by mapmakers (Brotton, 2012). On the one hand, contemporary scientists employ accurate apparatus in the measurement of space and movement, while, on the other hand, on the other had designers employ the human and social scale in their map design. It is suggested that there is continuum of approaches between the two extremes that combines aspects of both to varying degrees. Since most maps are made for human use, the data collection technique should also concern pedestrian behavior. Table 1 outlines some recent cases of data collection and mapmaking, in order to provide context for the proposed methodology for pedestrian mapmaking.
Digital map providers have recognized that their very detailed and realistic cartography might have mistakes or not include some streets. For example, Nokia Here maps provides a layer called "community", while Google Maps provides Mapmaker, which allow users to manually edit maps. Nevertheless, those edits operate on top of established map designs (base maps), so there are limited degrees of freedom for genuinely new maps. The most popular user-contributed maps are those using OpenStreetMap (Haklay & Webiter, 2008). In other words, OpenStreetMap is the equivalent of Wikipedia for maps. Nevertheless, the above approaches do not have any particular focus on pedestrians neither during data collection, nor during mapmaking. In practice, the best case of pedestrian-friendly design is to highlight the paths over an existing base map, which is usually full of data not relevant to a city dweller, or a tourist.
Although there is plenty of research that provides techniques for analyzing the data that originates from pedestrian GPS traces, there is no research on how to contextualize GPS traces with meaningful subjective perceptions. Notably, Kasemsuppakorn and Karimi (2013) have employed GPS traces from pedestrians in order to create streets maps that depict walking paths. At the same time, Bierlaire et al. (2013) have raised the issue of inaccuracy of traces created by simple GPS devices and provided solutions based on probabilistic modeling. Despite the widespread use of maps either directly on mobile computers (e.g., navigation), or indirectly by dependent applications (check-in at a place on behalf of a social network) the cartography has not been adapted to the new users and their subjective perceptions of space.
Mobile computers (e.g., tablets, smart phones, and navigators) are influencing the ways we experience and perceive the city. Although the majority of digital maps depicts a static image of place, in practice, urban spaces are full of motion, particularly pedestrians walking around. Ingold (2007) has argued that walking and movement are most representative of the ways in which we experience the city. Thus, mobile devices should be employed as a method for understanding how people experience places. Moreover, this work has been inspired by the following quote (Stilgoe, 1998): "Outside lies unprogrammed awareness that at times becomes directed serendipity. Outside lies magic." With that in mind, my research question is shaped: "Could one take advantage of highly precise technology (e.g., GPS, digital mapping), in order to inform a more humane cartography with a focus on pedestrians?"
The next section provides early empirical evidence of the feasibility of this idea by performing a study which serves two purposes: 1) it proves that contemporary digital maps can be misleading for pedestrians, and 2) it provides a methodology to collect data for new types of pedestrian maps focused on city dwellers and which can be the basis for tools for community informatics and urban planning.
METHODOLOGY
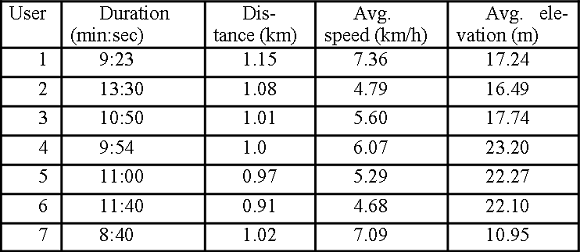
Since many pedestrians employ GPS enabled devices, e.g., smartphones, it is feasible to collect and analyse GPS traces, in order to explore actual pedestrian behavior. Mehta (2008) has argued that urban studies lack empirical data on walkability as experienced by pedestrians. For this purpose, a study was carried out with ten local pedestrians, who were asked to navigate from point A to point B in a fast manner. The pedestrian routes were recorded by means of a GPS device and then plotted on a map for comparison with existing pedestrian navigation applications.
Three pedestrians were interviewed during the first round of pilot studies in order to elaborate their motives for selecting routes and in order to adjust the basic parameters of the study: 1) starting and ending point, 2) duration, and 3) possible alternative paths. The participants of the main study were not interviewed, in order to keep the study simple and focused on actual behavior (e.g., route choice). The total number of subjects in the study (three in the pilot followed by seven person in the main study) is small, but it is enough to reveal a popular path in the context of the respective physical space and time constraints. More subjects might be needed if there are more alternative paths between the two points, or if more time is given to subjects to perform the walk.
Subjects
The users' compliance with certain criteria allowed the collection of a clean data-set and the minimization of incorrect assumptions regarding the selected routes. In particular, the participants enjoy and have a habit of walking around the city, have a good knowledge of the city's streets, are healthy and capable of walking one thousand meters, and are adult but not more than fifty years old. It was essential for the user to have lived in and experienced the area, since local knowledge is the source to derive from and depend on, in order to re-examine pedestrian cartography and in order to propose revised techniques for community-based mapmaking.
Procedure
The main criteria for selecting the starting and finishing points of the trajectory were: a) the variety of connecting paths able to be generated between them and, b) the possibility to create a specific scenario. The destination point is within a 750 meters radius from point A, thus linking to the 800 meters - 10 minutes' walk that is considered as a medium walkability radius in neighborhoods (Moudon et al., 2006, Canepa, 2007). The in-between topography is slightly steep, mainly towards point B; depending on the chosen path the inclination differs. The landscape is an urban provincial town and it includes a variety of sceneries; streets of high, low or no traffic, traffic lights, pavements of larger or narrower sections, trees, shopping streets, pedestrian zones and a promenade by the sea as possible alternatives the combination of which is closely related to the participants' choice.
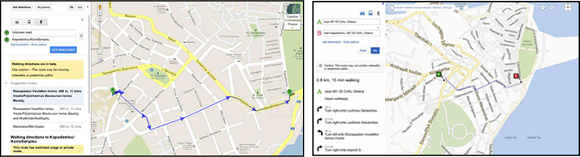
For the experiment's requirements, the subjects were asked to walk from point A to point B along the fastest path in a time frame of 13 minutes maximum, moving quickly, efficiently and without stopping. The duration of the task was defined by taking into consideration the suggestions of popular navigation applications in relation to the proposed route connecting A to B, which was reported to be eleven minutes by the Google Maps pedestrian option.
Having set the starting and finishing point of the trajectories, a plausible navigation scenario was then created. The scenario from point A to point B encouraged fast movement: "You are a student at the local University and today is your/the graduation day. The ceremony starts at 11:00 and you are supposed to be there at least 15' minutes earlier. Although it was a day you were not supposed to be late, due to several unforeseen incidents, you found yourself being at the Department's Secretary at 10:30. Hence, you have approximately 13 minutes to arrive on time for the graduation ceremony."
The pedestrian routes were recorded by means of a GPS device and then plotted on a map for comparison with existing pedestrian navigation applications.
RESULTS
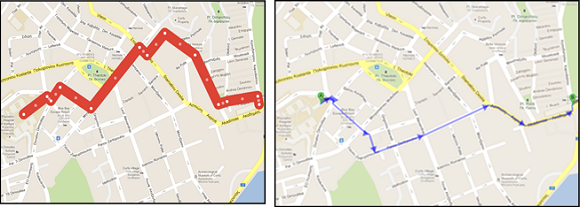
The acquired GPS trajectories were analyzed to produce results regarding the users' route choices. The subjects of the study have followed different trajectories, but all routes had several common parts, which are highlighted on the new map (Figure 4, left). In brief, it was found that the perceived shortest path is significantly different from the one suggested by a navigation application (Google Maps pedestrian option).
The paths that users chose to follow, while quickly moving from point A to B, demonstrate a great variety and significant divergence from the suggested trajectory, proposed by a popular map application (Figure 4, right). In terms of distance, the participants' choices are fifty or more meters longer than the ones suggested by Google Maps, but in terms of time the participants' are faster. The results clearly expose the monolithtic reasoning behind the suggestions of the popular map navigation application, in contrast to the multi-factorial thinking of human beings. Thus, the computerized perception of pedestrian navigation can be out of track, since minimum distance does not always signify the fastest or safest choice. It is noteworthy that the application's suggestion goes along main roads of heavy traffic and noise. Although quite large pavement zones are provided for most of the path, they were not the primary selection of the users.
The above findings are interpreted as pedestrians' behavior. Their choices were based on personal experiences and preferences. In an urban setting, users evaluate conditions, preferences and circumstances and navigate accordingly. Although weather, season and time of day do not appear to play an influential role, this is due to the good conditions under which the study took place. If the study had taken place in a longer period of time, throughout the year and day, it is expected that those three factors would become essential in route choice. For example, during the night the same person might select a different route that has better lighting.
Community-based mapmaking
Participatory design and community informatics have already considered the active involvement of few responsible and knowledgeable users, but they have not considered the collective local knowledge of aggregate patterns of pedestrian movement in the city, which is suggested by the findings of this article. Although the case study stands for a geographic methodology, it is also a motivation for leveraging trajectory data uploaded on social media platforms (e.g., OpenStreetMap GPS Traces), in order to design user-driven digital maps. In case there are concerns about individual privacy, it is suggested that route data is deployed in an aggregated form and only with the consent of individuals.
The notion of significant differences between perceived and actual use of information technology has been documented in contemporary urban research. Papinski and Scott (2011) found that the actual routes selected for traveling from home to work are not the most efficient ones either in terms of time, or in terms of distance. Notably, their subjects reported that both time and distance are important factors in selecting the sub-optimal observed routes. Similarly, the main finding of this work is that the widely available shortest path functionality for pedestrians might not provide subjectively optimal results, at least in the case of urban centers with a complex set of available paths. The findings of this research inform the development of mobile applications and the design of new map layers for city dwellers. They serve as the raw data to inform the learning process for the creation of pedestrian-friendly maps.
Previous research has considered the analysis of GPS traces and the design of new types of digital maps separately. The analysis of GPS traces has been elaborated by Zheng et al. (2009), who have collected and data-mined a large data-set of trajectories in order to find out interesting places, means of transportation, and travel habits. More recently, they have extended t heir research to provide social recommendations based on the itinerary habits of locals. Nevertheless, they have not examined the requirements for constructing new types of digital maps and they have not considered pedestrians. Pedestrians have been considered by Kasemsuppakorn and Karimi (2013), who have employed data-sets of GPS traces to construct street maps for pedestrians. They have successfully compared the pedestrian streets to aerial photography, but they have not accounted for the behavior of pedestrians. Moreover, Chen (2011) has created isochronic maps based on the time required to travel by public transportation. The work described here complements the above efforts by providing a community-based view of mining pedestrian GPS trajectories and creating new types of digital maps that can be used as a tool for urban planning.
The concern for the information needs of pedestrians is not new, but the focus on the information needs of moving pedestrians has been neglected. Indeed, there has been significant research and commercial efforts on location-based, context-aware, and urban informatics (Lindqvist et al. 2011). For example, there are social media services for commuters, and tourists, as well as shopping and historical applications. Nevertheless, the majority of those approaches, has considered the pedestrian as a static subject and not regarded the needs of pedestrians as they are moving between points of interest.
The former subjective approaches to urban informatics have considered maps as a platform, but then have not explored how maps themselves could evolve as part of the collective local knowledge. For example, Ringas et al. (2011) have found that citizens benefit from the public sharing of personal stories in various formats (text, voice, photo, video). Moreover, Traunmueller et al. (2013) have focused on alternative leisure paths through social media voting. Nevertheless, the above works assume an extra effort on behalf of the user to share their story and they have not yet considered the potential crowdsourcing of the subjective data on a collective image of the city.
There is a difference between urban informatics that considers the map merely as a platform for mash-up services and the digital maps which become part of collective local knowledge (Heipke, 2010). This case study stands for a new approach to cartographic data collection that might facilitate the design of maps that serve pedestrians or other marginalized mobility types. The methodology of this study might be useful to other researchers, who wish to replicate and to extend these findings. Moreover, practitioners and researchers might be interested in deploying new ways for involving users in cartographic data collection or in leveraging existing data-sets in order to provide pedestrian-friendly cartography.
It is not suggested that all mapmaking should be subjective, but that the subjective element should play a role during data collection and analysis, and inform other tools and techniques. Srinivasan (2012) has claimed that: "Mashing up remote sensing information with local community knowledge can help identify patterns and theories regarding future trends in resource use and possible stakeholder conflict." Moreover, according to Brown et al. (2007) subjective experiences of walkability should be explored further and should be an additional focus of urban design. In sum, participatory or community-based mapmaking can be a useful tool for urban planning. In particular, community informatics and participatory data collection should inform the design of maps that represent the behavior of pedestrians.
CONCLUSION AND FURTHER RESEARCH
Subjective mapmaking techniques are as old as the art and craft of making maps. Digital tools have made maps widely available, but the majority of digital maps have been designed with an incompatible data-set and for different purposes than walking in urban streets. It is rather curious that mobile computers (smart phones, tablets, wearables, etc), which are usually employed by pedestrians provide the exact same cartography that is employed for car navigation. In addition to raising the need for pedestrian urban maps, this article has proposed a methodology for collecting and analyzing pedestrian data. Further work is required in order to create a usable visualization of popular pedestrian routes in a map format. The main benefit of such map is to highlight opportunities for improving the walking network. The same methodology is applicable to any urban area that has been misrepresented by technology-oriented cartography.
In ongoing research, a dynamically crowd-sourced mobile map application is being designed, where the most frequently used streets will be illustrated and dynamically modified, according to users' feedback. The most popular streets will have larger line widths, whereas the less popular ones will have narrower lines. The dynamics will not only be controlled by frequency, but also by personal preferences and user profiles, depending on several parameters, such as the weather conditions, time of day, possible health problems, etc. They will generate paths tailored to the user's specific demands and safety. The maps' priority will be the pedestrian and the biker, and they will be addressed to all people, locals and visitors.
This article has demonstrated that the image of the city as depicted in popular geographic information systems does not stand for pragmatic pedestrian preferences. As a remedy, the article has described how community-based data collection for pedestrian mapping might provide a better understanding of the perceived image of the city. In addition to hi-fidelity digital maps that emphasize automobile paths and geographical accuracy, community-based mapping is a potential tool for urban planning. In conclusion, the image of the city as produced by each one of the past, current, and future methods is an image of those methods, as much as an image of the object of representation. Therefore, it should be remembered that current digital maps on mobile and desktop computers are the result of available tools (satellite photography) and intended uses (land use and car navigation), and not just maps intended for other equally beneficial uses and aspirations, such as walking and biking. Further work should elaborate the methods of transforming community-based data collection for pedestrian-friendly cartography.
ACKNOWLEDGEMENTS
I am thankful to Iro Armeni for assisting in the data collection, and to the anonymous reviewers and to Liisa Horelli for constructive comments on the early drafts of this article.