Network Graphs Are Fun
I frequently create network graphs for the purposes of analyzing and visualizing corpora of narrative text. Network graphs, at their simplest, are composed of only two things, nodes and edges, where nodes are things and edges are relationships between those things. This missive outlines a few ways I use network graphs to do distant reading against corpora.
Modeling bigrams
In my world, creating network graphs can be as simple as selectively modeling a corpus's bigrams. For example, in the Iliad and the Odyssey, I might want to know, "What are some of the things shared between Ulysses, Achilles, Hector, Penelope, and Telemachus? What do they all have on common, how are they distinctive, and to what degree are they related to each other?" To actually create the graph, one can find all bigrams, loop through each, retain only the bigrams whose first word is one of the selected characters, and save the result as a file. In my case, an abbreviated version of node combinations -- the graph -- looks like this:
- hector drew
- achilles cut
- achilles prays
- hector tore
- telemachus gave
- penelope he
- ulysses leading
- hector saw
- ulysses requite
- achilles cleaver
- ulysses replied
- hector horses
Such is called an edges table, and while the type of edges is not explicitly articulated, the simple pairing of nodes denotes some sort of relationship.
Once an edges table is created, it can be imported into any number of desktop applications or programming languages for analysis and visualization. Personally, I use an application called Gephi and/or a Python library called networkx for these purposes.
Network graphs have all sorts of different properties. For example, a graph can be directional or not, meaning if the the edges emanate from one node to another, then the graph is "directional". If not, then the graph is "bi-directional". Second, a node may have many edges, and the number of edges is called the node's "degree". If the graph is directional, then nodes have some number of "in-degrees" and some number of "out-degrees". Other properties include but are certainly not limited to: "betweenness", "closeness", and "diameter". Moreover, one might apply any number of clustering techniques to a graph to determine the size and scope of "neighborhoods". After taking a graph's properties into account, graphs can be visualized. For example, the color and sizes of things can be assigned, and different layouts can be employed. When it comes to layouts, force-directed layouts are the most popular.
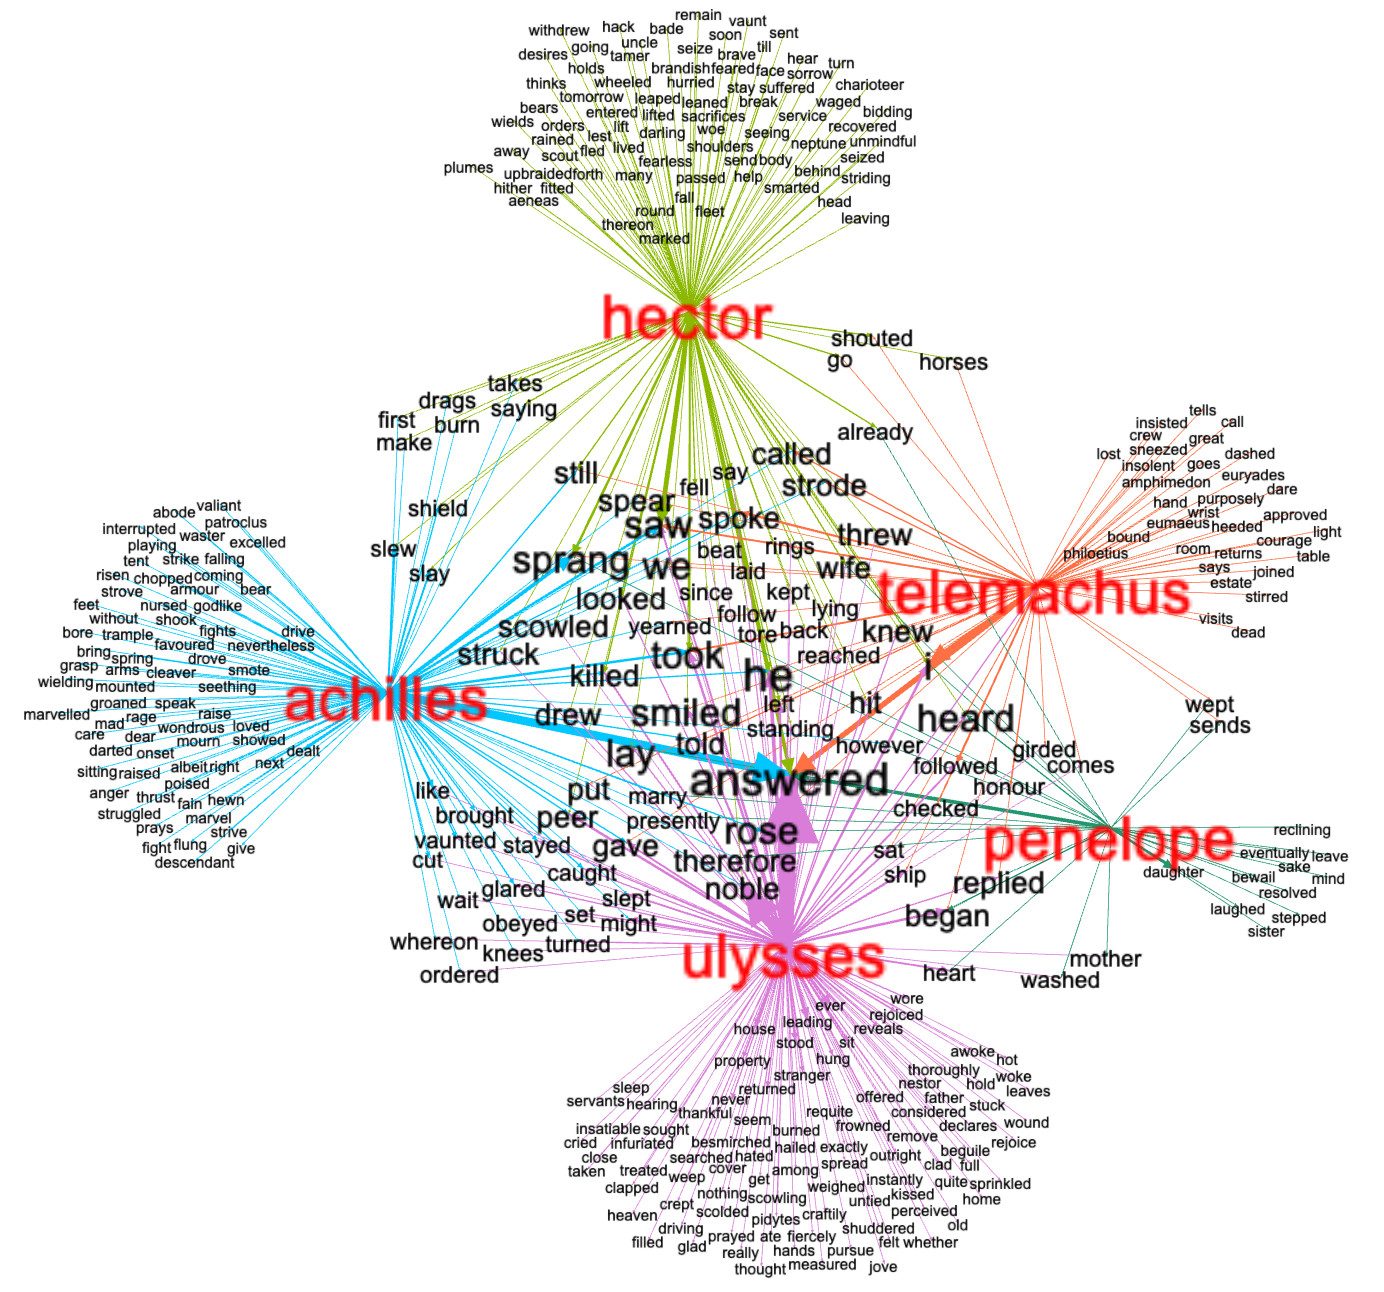
After importing my graph into Gephi, taking a number of different properties into account, I generated the following visualization:
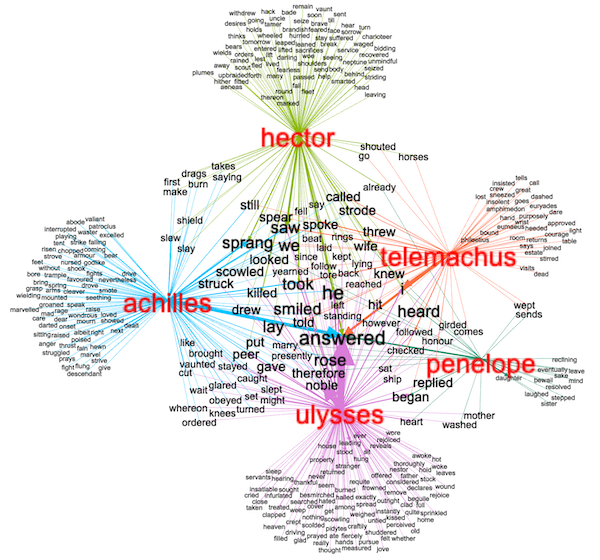
Network graph of selected characters from the Iliad and the Odyssey
I can now address my questions:
- What are some of the things shared between Ulysses, Achilles, Hector, Penelope, and Telemachus? Well, for example, both Achilles and Hector are associated with "slay", "slew", "shield", and "burn". While only Penelope and Telemachus are associated with "wept", and "sends".
- What do they all have on common? All the characters are associated with "he", "took", "smiled", "lay", and to the greatest degree, "answered". (Apparently Ulysses does a lot of answering!)
- How are they distinctive? Only Penelope is associated with "daughter", only Telemachus is associated with "lost", etc.
- To what degree are they related to each other? Because of the layout, I assert Achilles and Telemachus are not strongly associated with each other, at least not as much as Ulysses and Penelope. Furthermore, notice how Telemachus is not opposite his parents, Ulysses and Penelope.
The modeling and visualizing of texts in the manner outlined above does not convey truth. Instead, what is conveyed are measurements and observations. It it up to the student, researcher, or scholar to interpret the measurements and observations. Personally, I see violent words between Achilles and Hector. I see words of authority between Ulysses and Achilles. I see non-violent words between Penelope, Telemachus, and Ulysses. All of these observations can then lead to discussion, which is the whole point of reading, in my opinion.
Modeling bibliographics
A more concrete way to model texts as network graphs is through bibliographics. Authors write things, and the things have titles. The titles are about any number of topics, and those topics can be denoted as keywords. Given these types of nodes all sort of new questions can be addressed:
- Who wrote what, and what did they write about?
- Who is the most prolific author?
- What are the items in the corpus about?
- Across the corpus, what themes predominate?
- To what degree do the items in the corpus cluster into groups, and if they do, then what are those groups?
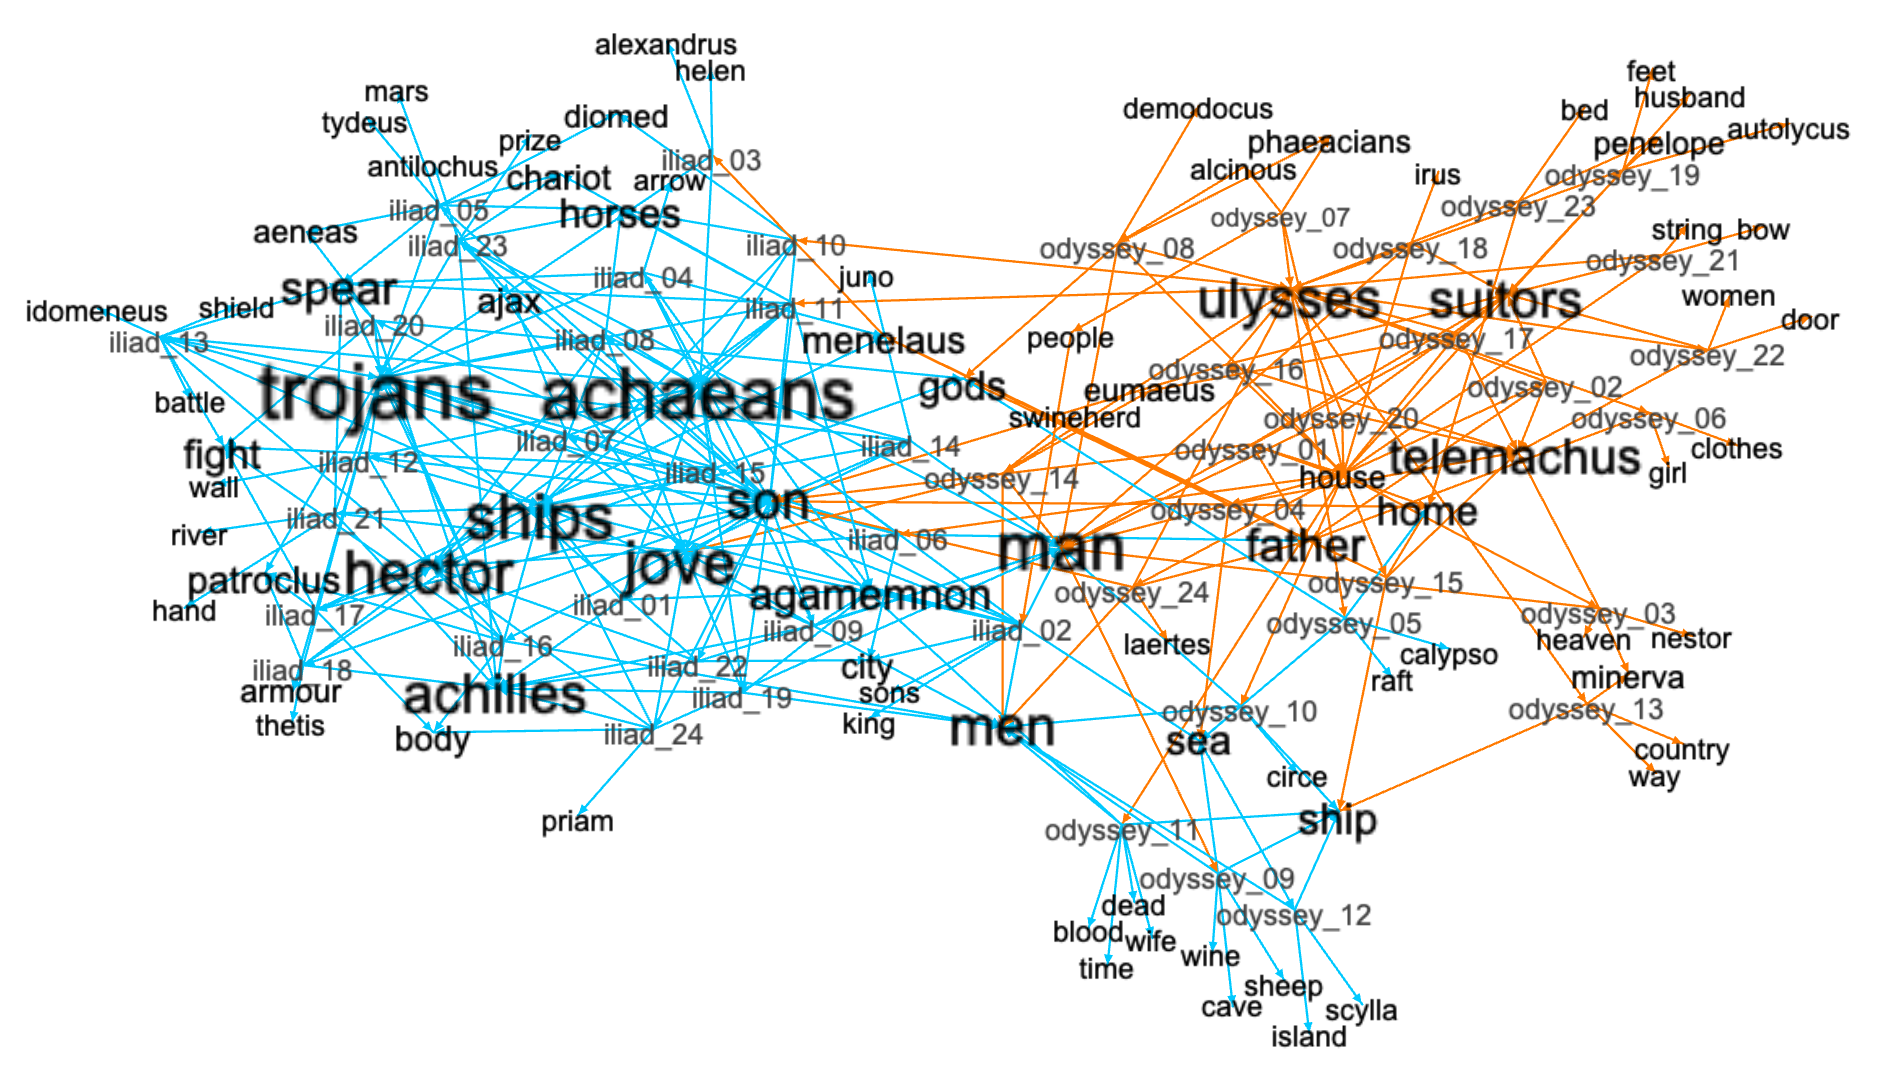
In the case of the Iliad and the Odyssey, there are forty-eight books ("chapters"). They are all written by the same person -- Homer. Using a variation of the venerable Term-Frequency Inverse Document Frequency (TFIDF) algorithm, I can compute and associate statistically significant keywords for each chapter. In this case, I save the node combinations as a Graph Modeling Language (GML) file, which just a more expressive version of an edges table. After importing the file into Gephi, and after taking various properties into account, I can visualize the graph in the following way:

Bibliographic network of the Iliad and the Odyssey
From the visualization I can assert a number of things:
- The corpus is about "trojans", "achaeans", "ships", "hector", "jove", "suitors", "father", "home", etc.
- After applying a clustering technique, I see the corpus falls into two distinct groups. One of the groups is the Iliad and the other is the Odyssey. And no, these groups were not generated by the names of titles but instead by their shared keywords.
- Since the word "man" is pretty much in the center of the graph, I assert that "man" is common theme throughout the corpus.
As outlined above "betweenness" is a property of graphs. Nodes are denoted as having a high degree of betweenness if one has to go through them to get to other nodes. Such nodes have a certain significance. Kinda like a social network, if there a person who connects many other people, then that person is a good person to know. After calculating betweenness and removing all of the nodes with a betweenness value of zero, the following nodes remain:
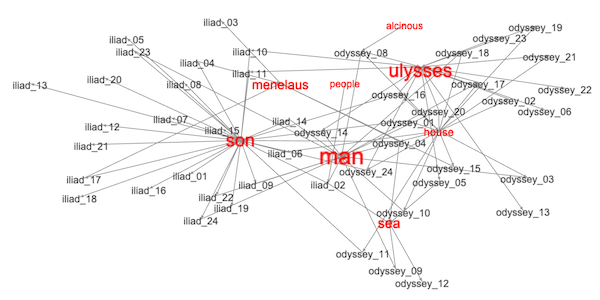
Nodes with non-zero betweeness values
I assert if one were to focus their attention on these remaining keywords and chapters, then one would be get a pretty good understanding of the corpus.
Modeling multiple authors
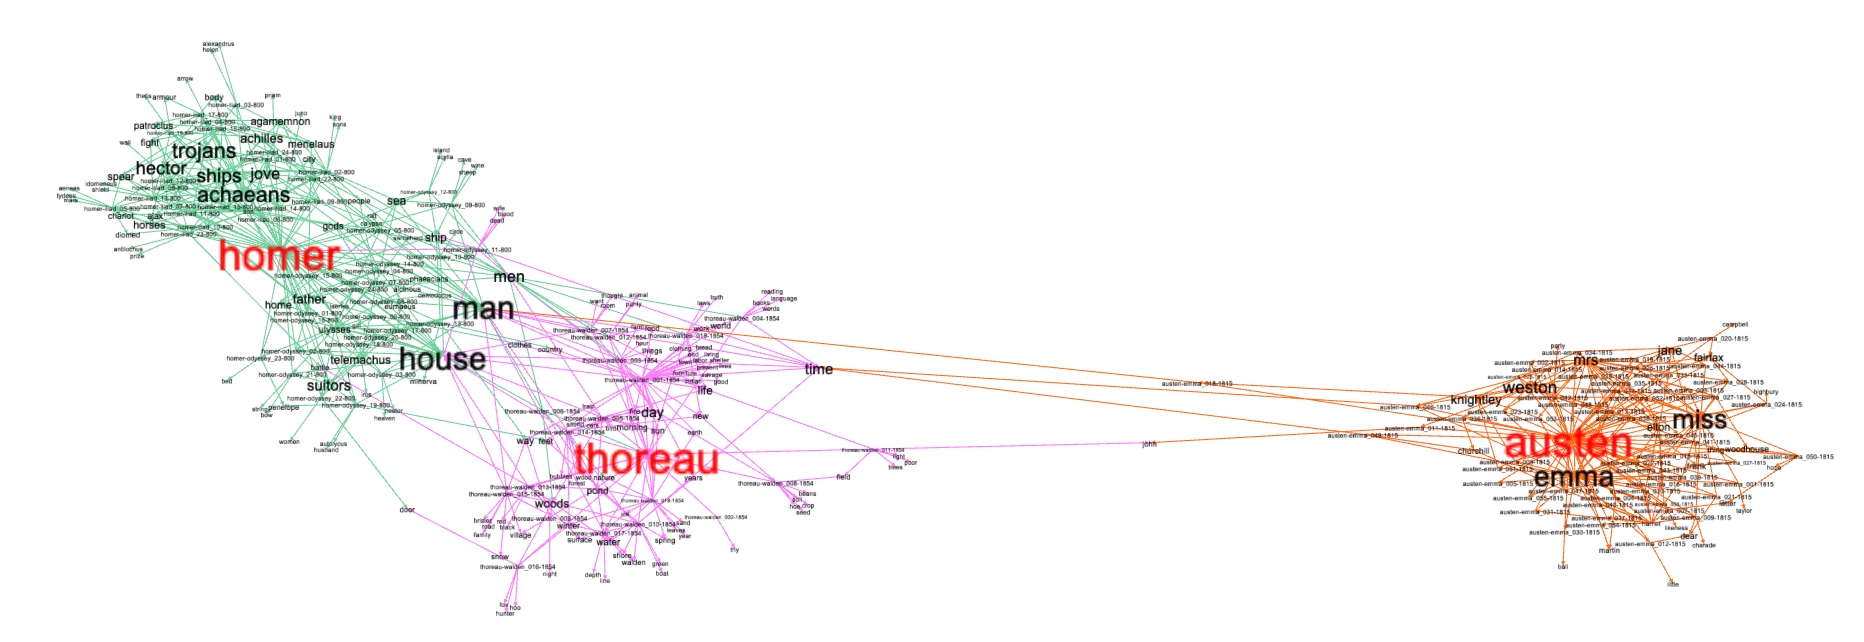
The Iliad and the Odyssey were written by a single person, but the process becomes much more interesting when multiple authors are combined into the same graph. Such is what I did below where I modeled the Iliad and the Odyssey (by Homer), Walden Pond (by Thoreau), and Emma (by Austen):

Comparing Homer, Thoreau, and Austen
From the result I assert a number of things:
- All three authors' works are distinctive.
- Homer's works (still) fall into two distinct groups.
- The works of Homer and of Thoreau are more similar because they share keywords such as "house", "man", and other things to a lesser degree.
- In terms of aboutness, Austen's work is not like the works of Homer nor Thoreau.
Granted, anybody familiar with the works of Homer, Thoreau, and/or Austen would say, "So what. I already know that." And my reply would be two-fold. First, "Yes, but what if you were not familiar with the works, then the illustration tell you a story and provides you with a sort of overview of the corpus." Second, "Yes, I know that but now you are equipped with a larger vocabulary for use and understanding. For example, what words are obviously understood and what words are unexpected? Discuss."
Summary
Network graphs -- collections of nodes and edges -- are a useful thinggs for the use and understanding of narrative texts. They provide the means to measure and observe the content of a corpus in ways traditional reading does not afford.
Epilouge
This essay, the edges table, the two GML files, and the Gephi file used to create the visualizations ought to be availble as a zip file at:
https://distantreader.org/blog/network-graphs-are-fun/network-graphs-are-fun.zip
Creator: Eric Lease Morgan <eric_morgan@infomotions.com>
Source: This is the original publication of this posting.
Date created: 2025-06-16
Date updated: 2025-06-16
Subject(s): network graphs;
URL: https://distantreader.org/blog/network-graphs-are-fun/