A light tale of bug hunting an Out Of Memory problem with SolrCloud.
The setup and the problem
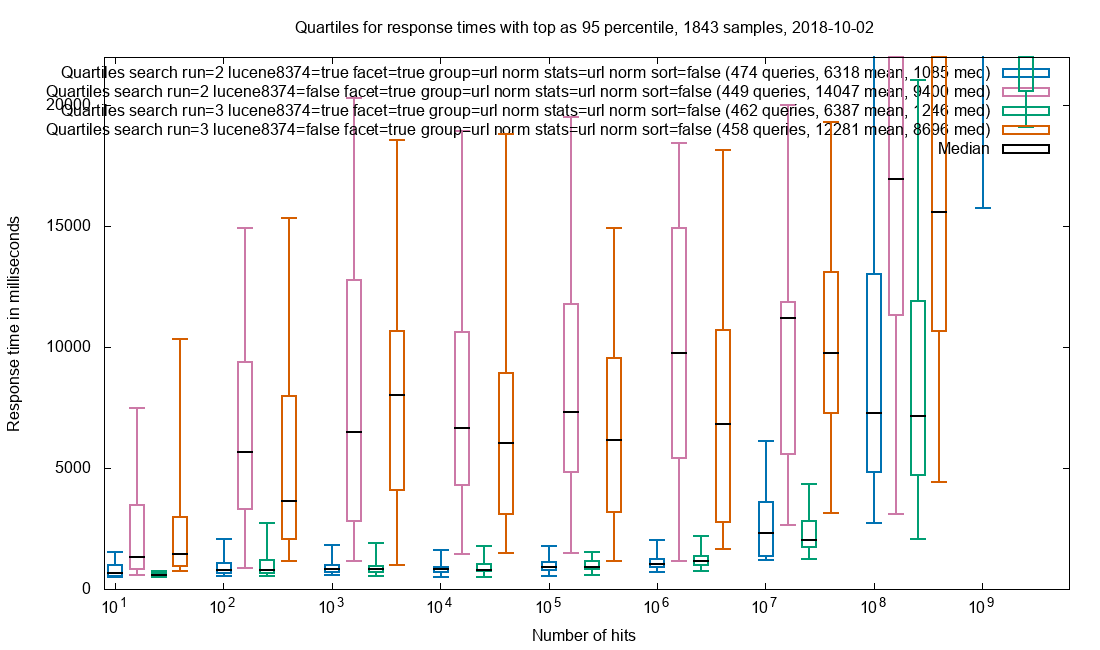
At the Royal Danish Library we provide full text search for the Danish Netarchive. The heavy lifting is done in a single collection SolrCloud made up of 107 shards (for a total of 94TB / 32 billion documents). All queries are issued to a Solr instance with an empty shard, with the sole responsibility of aggregating responses from the real shards.
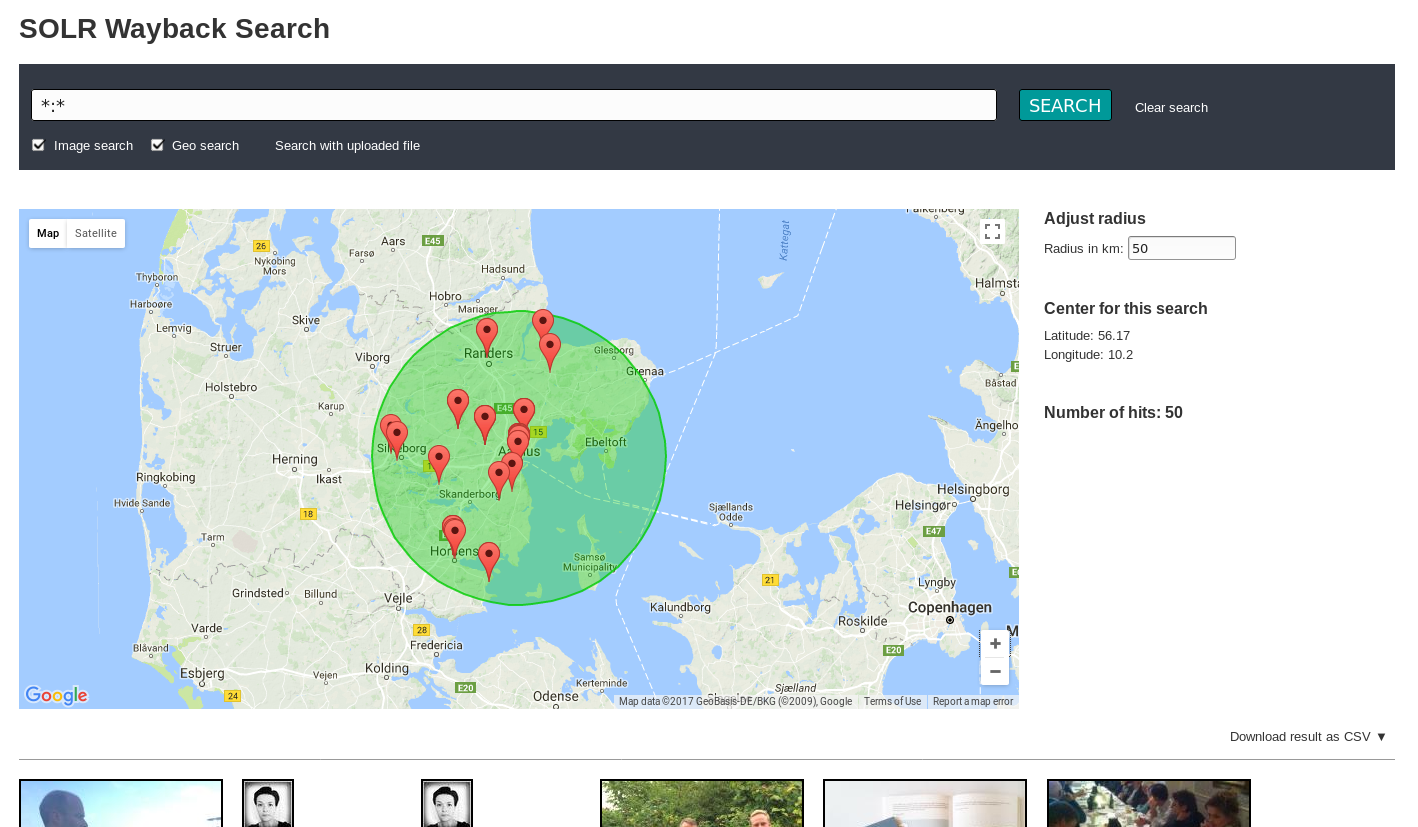
One of the frontends is SolrWayback, which is a JavaScript application backed by a middle layer acting as an advanced proxy; issuing searches, rewriting HTML, doing streaming exports and so.
The problem this time was that the aggregating Solr node occasionally crashed with an Out Of Memory error, where occasionally means that it sometimes took months to crash, sometimes days.
Clues and analysis
- Access to the Netarchive Search is strictly controlled, so there were no chance of denial of service or fimilar foul play.
- Log analysis showed modest activity (a maximum of 9 concurrent searches) around the time of the latest crash.
- The queries themselves were run-of-the-mill, but the crashing queries themselves were not logged, as Solr only logs the query when is has been completed, not when it starts.
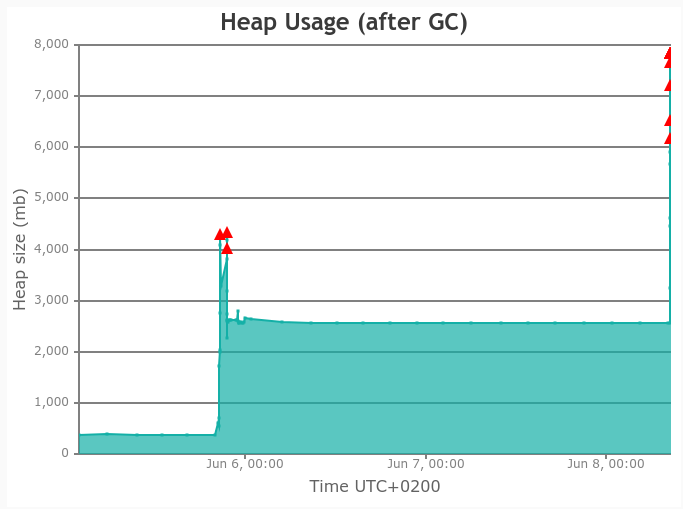
- The Garbage Collection logs showed that everything was a-ok, right up til the time when everything exploded in progressively longer collections, culminating in a 29 second stop-the-World and no heap space left.
Should be simple to pinpoint, right? And (plot twist) for once it was! Of course we chased the usual red herrings, but ultimately “dissect the logs around the problematic time slots” won the day.
Pop quiz: What is wrong with the log entries below? (meticulously unearthed from too many nearly-but-not-fully-similar entries and with timestamps adjusted to match graph-timezone).
1) 2020-06-04 19:29:06.285 INFO (qtp1908316405-618188) [c:ns0 s:shard1 r:core_node2 x:ns0_shard1_replica_n1] o.a.s.c.S.Request [ns0_shard1_replica_n1] webapp=/solr path=/select params={q=facebook.com&facet.field=domain&facet.field=content_type_norm&facet.field=type&facet.field=crawl_year&facet.field=status_code&facet.field=public_suffix&hl=on&indent=true&fl=id,score,title,hash,source_file_path,source_file_offset,url,url_norm,wayback_date,domain,content_type,crawl_date,content_type_norm,type&start=100&q.op=AND&fq=record_type:response+OR+record_type:arc&fq=domain:"facebook.com"+AND+crawl_year:"2015"&rows=20&wt=json&facet=true&f.crawl_year.facet.limit=100} hits=53532331 status=0 QTime=2181
2) 2020-06-04 19:33:32.418 INFO (qtp1908316405-619134) [c:ns0 s:shard1 r:core_node2 x:ns0_shard1_replica_n1] o.a.s.c.S.Request [ns0_shard1_replica_n1] webapp=/solr path=/select params={q=facebook.com&facet.field=domain&facet.field=content_type_norm&facet.field=type&facet.field=crawl_year&facet.field=status_code&facet.field=public_suffix&hl=on&indent=true&fl=id,score,title,hash,source_file_path,source_file_offset,url,url_norm,wayback_date,domain,content_type,crawl_date,content_type_norm,type&start=10020&q.op=AND&fq=record_type:response+OR+record_type:arc&fq=domain:"facebook.com"+AND+crawl_year:"2015"&rows=20&wt=json&facet=true&f.crawl_year.facet.limit=100} hits=53527106 status=0 QTime=6958
3) 2020-06-05 20:33:26.204 INFO (qtp1908316405-639768) [c:ns0 s:shard1 r:core_node2 x:ns0_shard1_replica_n1] o.a.s.c.S.Request [ns0_shard1_replica_n1] webapp=/solr path=/select params={q=facebook.com&facet.field=domain&facet.field=content_type_norm&facet.field=type&facet.field=crawl_year&facet.field=status_code&facet.field=public_suffix&hl=on&indent=true&fl=id,score,title,hash,source_file_path,source_file_offset,url,url_norm,wayback_date,domain,content_type,crawl_date,content_type_norm,type&start=10020&q.op=AND&fq=record_type:response+OR+record_type:arc&fq=domain:"facebook.com"+AND+crawl_year:"2017"&rows=20&wt=json&facet=true&f.crawl_year.facet.limit=100} hits=3785666 status=0 QTime=3650
4) 2020-06-05 20:34:36.078 INFO (qtp1908316405-641342) [c:ns0 s:shard1 r:core_node2 x:ns0_shard1_replica_n1] o.a.s.c.S.Request [ns0_shard1_replica_n1] webapp=/solr path=/select params={q=facebook.com&facet.field=domain&facet.field=content_type_norm&facet.field=type&facet.field=crawl_year&facet.field=status_code&facet.field=public_suffix&hl=on&indent=true&fl=id,score,title,hash,source_file_path,source_file_offset,url,url_norm,wayback_date,domain,content_type,crawl_date,content_type_norm,type&start=1002020&q.op=AND&fq=record_type:response+OR+record_type:arc&fq=domain:"facebook.com"+AND+crawl_year:"2017"&rows=20&wt=json&facet=true&f.crawl_year.facet.limit=100} hits=3781705 status=0 QTime=39489
5) 2020-06-05 20:43:25.303 INFO (qtp1908316405-639769) [c:ns0 s:shard1 r:core_node2 x:ns0_shard1_replica_n1] o.a.s.c.S.Request [ns0_shard1_replica_n1] webapp=/solr path=/select params={q=facebook.com&facet.field=domain&facet.field=content_type_norm&facet.field=type&facet.field=crawl_year&facet.field=status_code&facet.field=public_suffix&hl=on&indent=true&fl=id,score,title,hash,source_file_path,source_file_offset,url,url_norm,wayback_date,domain,content_type,crawl_date,content_type_norm,type&start=1002020&q.op=AND&fq=record_type:response+OR+record_type:arc&fq=domain:"facebook.com"+AND+crawl_year:"2018"&rows=20&wt=json&facet=true&f.crawl_year.facet.limit=100} hits=15355247 status=0 QTime=166414
If your answer was “Hey, what’s up with start!?” then you are now officially a Big Search Analyst. Your badge will arrive shortly.
For those not catching it (that included me for a long time):
- A search is issued with a query for facebook material from 2015 with the parameters
start=100&rows=20(corresponding to page 6 in a UI which shows 20 results/page). Response time is 2 seconds. - The same query is repeated, this time with
start=10020&rows=20. If the intent was to go to page 7 in the UI, we would expectstart=120&rows=20. Response time is 7 seconds. - The query is changed to facebook material from 2017, still with
start=10020&rows=20. Seems like someone’s URL hacking. Response time is 3½ seconds. - Same query as in #4, but now with
start=1002020&rows=20. Response time jumps to 39 seconds. - The query is changed to facebook material from 2018, with the previous
start=1002020&rows=20intact. Response time jumps to 166 seconds.
Locating the error
Time to inspect the code responsible for the paging:
if (this.start + 20 < this.totalHits) {
    this.start = this.start + 20;
}
Seems innocent enough and when we tested by pressing “Next” a few times in SolrWayback, it did indeed behave exemplary: start=0, start=20, start=40 and so on.
Looking further down we encounter this nugget:
/* Method used on creation, reload and route change to get query parameters */
getQueryparams:function(){
    this.myQuery = this.$route.query.query;
    this.start= this.$route.query.start;
    this.filters = this.$route.query.filter;
    ...
A quick appliance of console.log(typeof this.start) in the right place tells us that when the UI page is reloaded, which happens when the URL is changed by hand, the type of this.start becomes a string!
Loosely typed languages is a taste not acquired by your humble author.
Back to the code for skipping to the next page: this.start = this.start + 20;
If this.start is 100 to begin with and if it is a string, we suddenly have "100" + 20, which JavaScript handles by casting the number 20 to the string 20: "100" + "20" = "10020". That translates to page 502 instead of page 2, which of course is not what the user wants, but how does it become a memory problem?
SolrCloud internals and the smoking gun
The SolrCloud for Netarchive Search is a distributed one (remember the 107 shards?), so when 20 documents starting at position 10020 are needed, the master must request start=0&rows=10040 document representations from each shard, sort them and deliver documents 10020-10039. For our setup that means holding up to 10040*107 = 1 million document representations in memory.
The master node has one job and this it it, so it handles the load. Yes, it bumps heap requirements temporarily with a gigabyte or two, but that’s okay. It still delivers the result in 7 seconds.
So what happens when the user presses Next again? Yes, "10020" + 20 = "1002020". That’s a factor 100 right there, as we move 2 decimal places. And master has -Xmx=8g… Fortunately the logged request only matched 15 million documents, so the master Solr got by with a 4GB bump to the heap (the first spike in the graph) at that time.
Knowing what to look for (start=xxxx, where xxxx is at least 4 digits), it is simple to find the last relevant log entry before the crash:grep "start=[1-9][0-9][0-9][0-9]" solr.log.1
2020-06-08 08:29:43.898 INFO (qtp1908316405-709360) [c:ns0 s:shard1 r:core_node2 x:ns0_shard1_replica_n1] o.a.s.c.S.Request [ns0_shard1_replica_n1] webapp=/solr path=/select params={q=twitter.com&facet.field=domain&facet.field=content_type_norm&facet.field=type&facet.field=crawl_year&facet.field=status_code&facet.field=public_suffix&hl=on&indent=true&fl=id,score,title,hash,source_file_path,source_file_offset,url,url_norm,wayback_date,domain,content_type,crawl_date,content_type_norm,type&start=4020&q.op=AND&fq=record_type:response+OR+record_type:arc&fq=domain:"twitter.com"+AND+content_type_norm:"html"+AND+crawl_year:"2015"&rows=20&wt=json&facet=true&f.crawl_year.facet.limit=100} hits=53598240 status=0 QTime=3835
Here we have start=4020 and 54 million hits. The aggregating Solr died 10 minutes later. $10 says that the request that crashed the master Solr was for the same query, but with start=402020.
As 402020 document representations * 107 shards equals 43 million document representations, the master JVM might have survived with -Xmx=12g. If not for the huge amount of tiny objects overloading the garbage collector.
Fixes and take aways
Easy fix of course: Cast this.start in the JavaScript layer to integer and enforce an upper limit for start & rows in the middle layer for good measure.
For next time we’ve learned to
- Closely examine slow queries (Captain Obvious says hello)
- Keep GC-logs a few restarts back (we only had the current and the previous one to start with)
- Plot the GC pauses to see if there are spikes that did not crash the JVM (trivial to do with gceasy.io), then inspect the request logs around the same time as the spikes