
1. Introduction
Rural communities across the United States continue to experience the aftermath of industrial restructuring, globalization, the lingering effects of past recessions and the ongoing global pandemic and related impacts. The National Council on State Legislatures (Farquhar, 2018) reports that, in comparison to suburban and urban communities, rural communities have stagnate or neglected infrastructure (roads, bridges, water, sewer, etc.) among the many challenges that they face. Many rural communities are also disproportionately impacted by a wide spectrum of social and community challenges due to geography (remoteness), weak or declining tax base, lack of employment, declining population, poor community health and many other factors. These factors, in part, drove a population loss in rural areas from 2010-2016 and have also contributed to lower economic growth rates than in urban counties since the 1990s (Cromartie, 2017).
Rural America is at a competitive disadvantage and economic and community development are obstructed by the factors identified above along with important economic development factors like access to capital and other small business development infrastructure. In fact, community banks, which often serve rural communities, have been declining for approximately 2 decades (Reichow, 2017). Community banks hold a larger share (35%) of small business loans as a percent of their total assets than larger banks (2%) (Reichow, 2017) and as a result there are fewer small business loans being offered today than a decade ago. Rural start-ups also receive less than 1% of venture capital resources (Jacob, 2018). While the geographic challenges for rural communities are well known, rising spatial inequalities related to access to capital, innovation and other important small business and entrepreneurship infrastructure are a growing concern (Florida, 2018).
In contrast, women owned businesses in the United States have been increasing over the past several years. Specifically, between 2014 and 2019, women-owned business increased 21%, employment 8% and revenue 21% (American Express, 2019). Respectively, women and minority owned firms have seen an 8% increase and no change in Small Business Innovation Research (SBIR)/Small Business Technology Transfer (STTR) grants from 2005 to 2017 (Liu & Parilla, 2019). Liu & Parilla (2019) report that the vast majority of this funding goes to the 100 largest metropolitan areas. Part-time entrepreneurship for women, often referred to as side-entrepreneurship, has increased 39% between 2014-2019 (American Express, 2019). While these numbers do not highlight rural/urban differences specifically, the spatial distribution of female entrepreneurship, generally, supports the underlying challenge of gender disparities across the rural/urban spectrum (American Express, 2019).
Entrepreneurship has long been held as one of the most critical tools to a broad based economic development approach for any community and rural communities are a critical component of our nation’s social and economic fabric. Rural communities contain 72% of the nation’s land, approximately 46 million Americans and 2305 counties across the nation. Entrepreneurship is critically important for rural communities for all the same reasons it is for suburban and urban communities. Although, as a driver of wealth creation, community reinvestment and potentially revitalization, it is of critical importance that we understand and study the landscape of rural entrepreneurship and the demographic factors related to it (Foster, 2001). Moreover, entrepreneurship can enhance community leadership, develop human capital, improve community pride and optimism and other key factors that support the short and long run health of a community (Foster, 2001).
Even given the value and impact of entrepreneurship for all communities, there remain substantive gaps in our knowledge related to rural entrepreneurship and particularly gender variation(s) in conjunction with rurality. In this vein, we propose to utilize the Panel Study of Entrepreneurial Dynamics (PSED), a representative dataset of American individuals trying to create new firms, to better understand differences between rural, non-rural and female led nascent rural firms in terms of their ability to stay engaged in the entrepreneurial process and to earn a profit. Using the resource-based theory lens of the firm, this research will begin to characterize some of the similarities and differences driving rural firm success and rural female-led rural firm success. The PSED database is the most comprehensive, longitudinal database on entrepreneurship in the United States. The geography variable in PSED has not been exploited in the literature stream and provides an important lens in which to study entrepreneurship. Cox and logistic regression models will be examined to understand the time to quit, time to profit, and the likelihood of firm survival and profit generation for rural, non-rural and female led-rural firms. This type of research is important to understand the unique needs of entrepreneurs in all types of settings. adds to the literature by leveraging the PSED to study entrepreneurship in the context of both geography and gender.
2. Prior studies on rural, women entrepreneurship and external funding
Previous studies in entrepreneurship research indicate that receiving external funding is critical for entrepreneurial success (Hechavarría et al., 2016; Liao et al., 2008). While personal wealth invested in the new venture decreases the likelihood of business’ discontinuity, external funding increases the probability of successfully creating a new firm. As Liao & Welsch (2003) revealed, the type of finance utilized influences a new firm’s time in gestation during the earliest phases of the entrepreneurial creation process.
Prior studies have also found that being funded is related to personal characteristics of the entrepreneur such as wealth, ethnicity, and other intangibles (Frid, 2014; Frid, Wyman, & Coffey, 2016; Frid, Wyman, Gartner, et al., 2016; Gartner et al., 2012). Wealth, race, previous experience, and location emerged as drivers for acquiring external start-up financing. Low-wealth entrepreneurs are less likely to get external funding, and even when they rec,eive funding, lower amounts are granted compared to wealthier entrepreneurs (Frid, 2014; Frid, Wyman, & Coffey, 2016; Frid, Wyman, Gartner, et al., 2016; Reynolds, 2011). In Frid (2014), it is shown that race and prior start-up experience affect the source of funding acquired by nascent entrepreneurs. Although with a weak significance, Frid, Wyman, & Coffey (2016) found that nascent entrepreneurs living in rural areas are less likely to acquire external funding than those in metropolitan areas. Thus, several characteristics, including the location of the entrepreneurs, may prevent them from receiving external funding.
Further, research shows that the more of an owner’s funds used to create a business, the greater the chances of being externally funded (Frid, 2014; Gartner et al., 2012). Rural areas in the U.S. are by definition less affluent, with an annual median income of $57,652 for all U.S. counties from 2012-2017, $47,020 for mostly rural counties, and $44,020 for completely rural counties (Guzman et al., 2018). Even though rural and urban individuals in America show similar poverty rates, the former are more likely to experience persistent poverty. For over a decade, rural household median income has averaged 25% below that of urban households (Bishaw & Posey, 2016; USDA, Economic Research Service, 2021). Consequently, on average, rural entrepreneurs may be less likely to rely on their personal funds to support their new businesses as the typical metropolitan entrepreneur. Given the lack of own capital in rural settings, external funding could significantly impact the rural entrepreneur’s success, as loans constitute a key source of entrepreneurial financing (Robb & Robinson, 2010).
The unavailability of funding to rural entrepreneurs may result in self-funding using retained earnings or family wealth. Eschker et al. (2017) investigated the factors associated with rural entrepreneurs’ success and found that the reliance on external funding increased after a new rural firm operated for a couple of years. During this period of operations, personal contributions also decreased. Interestingly, Eschker et al. (2017) also revealed that using own or family savings combined with external funds was highly positively correlated with new rural venture profits. It also seems plausible that rural entrepreneurs, in comparison to urban counterparts, use more personal funds during the start-up gestation phase. The last appears to be especially important for minority entrepreneurs, i.e., African Americans and Hispanics (Gartner et al., 2012).
2.1 External funding and women entrepreneurs
Given the critical role of external funding for entrepreneurial success and the perceived need to develop a more diverse and inclusive entrepreneurial landscape, it is crucial to review the barriers women entrepreneurs face in this regard. Despite the steady growth of women-owned businesses in America (American Express, 2019), they continue to face numerous obstacles to entrepreneurial success. Financing new projects are one of these challenges. Kwong et al. (2012) found that a more significant proportion of women are constrained by financial barriers than their male counterparts.
However, other studies have found that nascent female entrepreneurs are no less likely to receive funding than men when controlling for several variables (Frid, Wyman, & Coffey, 2016). Despite this debate, on average, in 2021, women receive almost $5,000 less on total loan amounts than men in the U.S. While male entrepreneurs receive an average loan size of $43,916, businesswomen receive an average loan size of $38,942.[1] Importantly, working with a national representative database of nascent entrepreneurs, Coleman (2007) found that non-externally funded women-led nascent firms are significantly associated with firm growth, speculating this effect is more pronounced due to the use of their own funding. However, those same women-nascent entrepreneurs are less likely to earn profits when reluctant to seek external funding (Coleman, 2007). Also, Coleman (2007) did not find any effect of financial capital on profitability nor growth of women-owned firms. However, financial capital resulted in being an essential factor for male-owned start-ups’ profitability and growth. As this literature illustrates, the debate remains on the effect of external funding on women-led venture performance, especially in empirical studies.
Also, key supply and demand factors inhibit women entrepreneurs from getting external funding. On the supply side, investors typically draw more attention to male entrepreneurs than women entrepreneurs (Brooks et al., 2014). Also, excluding networks (Eddleston et al., 2016) and the gender biases that exist in investor and banking decision making (Alesina et al., 2008) are other factors that inhibit women from obtaining external funding. Boden & Nucci (2000) argued that women are more comfortable with achieving stability than with growth from entrepreneurial activities and, usually have less access to external funding than male entrepreneurs. This situation leads to many women focusing their entrepreneurial intentions on service sectors that require low-level technical investments during the initial stages.
Looking on the demand side, women are significantly more reluctant than men to apply for a loan, even though they were no more likely to be turned down if they did apply (Coleman, 2002). The “discourage borrower” phenomenon helps identify a creditworthy individual who does not apply for loans or other forms of external funding due to fear of denial. Compared to men, women perceive more decisive financial obstacles to entrepreneurship, which may inhibit them from pursuing external funding (Sena et al., 2012). Consequently, women are more reliant on personal rather than external financial capital sources (Coleman & Robb, 2016). Other factors associated with the inhibition of women to get external funds are less predilection to launch growth-oriented firms (Bitler et al., 2001), being fewer risk-takers (Sánchez Cañizares & Fuentes García, 2010), and less financial knowledge (Lusardi & Mitchell, 2014). Different motivations towards entrepreneurship can also shape their perceived need to obtain external funds: Brush et al. (2008), using expectancy theory, found that men are motivated primarily by financial gains, self-realization, and autonomy to start a company. In contrast, women have a broader set of factors motivating them to start a new company. Also, Manolova et al. (2012) reveal that men want to grow their new businesses to achieve financial success, while women want to achieve growth for a complex series of reasons, financial success being just one of them.
2.3 Rural women entrepreneurs and external funding
Fostering entrepreneurship emerges as an effective strategy to expand new economic activities that can support economic growth in rural areas (Li et al., 2019). As reviewed previously, external funding is a powerful resource to foster the development of new businesses. Both groups, rural entrepreneurs and women entrepreneurs, struggle to get external funding. Consequently, rural women entrepreneurs might face specific challenges in this regard which are worth examining.
Broadly, rural community characteristics can create barriers for women entrepreneurs to obtain external funds. To name a few, a low endowment of resources, such as in financial capital (Kungwansupaphan & Leihaothabam, 2016), human capital (Prasad et al., 2013; Tambunan, 2009), and social capital (Prasad et al., 2013) are all necessary for entrepreneurial development for women rural entrepreneurs and may be lacking in these settings. This lack of critical resources for entrepreneurs is combined with a low population density in rural communities, limiting the local demand (Dabson, 2001). Thus, it should not be a surprise that female business ownership in rural communities is associated with low firm performance (Eschker et al., 2017). However, research regarding how external funding impacts minorities such as rural women entrepreneurs remains absent in the American entrepreneurship research literature.
External funding is a critical financial resource and understanding the role and relative importance of external funding for those entrepreneurs in rural communities is an important area of exploration. However, the lack of external funding sources for rural communities in America has been highlighted, even from the public sector (Pages & Markley, 2004). Further, the knowledge that external funding obstacles disproportionately affect rural women entrepreneurs is well-known internationally. Financial capital fosters rural women to engage in business activities and influences their strategic decisions, but its effects vary with having (or not) prior entrepreneurial experience (Kungwansupaphan & Leihaothabam, 2016). Thus, receiving external funding could also be related to prior entrepreneurial experience, as pointed out for entrepreneurs in general by Frid, Wyman, & Coffey (2016).
Internationally, microloans have often been a feasible solution for rural women entrepreneurs and their performance, especially in Southern Asia (Afrin et al., 2009; Ghouse et al., 2017; Jyoti et al., 2011; Kungwansupaphan & Leihaothabam, 2016). However, the only assessment for developed countries comes from the study of Brana (2013), who found that gender is a decisive factor in the amount of micro-credit provided to borrowers when controlling for other factors in France’s borrower firm profile. Even with the clear impact of microloans for women entrepreneurs, microloans still reinforce gender inequalities among female and male-led businesses.
3. The resource-based theory applied for rural women-led businesses
Under the influence of Edith Penrose’s Theory of the Growth of the Firm (Penrose, 1959), the resource-based theory aims to answer why some firms perform better than others. In entrepreneurship research, resource‐based theory conceptualizes new firms as bearing a set of resources at their initial stages that confer them (or not) with competitive advantages (Barney, 1991; Hall, 1992; Wernerfelt, 1984), influencing their short- and long-term performance. From the viewpoint that entrepreneurship is a creative process of combining opportunities and resources (Shane & Venkataraman, 2000), the individual entrepreneur creates a unique combination of tangible and intangible resources to compete against existing rivals in the market. This process begins with a business idea, and in transforming the idea into a reality, the entrepreneur moves forward until the need to identify how to acquire additional tangible and intangible resources for the start‐up (Timmons, 1994).
An essential resource, financial capital, often comes initially from personal, family, and friends. External funding sources are often unreachable for nascent entrepreneurs. Therefore, the nascent entrepreneur’s initial capital is the one that he or she owns or can raise to go on to the preliminary stages of the firm creation process, which is especially true in rural settings (Eschker et al., 2017). Frid (2014) and Gartner et al. (2012) analyzed new companies’ capital structure in the nascent context, demonstrating that nascent entrepreneurs tend to use personal funds as the primary financing source during the initial stages of the entrepreneurial process. Hechavarría et al. (2016) challenged these results by applying event history analysis and proving that a capital structure composed of external funds (equity) is positively associated with accelerating new firm creation. Hechavarría et al. (2016) also found that firms whose capital structure consists of greater amounts of external loans and or equity are less likely to disengage from the entrepreneurial process. In this sense, external capital resources could add more value to investee firms than private savings. As a result, there is an association between monitored external funding and firm creation and survival. For this reason, the first set of hypotheses in this research states;
H1a: Receiving monitored external funding de-accelerates abandoning the process of new firm creation for nascent rural firms.
H1b: Receiving monitored external funding reduces the timing for achieving profitability for nascent rural firms.
H1c: The amount of monitored external funding is associated negatively with the probability of abandoning the firm creation process for nascent rural firms.
H1d: The amount of monitored external funding is associated positively with the probability of achieving profits for nascent rural firms.
Understanding nascent business performance in rural settings through hypotheses H1a-d is the first component of this research. Next, we will examine how external funding impacts the gap(s) between urban and rural female-led new businesses. In doing so, we start to narrow the focus until understanding the role of monitored external funding on female urban and female rural businesses’ performance.
As aforementioned, funding is a crucial resource in entrepreneurial development. As reviewed, women entrepreneurs have difficulties in receiving external funding (Alesina et al., 2008; Bitler et al., 2001; Coleman, 2002, 2007; Coleman & Robb, 2016; Lusardi & Mitchell, 2014; Sánchez Cañizares & Fuentes García, 2010; Sena et al., 2012). Thus, from a resource-based theory perspective, receiving external funding reduces an entrepreneur’s need for capital and could be a strategic resource for a deprived group such as rural women entrepreneurs. Thus, the following set of hypotheses seeks to test if receiving external funding affects rural women’s firm performance.
H2a: Women-led nascent firms that received monitored external funding are slower than those not funded to abandon the firm creation process in urban and rural nascent settings.
H2b: Women-led nascent firms that received monitored external funding are faster than those not -funded in creating a profitable nascent firm in urban and rural nascent settings.
H2c: The amount of monitored external funding is associated negatively with the likelihood of abandoning the firm creation process for women-led nascent rural firms.
H2d: The amount of monitored external funding is associated positively with the likelihood of profitability for women-led nascent rural firms
From the resource-based perspective, other intangible resources are also of interest and important for this study. Perhaps knowledge is the most important of these resources, whether that knowledge comes from the entrepreneur or other new firm members. Knowledge is the basis for the rent-earning potential of the other resources the firm possesses (Grant, 1996). Knowledge is not easy to exchange: there is an essential distinction in this regard between tacit and codified knowledge (Nonaka & Takeuchi, 1995; Polanyi, 1975). Tacit knowledge is an individual’s internalized information, which is tough to formalize and communicate with other individuals. Codified knowledge is formalized and standardized information that we all have access to. Thus, codified knowledge is more straightforward to transfer between individuals. Studies have investigated the effects of these different forms of knowledge on new firm performance through entrepreneurs’ formal education (codified knowledge) and industry‐specific, managerial, and prior entrepreneurial experience (tacit knowledge) (Burton et al., 2002; Delmar & Shane, 2003; Hellmann & Puri, 2002; Muñoz-Bullon et al., 2015; Shane, 2000; Singh & Crump, 2007).
In summary, this research argues that where an entrepreneur has a high human capital endowment, there is a positive association with the opportunity for entrepreneurial success. Consequently, human capital is a key resource that affects the entrepreneurial process, increasing the ability to exploit latent opportunities and even acquire other resources, such as external funding. Frid, Wyman, & Coffey (2016) found that higher levels of managerial experience and education are positively associated with the reception and more significant amounts of external funding received by nascent entrepreneurs in the U.S.
Social capital is another essential resource, which refers to entrepreneurs’ interpersonal relationships. Like any other kind of capital, this resource is accumulated through entrepreneurs’ careers (Burton et al., 2002). Social capital accumulation simplifies information access and identifies other tangible resources such as financing tools (Casey, 2014). Entrepreneurs that are more skilled in taking advantage of their networks and connections use their social capital differently from the rest (Liao & Welsch, 2003). Thus, social capital can be a critical source of support for rural women to pursue entrepreneurial activities by simplifying their recognition of potential market opportunities and attracting external investors through their ties beyond their immediate communities.
4. Methods
The Panel Study of Entrepreneurial Dynamics (PSED) is a representative longitudinal dataset of individuals trying to start businesses in the U.S. This dataset offers substantial advantages, such as avoiding survivorship and the recall biases observed in other longitudinal studies for entrepreneurship (Gartner et al., 2012). PSED-I consists of a maximum of four waves for every individual (nascent entrepreneurs) collected between 1999 and 2003, and PSED-II has a maximum of six waves for each nascent entrepreneur, collected between 2005 and 2012. PSED-I and II were matched in a single dataset, which is the source of this study. 2044 cases of nascent new firms resulted from matching PSED-I and II. However, the number of cases analyzed varies for each model since there are some considerations to account for independently (no-appropriated cases included in the analysis, outliers), and this will be explained in the analysis section.
The entrepreneurial gestational phase is the period under observation in this analysis. Gestation starts when a nascent firm is conceived (the conception). Gestation is completed when a nascent firm disengages from the entrepreneurial process or when finally, it becomes a profitable firm. Conception occurs when two intended activities to create a firm have been taken within a twelve-month window[2] (Reynolds & Curtin, 2008, 2011).
4.1 Dependent variables
The analysis focuses on the time taken from firm conception until disengaging from the entrepreneurial process, comparing non-rural, rural, and rural-women nascent firms. This event occurs when an entrepreneur reports that no one is managing the start-up anymore. The second model tests the dependent variable of the time to reach six months of profits in a row. The convention among PSED analysts is to treat this variable as “firm creation”: the event occurs when the entrepreneur reports profits for the first time, defined as positive cash flow for six of the previous twelve months in PSED-II and three of the past twelve months in PSED-I (Reynolds & Curtin, 2008). When analyzing both the disengagement from the entrepreneurial process and profitability status, those nascent firms that have not had one of these outcomes are labeled as “still trying” and will be the right-censored cases. Next, the analysis aims to test the same variable but with another modeling strategy (see 4.4), focusing on how some resources of non-rural, rural, and women rural entrepreneurs affect disengagement and profitability. For this analysis, the dependent variable is dichotomous: first, quit =1 for those firms disengaged from the entrepreneurial process and =0 otherwise. The variable profits =1 for those nascent firms that reach six months of profitability during the entrepreneurial process and =0 if not.
4.2 Independent variables
Based on resource theory, we develop variables to capture how resources impact rural and rural women-led nascent firms. In the case of financing resources, this study includes the variable mef, a categorical variable that measures whether the start-up has not received any external monitored funding (=0) or has received it (=1). The percentage of personal funding of the total funds invested in the start-up, funper, measures entrepreneurs’ personal resources in their nascent firms. Frid, Wyman, & Coffey (2016) and Gartner et al. (2012) found that the more personal funds invested in the start-up, the higher the chances of obtaining external funds, subsequently affecting positively on nascent firms’ survival. Also, entrepreneurs’ household net-worth[3] (hnw, corrected for 2005 prices) is a proxy of the individual’s wealth. The last variable aimed to measure entrepreneurs’ financial resources is totfund, which is the total funds invested in the nascent firm by the entrepreneurs or group of entrepreneurs, irrespective of the source.
PSED-I only asks the educational level of the respondent. Thus, codified human capital (formal education) is quantified using a categorical variable. The base category is high school degree or less (=0); have finished a tech, community, or have some college studies (=1), those who finished college or some graduate training (=2), holding a Master’s degree, (=3), holding a Ph.D. degree (=4) and this classification is just for the survey respondent. Categories 3 and 4 are composed into one due to the small number of cases holding a Ph.D. for models 6-13.
Tacit human capital is measured as follows. The variable indexp measures the number of years of experience for each owner in the same industry that the nascent firm aims to operate. Similarly, stpexp, measures the number of prior start-up attempts for each entrepreneur. Both indexp and stpexp are measured for each PSED wave; thus, it is a time-varying variable when evaluating time-to-events since entrepreneurs leave and join the nascent firm during this longitudinal survey collecting process. The variable mang measures the entrepreneur’s managerial experience in years but measured only in the first interview, and thus, it is a fixed independent variable.
Following the resource-based theory, another intangible resource is social capital. The variable bonding measures the total non-owner family helpers that the entrepreneurs declare of importance for the development of their nascent firm. The variable bridging counts the number of non-family and non-friend helpers, aiming to measure the entrepreneurs’ external network.
Lastly, when evaluating the amounts of funding in models 6-13, different independent variables are introduced. The amount of external monitored funding, monfun, is the same applied by Gartner et al. (2012), Frid, Wyman, & Coffey (2016), and Frid (2014). Virtually all entrepreneurs use personal and team members’ money to invest in their projects. However, in terms of obtaining funding from external sources, Gartner et al. (2012) note that two categories arise with distinct levels of oversight and involvement: unmonitored and monitored funding sources. The former involves funding coming from family members, friends, a second mortgage, or credit cards. These sources are not strictly monitored, but they are measured using the variable unmonf. Also, perfun measures the amount of personal funds invested. All these variables are adjusted to 2005 prices and are measured in logs.
4.3 Control variables
The firm size affects disengagement from the entrepreneurial process, as Carroll & Hannan (2000) have shown. The last is controlled using a time-varying variable that measures the number of owners of the nascent firm. Also, a categorical variable labeling the principal economic activity of the nascent firm is included. This variable is labeled 0 for nascent firms in the business service market, =1 extractive sector, =2 transforming sectors, =3 consumer-oriented sectors, and =4 for other sectors/N.A. Finally, following Delmar & Shane (2003), an entrepreneur’s growth preference is a dichotomous variable, accounting for entrepreneurs’ over-optimistic inclinations, leading them to undervalue competition and overestimate growth aspirations.
4.4 Models
Model results are illustrated in Tables 1-2. These models utilize a Cox (1972) regression analysis to examine the time to disengage from the entrepreneurial process and time to reach profitability. A Cox model is essentially a regression model normally applied to explore the association between the time until an event occurs (dependent variable) and one or more independent variables. In our case, these events are the time to exit the entrepreneurial process and the time to become a profitable firm by using the definitions highlighted above.
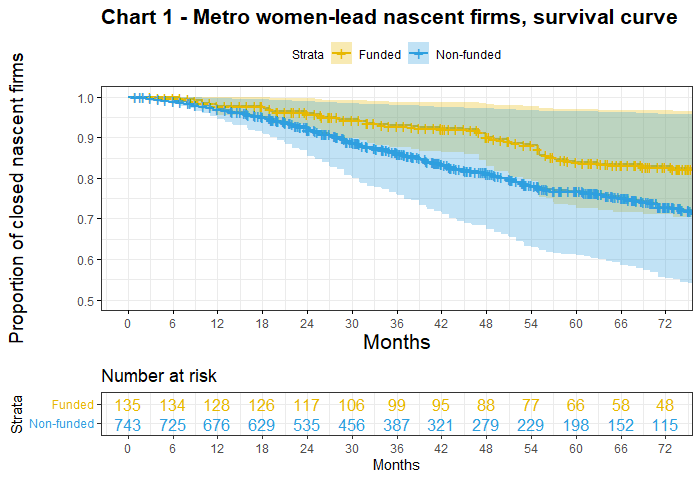
Models 1-2 include rural and female-led firm dummy variables to understand the association between rurality and gender on entrepreneurial success and profitability. Survival analysis of female-led nascent firms in metro and rural settings is presented in Figures 1 and 2 as survival curves. These models explore the importance of external funding for rural, female-led ventures as it relates to firm survival.
Tables 3 and 4 present the results of logit models, which examine the hypotheses focused on disengagement from and profitability during the entrepreneurial process. Three logistic (logit) models, one for all nascent firms, one for nascent rural firms, and the last one for rural, nascent, female-led firms, are analyzed for firm disengagement and profitability, respectively. Logistic regressions are used to examine the relationship between a binary response probability and a set of explanatory variables. In our case, the binary response variables are quitting from the entrepreneurial process and having reached six months of profits in a row or not. Model results highlight the importance of externally monitored funds and, while mixed on rurality and gender, underscore the importance of additional research on entrepreneurship’s rural and gender-related questions of entrepreneurship.
5. Results
5.1 – Time to close firm’s operations
In this sample, 630 firms closed their operations, and 495 are censored (still trying to become profitable). Table 3 presents the empirical results. Model 1, Table 1, incorporates the control variables plus a dummy variable, “Receiving external funding.” Model 2, Table 1, includes all of the variables mentioned above and two dummies, rural firms, and female-led ventures. One of the independent variables at least contributes significantly to explain the event of interest’s duration. The likelihood-ratio chi-square indicates the difference between -2 partial log-likelihood for the model with 20 covariates for Model 1 and 22 for Model 2 and the null model with no independent variables. As its p-value is <0.001, it is feasible to reject the null hypothesis of the model’s overall significance. The AIC test further allows us to say that Model 2, modestly, explains a more significant portion of the variance of the dependent variable than Model 1 does.
Table 1 reports each models’ hazard ratios and exponentiated coefficients. If the hazard ratio is greater than 1 for a variable of interest, higher levels of that independent variable are associated with a higher incidence of disengagement, controlling for other variables in the model. The exponentiated coefficients help to understand the size of the relationship between variables and time to nascent firms’ closure.
Models 1 and 2 indicate that nascent firms granted with monitored-external funding have the disengagement hazard of 61% of those non-funded (p-value<0.001). The inclusion of rural and female dummy variables did not change its significance or this relationship’s strength. The “female” dummy variable inclusion did not show any significant relationship with the time to disengage from the entrepreneurial process. However, nascent rural firms show a higher hazard of stopping their operations than non-rural nascent ventures: the odds of stopping operations of nascent rural ventures are 1.25 compared to non-rural ventures, holding all variables constant (p-value <0.05), confirming hypothesis H1a.
Models 1 and 2 also show important relationships between an independent variable and the time to close operations. The percentage of personal funding invested in the firm is crucial to understand disengagement from the entrepreneurial process. With an increase in the percentage of personal funds invested in the new venture, closing operations’ hazard goes down by an estimated 2.2% (p-value<0.001). Unsurprisingly, entrepreneurs’ household net-worth is negatively associated with disengaging from the entrepreneurial process in both models (p-value<0.05).
Human capital variables are also of importance in understanding quitting rates. Since our variable is a categorical one, every coefficient for an educational category represents a comparison to the base category (high-school or less) of the odds of disengaging. In Model 1, holding other variables constant, those entrepreneurs with a community college degree or some college training show a hazard rate of disengagement of 78% of those with high school or less (p-value <0.05). Entrepreneurs holding a master’s degree account for a hazard rate of disengagement of 70% of those with a high school education or less, but this relationship’s strength is weak (p-value <0.1). Entrepreneurs that reached a Ph.D. level show a hazard rate of disengagement of 46% of those with a high school education or less. Interestingly, when female and rural dummies are entered in Model 2, these relationships lose strength, reducing their significance, which might be related to a lower value of the human capital level for potentially more disadvantaged female and rural entrepreneurs.
Industry experience and managerial experience are both explicative of the time it takes a firm to close its operations. These tacit human capital variables are related to this outcome in opposite directions. Each additional year of industry experience of the nascent venture owner reduces the monthly hazard of closing operations by -1% (p-value<0.05). In the case of managerial experience, an additional year of experience increases the monthly hazard of quitting by 0.6% (p-value<0.01). This last association could mean that entrepreneurs with higher managerial experience could be more aware of when they should close their business than those with a lower managerial experience. The only sector that accounts for a significant relationship with the time to exiting the entrepreneurial process is the transformative sector (compared to the business service sector, base category). In this case, the hazard rate of abandoning the entrepreneurial process for nascent firms in the transforming sector is 130% of those in the business service sector (p-value<0.05). The power of this relationship decreases after introducing female and rural dummies in Model 2.
Figures 1 and 2 presents the survival curve estimates for women-led nascent ventures in metro and rural settings, respectively. The number 1 on the y-axis represents the total nascent firms. Any reduction from 1 means the proportion of nascent firms that disengage from the entrepreneurial process given the time that has passed on the x-axis. Based on these estimates, the survival curves of women-led firms that received external funding in metro areas are virtually indistinguishable from the non-funded (Figure 1); the curves’ confidence intervals are appreciably superposed during the first five years of operations.


For the first year and a half of operations of rural women-led firms (18 months), the survival curve of those who received externally monitored funds (green line) is significantly different and superior to the non-funded (blue line) in Figure 2. As time evolves, both groups of rural women-led nascent firms tend to behave similarly: the survival curves’ confidence intervals are overlaid but more separated than the metropolitan women-led firms shown in Figure 1. As a result of Figure 1 and 2, it is possible to confirm, at least partially, hypotheses 2a. Women-led nascent firms granted external funding are slower than those in rural areas to disengage from the entrepreneurial process, especially during the initial months of operations.
5.2 – Time to become a profitable firm
In the next modeling phase, we took out firms disengaged from the entrepreneurial process to analyze the time to reach six months in a row of profits. Consequently, we have a sample containing 406 cases that reached profitability and 495 censored cases (to the right), trying to become profitable projects. Table 2, Model 3 describes the empirical results, including the control variables plus the dummy variable, receiving monitored external funding. Model 4 shows a model that includes the same variables plus two dummies: rural and female-led firms. In Model 3, the likelihood ratio shows a p-value of <0.001, meaning that at least one of the independent variables contributes significantly to explain the time to the profitability status, rejecting the null hypothesis of overall model significance. The same occurs for Model 4. The AIC test shows that Model 3 explains a higher fraction of the dependent variable’s variance than Model 4.
Other inquiries aimed to test reaching profitability through event history modeling found few variables contributing to explain this outcome (Hechavarría et al., 2016). Neither Models 3 nor 4 show a significant relationship between the percentage of monitored external funding invested in understanding profitability. Thus hypothesis, 1b should be rejected. Nor was the case of rural or female dummy variables in Model 4, and thus, also 2b should be rejected as well.
The strongest relationship found was between industry experience and the time to reach profitability status. From Models 3 and 4, it is possible to note that each additional year of industry experience of a nascent firm owner increases the hazard of profitability by nearly 1% (p-value<0.01). Interestingly, social capital variables (bonding and bridging) account for a positive (weak) association with the hazard of profitability. In Model 3, an additional family helper (bonding social capital) increases the hazard of profitability by nearly 10% (p-value<0.1). In Model 4, this relationship remains unchanged, but after the inclusion of both rural and female dummy variables, an additional non-family helper’s contribution (bridging social capital) also increases the hazard of reaching profitability status by 6.6 (p-value<0.1). The economic activity of nascent firms was also a critical predictor in models 3 and 4. Specifically, nascent firms aiming to operate in the transforming sector are about 1.5 times more likely to achieve profitability than those in business sectors (p-value<0.01).
5.3 – External funding amount on termination
Table 3 shows the empirical results of Models 5, 6, and 7. These models aim to test the relationship between the amount of externally non-monitored funding granted and the likelihood of disengaging from the entrepreneurial process. Model 5 does this for the whole nascent firms’ database, Model 6 for all rural entrepreneurial firms, and Model 7 shows the results for the database compressed of those businesses owned by rural women. Estimates, standard errors, odds ratios, and indicators of overall fit for Models 5, 6, and 7 are shown in Table 4.
The probability of termination of the nascent firm (quit, coded 0 for still operating firms and 1 for those who left the entrepreneurial process) was analyzed as a function of the amount of monitored external funding received and several independent variables in a simple logistic regression equation. For Model 5, assumptions were met, and indicators of influence were also examined. Of the initial 2044 cases combining PSED-I and PSED-II databases, 445 were removed from the analysis due to being not labeled as “good cases[4].” Also, 427 that became profitable firms were not considered for this analysis and were removed from the database. Six cases identified as extreme outlier values were removed (z-scores higher than |6|), resulting in a substantially improved model fit when the final 1166 cases were analyzed.
Model 5 includes all nascent firms in the database, and at least one of the variables explains significantly better a portion of the dependent variable’s variance than an empty model does. (χ2 = 103.9, 18 degrees of freedom, p-value < .001). The odds ratio column of model 5 indicates that the chances of project termination decrease by 26% from a unit increase in the amount of monitored external funding received (p-value < 0.001) relative to those that did not receive an additional percent unit. Also, other capital resources significantly explain the termination probability. For both, an increase in unmonitored external funding and personal funding invested influences the odds of termination. A decrease of 22% in the termination odds is expected due to a unit increase in personal funds invested (p-value < 0.01) relative to those that did not receive this type of funding. In the case of a unit increase in the amount of unmonitored external funding invested, a 26% increase in the odds of termination is expected (p-value < 0.05). Recall that unmonitored external funding is capital coming from family and friends, meaning that a family or friend’s financial involvement in the project could harm its survival chances.
In the case of other intangible resources, the results are the following. The proxies of codified human capital (education) are non-significant, except for postgraduate entrepreneurs: the odds of quitting his/her nascent firm is only 65% of the odds termination of a non-high school graduated entrepreneur (p-value < 0.05). Tacit human capital variables also account for significant effects. In the case of having an additional year of industry experience in the same economic activity of the nascent firm, there is a 26% reduction in the odds of termination (p-value < 0.001) expected. A year increase in start-up experience is associated with an odds decrease of 22% for project termination. However, this is a weak association (p-value < 0.01) with this relationship. Lastly, a year increase in managerial experience is associated with an increased odds of project termination (59%, p-value < 0.001). As mentioned previously, this can result from more experience in detecting when exiting the market is necessary compared to those with less managerial experience. The only control variable showing a significant association with the odds of termination is the size of the team: an increase in one member, the odds of termination increases by 21% (p-value < 0.05).
In Model 6, the analysis was completed using the subsample of rural firms. Assumptions were met, and of the 2044 cases from PSED-I and PSED-II combined, 480 are nascent firms in rural settings (non-rural firms were removed). We also removed nascent firms labeled as not “good cases” and those profitable ones, leaving 293 nascent rural firms in this subsample. Virtually unchanged from Model 5, the odds ratio of the amount of monitored external funding received shows that project termination’ odds decrease by 26% (p-value < 0.001) when this variable increases by one percent unit. Thus, Hypothesis 1c is confirmed.
Model 6 also shows that the relationship between personal funds invested and the odds of termination is expected to decrease. However, this decrease is more pronounced for nascent rural firms (37%) than for all firms considered (p-value < 0.05). While monitored external funding exerts a similar influence on nascent rural firms, the amount of personal funds invested is more critical for rural firms than their non-rural counterparts. Unmonitored external funds variable did not influence rural firms, as it did when all firms were considered.
Model 6 indicates that in rural settings, entrepreneurs with some college training or a community college degree have 58% odds of firm closure compared to those entrepreneurs who did not complete high school (p-value < 0.10). Also, a rural entrepreneur who holds a college degree has a 40% odds of exiting the entrepreneurial process compared to a rural entrepreneur who did not complete high school. In the case of tacit human capital variables, having an additional year of industry experience in the same economic activity of the nascent rural firm resulted in a 30% reduction of the odds of termination (p-value < 0.05). A year increase in start-up experience is not associated with any effect on the odds of project termination in rural settings. In contrast, a year increase in managerial experience is associated with a higher increase in the odds of a rural project termination (65%, p-value < 0.05). Neither social capital nor control variables show any significant association with the odds of termination in Model 6.
Model 7 analyses women-led firms in rural settings. The previous dataset was split to include only the 85 women lead-nascent firms (those labeled as led by a woman or a group of women). Assumptions were met in Model 7. Beyond very few cases in this subsample, this model significantly improves the explained portion of the dependent variable’s variance compared to a model with no covariates. (χ2 = 30.2, 18 degrees of freedom, p-value < 0.05). Since the amount of monitored external funds did not show any significant association with leaving the entrepreneurial process, hypothesis 2c should be rejected.
Only two variables indicated a significant association with the odds ratio of closing operations in Model 7. First, personal funds invested reduce the odds of termination for women-led nascent firms in rural settings. An increase of one percent (unit) is associated with a decrease in project termination odds by 71% (p-value < 0.001). Second, for rural women-led nascent firms, managerial experience is also of great importance. In the same way as the previous models, an additional year of managerial experience raises the odds of termination, but in this case, by 250%.
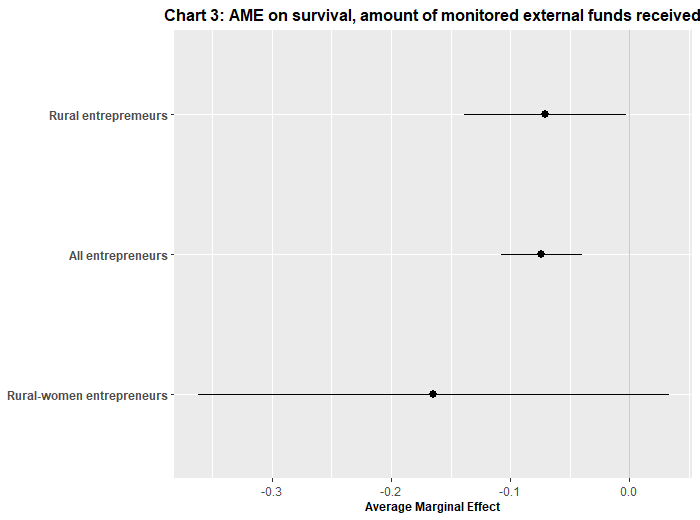
Figure 3 shows the marginal effects of monitored external funds on the probability of nascent firm termination for the three samples utilized: The whole dataset, rural entrepreneurs, and women rural entrepreneurs. By increasing one unit percent of monitored external funding, there is a reduction in the probability of closing operations of -0.073 in the case of rural entrepreneurs.

Similarly, for all the databases of nascent firms, we estimated a marginal effect of -0.070. Both marginal effects are significant, meaning that an increase in the monitored external funds prevents rural and non-rural firms from terminating their operations. It is not the case for rural women entrepreneurs: the marginal effect estimated for monitored external funding was not significant for this group of entrepreneurs.
5.4 – External funding amount on profitability
Table 4 shows the empirical results of Models 8, 9, and 10, aiming to test the relationship between the amount of external non-monitored funding awarded on the probability of reaching six months in a row of profits (profitability status). Model 8 does so for all nascent firms, Model 9 for all rural entrepreneurs’ firms, and Model 10 for rural women-led nascent firms. Table 4 provides estimates, standard errors, odds ratios, and indicators of overall fit. The probability of becoming a profitable firm from a nascent firm (profitability status, coded 0 for still operating firms and 1 for those who reach six months in a row of profits) was analyzed as a function of the amount of monitored external funding received and several independent variables in a simple logistic regression equation.
For Model 8, assumptions were met, and indicators of influence were also examined. Of the initial 2044, and as previously noted, 445 cases were removed due to being labeled as not “good cases.” Also, 654 nascent firms that stopped their operations were not considered for this analysis and were removed from the database. Additionally, six extreme outlier cases were removed (z-scores higher than |6|), improving the model fit when the final 938 cases were analyzed. After the cleaning, as mentioned above, nascent firms are included in the database for Model 11. At least one of the variables significantly explains a percentage of the dependent variable’s variance than a model with no covariates. (χ2 = 76.4, 18 degrees of freedom, p-value < .001).
The odds ratio column of Model 8 indicates that we expect to see a 15% increase in the odds of becoming a profitable firm due to a one-unit percent change in the amount of monitored external funding received by an entrepreneur (p-value < 0.05). Also, for an additional percent change in personal funds invested, there is a 34% change in the odds of reaching profitability status (p-value < 0.01). The household net worth of the entrepreneur shows a negative relationship with the odds of reaching six months of profits. For a percent unit increase in the entrepreneurs’ household net worth, there is a decrease in the odds of reaching profitability status by -12%. However, this association has weak power (p-value<0.1). Industry experience is another variable that influences the outcome investigated here: a 17% increase in the odds of reaching profitability is expected for each additional year of industry experience in the same economic activity of the nascent firm (p-value < 0.05). The size of the entrepreneurial team and operating in the transforming sector are two controls that explain reaching profitability. An additional team member increases the odds of reaching profitability by 20% while intending to open a firm in the transforming sector, resulted in 167% odds of doing so for a nascent firm in the business service sector (base category).
In Model 9, the analysis was completed for 217 nascent rural firms. The number of cases is the result of removing all non-rural firms from the previous database. This model explains a more significant percentage of the dependent variable’s variance through at least one of the variables than a model with no covariates. (χ2 = 30.1, 18 degrees of freedom, p-value < .001). The odds of becoming profitable for rural firms are influenced significantly by the amount of external monitored funding received: an additional percent unit in this variable leads to an increase of 44.8% in the odds of becoming a profitable firm. Consequently, hypothesis 1d is accepted. Team size also exerts some influence on the odds of becoming a profitable firm in the rural setting, but its effect is weak (p-value < .1).
The next goal is to test if the amount of monitored external funding influences project termination of rural women lead-nascent firms. Thus, the next step was compressing the database to contain only women-led ventures in rural settings that did not leave the entrepreneurial process. The last resulted in a database containing just 68 nascent firms lead by a woman or a group of women entrepreneurs. Probably due to the small number of cases, Model 13 fails to significantly explain the variance better than a model with no covariates (χ2 = 23.4, 18 degrees of freedom, p-value > .1). For this reason, we cannot test hypothesis 2d.
Overall, models 1-10 provide important insight into understanding the nuances of rural entrepreneurial resource drivers. Similar to earlier research, externally monitored funding is a significant factor for rural entrepreneur’s success. Many of the drivers that impact rural firms also significantly impact female-led rural firms. However, due to the small number of cases in this sample, more research is needed on female-led rural firms.
These results are important to develop our understanding of rural and female led rural firm success and profitability. However, there are important limitations to this research that should be considered in future research. Following the resource-based theory of the firm, we investigate resources in terms of entrepreneur and firm endowments. However, personality traits could shed additional on this relationship. Thus, another theoretical lens, such as expectancy theory, could focus on how entrepreneurial motivation might answer a broader set of questions than those answered here. In addition, our research is a descriptive one. We do not know the specific mechanisms that make monitored external funding a strategic resource or not and causality is a difficult endeavor in the social sciences. Future research using a longitudinal sample could be leveraged to test causality between external funds and firm performance in rural settings.
The PSED database is an important nationally representative sample of business formation, however, rural and female-led entrepreneurship are relatively small parts of the overall PSED sample, due to the proportion of rural and rural-female led entrepreneurs nationally. This makes it difficult to use these cases in a quasi-experimental design. Thus, designing an oversample of rural entrepreneurs could help us answer causal questions and is possible considering that PSED has oversamples of minority entrepreneurs, but not for rural entrepreneurs. In addition, nascent entrepreneurship is only one piece of the entrepreneurial puzzle as it is only one piece of the entrepreneurial pipeline. As such understanding the nature and stories of who chooses entrepreneurship as a career path and then moreover, more established rural and female entrepreneurs is critical for a more holistic lens of these groups. Qualitative or quantitative work that explores different rural and rural-female led entrepreneurship at different stages and in different ways is critical for understanding how to effectively leverage this approach for the health and wealth of our rural communities.
6. Implications and Future Research
The resource-based theory of the firm states that having strategic resources opens opportunities to develop competitive advantages over other competitors. These competitive advantages might infer higher earnings to the firm, especially over time. Firms also develop competitive advantages based on the strategic resources they exploit. In the context of capital scarcity in rural communities and lack of funding sources, receiving external funding for a nascent rural entrepreneur could operate as a strategic resource. It might be important to recall that strategic resources from Penrose’s viewpoint are valuable, rare, difficult to imitate, and non-substitutable.
Why might external funding operate as a strategic resource for rural firms? In addition to less access to traditional small business and venture capital, rural communities also show more persistent poverty rates than metropolitan areas (USDA, Economic Research Service, 2021). Consequently, rural entrepreneurs might struggle to accumulate capital more than those in urban and suburban areas on average. Thus, monitored external funding is valuable by nature, but it is also rare in rural communities. This research did not find that monitored external funding is associated with reducing disengagement or becoming a profitable venture for women rural entrepreneurs. However, it does so for rural entrepreneurs (no matter gender) in the case of disengagement.
This research also uncovered that externally funded and non-funded rural women entrepreneurs exhibit different disengagement rates during the first year and a half of the entrepreneurial process. After this period, they have similar patterns of firm creation whether they receive externally monitored funds or not. Further research could investigate why this difference takes place. Differences in disengagement time between funded and non-funded rural-women entrepreneurs could result in a broader set of entrepreneurial characteristics, such as motivation or personality traits. Whether women entrepreneurs who seek external funding and avoid disengagement from the entrepreneurial process are, on average, more motivated is an important future research topic. Endogenous factors related to personality could explain both phenomena. Disentangling these factors is tough, but it is possible to proxy the first date of funding using the earliest interview date when the entrepreneur declares the first external fund is received using the PSED dataset. Additional modeling could test for the time to reach profitability and/or abandoning the firm using a repeated event modeling approach.
Another further research avenue that this paper opens is related to the third feature of Penrose’s strategic resource definition. Receiving external funds gives capital to the new firm but could also help in developing difficult-to-imitate resources. There is sufficient evidence that receiving externally monitored funds implies the development of soft managerial skills. The process of obtaining external funds often requires providing financial institutions with short or medium-term prospects about the new venture (Gartner et al., 2012; Hechavarría et al., 2016). The latter implies developing a methodical and systematic assessment of the entrepreneur’s business idea or financial projections (Cassar, 2009), which reduces the asymmetry of information between the firm and financial agents. As such, external sources of capital add more value to nascent firms than other funding sources, such as individual savings or those coming from entrepreneurs’ families.
Another instrument that operates similarly in systematically assessing the new firm’s characteristics is a business plan. These plans are positively associated with the persistence and success of creating a new company (Delmar & Shane, 2003; Liao & Gartner, 2006). It is also commonly requested by financial agents at the time of evaluating a project. In this way, external funding provides an incentive for firms to establish concrete goals and objectives that signal their potential ability to succeed, in addition to contributing important financial resources. Soft managerial skills and business plans are important components where existing small business development organizations and public policy might support and enable nascent firms. Small business development centers, local university programs, efforts like SCORE but highly focused on rural communities could contribute to the resource development of rural and female-led firms.
We also found that the amount of monitored external funds is associated negatively with the likelihood of nascent firm termination in rural communities. However, this variable did not exert any influence on women rural entrepreneurs. This finding is important for additional research. The amount of funds granted could be related to discrimination towards women entrepreneurs in the financial system and in rural settings. As found previously, gender is a decisive factor in the amount of micro-credit granted, as the study of Brana (2013) found for French rural communities. Further investigation using PSED or other datasets that include rural entrepreneurs and data on external funds received could add additional insight into this issue in American rural communities.
As discussed earlier, research already finds a gender bias broadly as it relates to women entrepreneurs. This bias may exist for many reasons, however, may also benefit from both public and private incentives that may benefit women, rural, or other underserved entrepreneurial talent. Several states have passed rural jobs programs that provide financial support to rural entrepreneurs who can document employing certain numbers of people, along with other key metrics (Cromartie, 2017). This type of policy tool may exhibit some bias due to differences in the types of entrepreneurship practiced by different groups, however, this type of policy has the benefit of being “blind” to these characteristics as long as certain employment characteristics are met. Federal policy programs, like the 2017 Opportunity Zones Act and the Federal New Markets Tax Credit are targeted to serve underserved communities, including many in rural areas. Programs like these are important to consider as additional tools to empower rural and female entrepreneurs across the country (Cromartie, 2017).
The fact that monitored external funding is associated with nascent firm termination in rural communities and its non-significance on women rural entrepreneurs opens another question: Do men and women manage monitored external funds differently? Through PSED, new research avenues could also answer this question. Again, the timing between receiving external funds and entrepreneurs’ decisions is central to answer this type of question. Some of the key questions this research could explore: are there differences between women and men rural entrepreneurs in terms of investing more of their own money after receiving external funds? Do differences in gender play a role in starting to work full-time in the nascent firm after receiving external funding? This is an additional area where policy makers might also consider tools or resources to allow for more understanding of this issue. For example, the US Small Business Administration and Small Business Development Centers could provide critical knowledge and mentoring specifically for rural and underserved groups that have received external funding. These could be relatively “low-cost” services like webinars or virtual mentoring to provide additional support for the nascent entrepreneur. These and other issues are beyond the scope of this paper, but answering these questions is critical to understand the consequences of entrepreneurial gender differences in rural settings.
7. Conclusions
Synthesizing key ideas and literature in the field of entrepreneurship, this research sought to examine issues related to rural and female-led rural firm success. Largely driven by a resource theory of entrepreneurial success, this research examined the importance of “resource” oriented questions for rural vs. non-rural nascent firms generally. By adapting previous research and models of nascent firm gestation and profitability, models examine the importance of individual characteristics, social capital, externally monitored funding, unmonitored external funding, personal funding, and other key variables on rural and rural, female-led firm’s ability to stay engaged in the entrepreneurial process and become profitable.
Confirming earlier research, monitored external funds is a significant variable preventing rural and non-rural firms from disengaging from the entrepreneurial process. While not significant for rural women entrepreneurs, rural women-led nascent firms granted external funding are slower than female-led non-funded firms to disengage from the entrepreneurial process, especially during the early months of the gestational phase. These results confirm the importance of external resources for entrepreneurs and the nuanced relationship that female-led firms have with different types of funding sources.
Models results also confirm the importance of the personal funds invested for women-led firms in rural settings. This result underscores research around potential gender inequities or bias in external or formal funding streams, as well as cultural and educational gaps for women entrepreneurs in rural settings. Motivation, knowledge, fear and social norms, among other factors all play a role in the likelihood of any entrepreneur, but especially a woman-led firm in a rural setting, to seek external funding sources. However, reliance on personal funds is a potentially significant limiting factor for rural women’s entrepreneurial success.
In conclusion, while many entrepreneurial factors for rural and non-rural entrepreneurs are similar, there are some differences. This was especially true for rural, female-led entrepreneurs where there are some clear distinctions in model results. In general, these results highlight that rural communities are not the same as urban or suburban communities and moreover, that entrepreneurs in these communities may have similar needs and drivers but may also have unique needs and drivers. In this sense, this work underscores the importance of additional research on rural entrepreneurship to better understand the ways in which communities can enable, support and even incentivize the success of their rural and rural-female entrepreneurial base.
The specific date that defines gestation is the first of the two activities within the 12 months period These possible startup activities are: Invested own money; Began business plan Developed model, prototype; Purchased materials, supplies, parts; Define markets to enter; Promote products or services; Sales, income, or revenue; Leased, acquired major assets; Talk to customers; Financial projections; Full time start-up work; Saving money to invest in firm; Phone book listing for business; Established bank account for firm; Obtained supplier credit; Began to organize start-up team; First use of physical space; Hire lawyer; Business plan finished; Model, prototype fully developed; Signed ownership agreement; Proprietary technology developed; Invested own money; Investment in legal business; Know listed in Dun and Bradstreet; Signed ownership agreement; Full-time start-up work; Invested own money; Received patent, copyright, trademark; Signed ownership agreement; Signed ownership agreement; Invested own money; Full time start-up work; Signed ownership agreement; Invested own money; Full time start-up work; Full time start-up work. Serious thought on starting a company it is an activity asked, but it is not considered to start or end counting gestations since virtually all entrepreneurs mentioned it (from Reynolds, 2017).
This variable was corrected by 2005 prices
Good cases" are those qualified as active nascent entrepreneurs for which there are one or more follow-up interviews.